
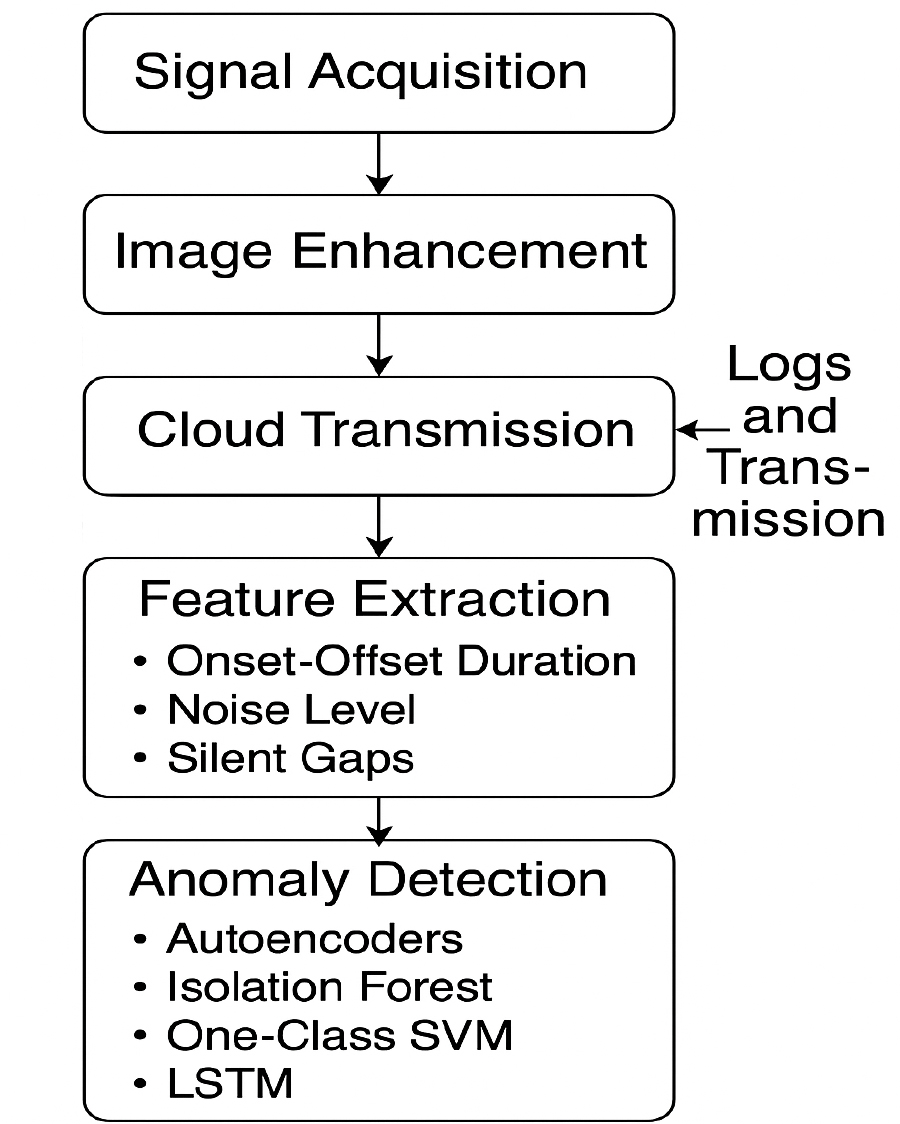
Figure 1.
Block diagram of the proposed diagnostic pipeline for cloud-connected ultrasound systems using real pulse-echo signal data.
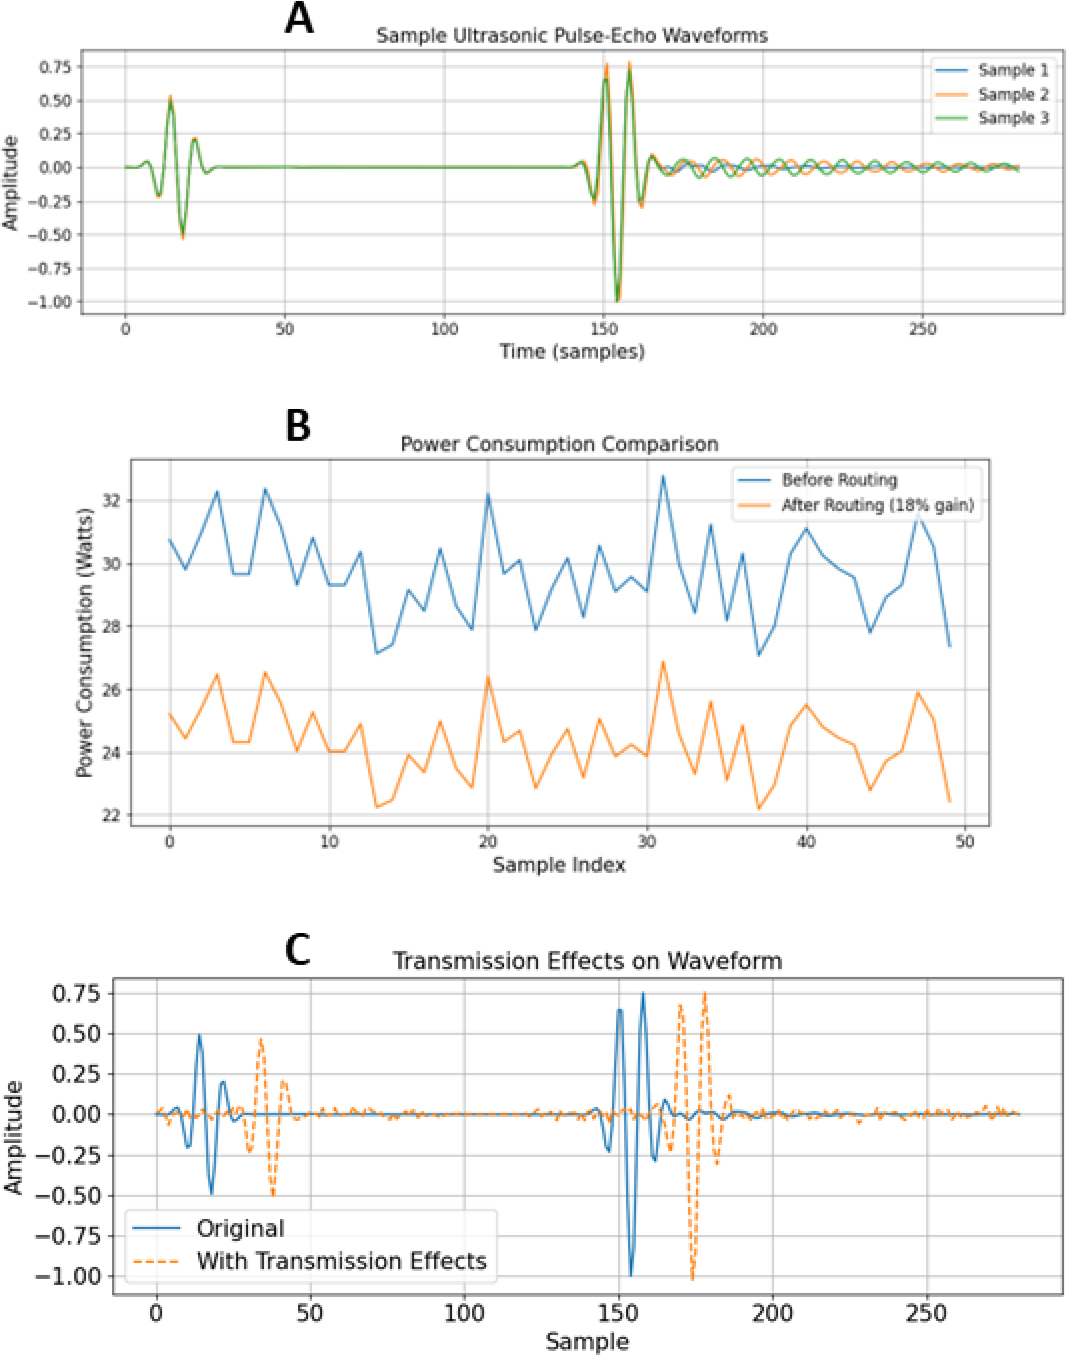
Figure 2.
(A) Sample ultrasonic pulse-echo waveforms exhibiting typical transient–decay patterns. (B) Power consumption before and after adaptive routing, showing an average gain of 18% in efficiency. (C) Overlay of original and distorted waveforms demonstrating the impact of cloud transmission artifacts including delay, dropout, and noise.
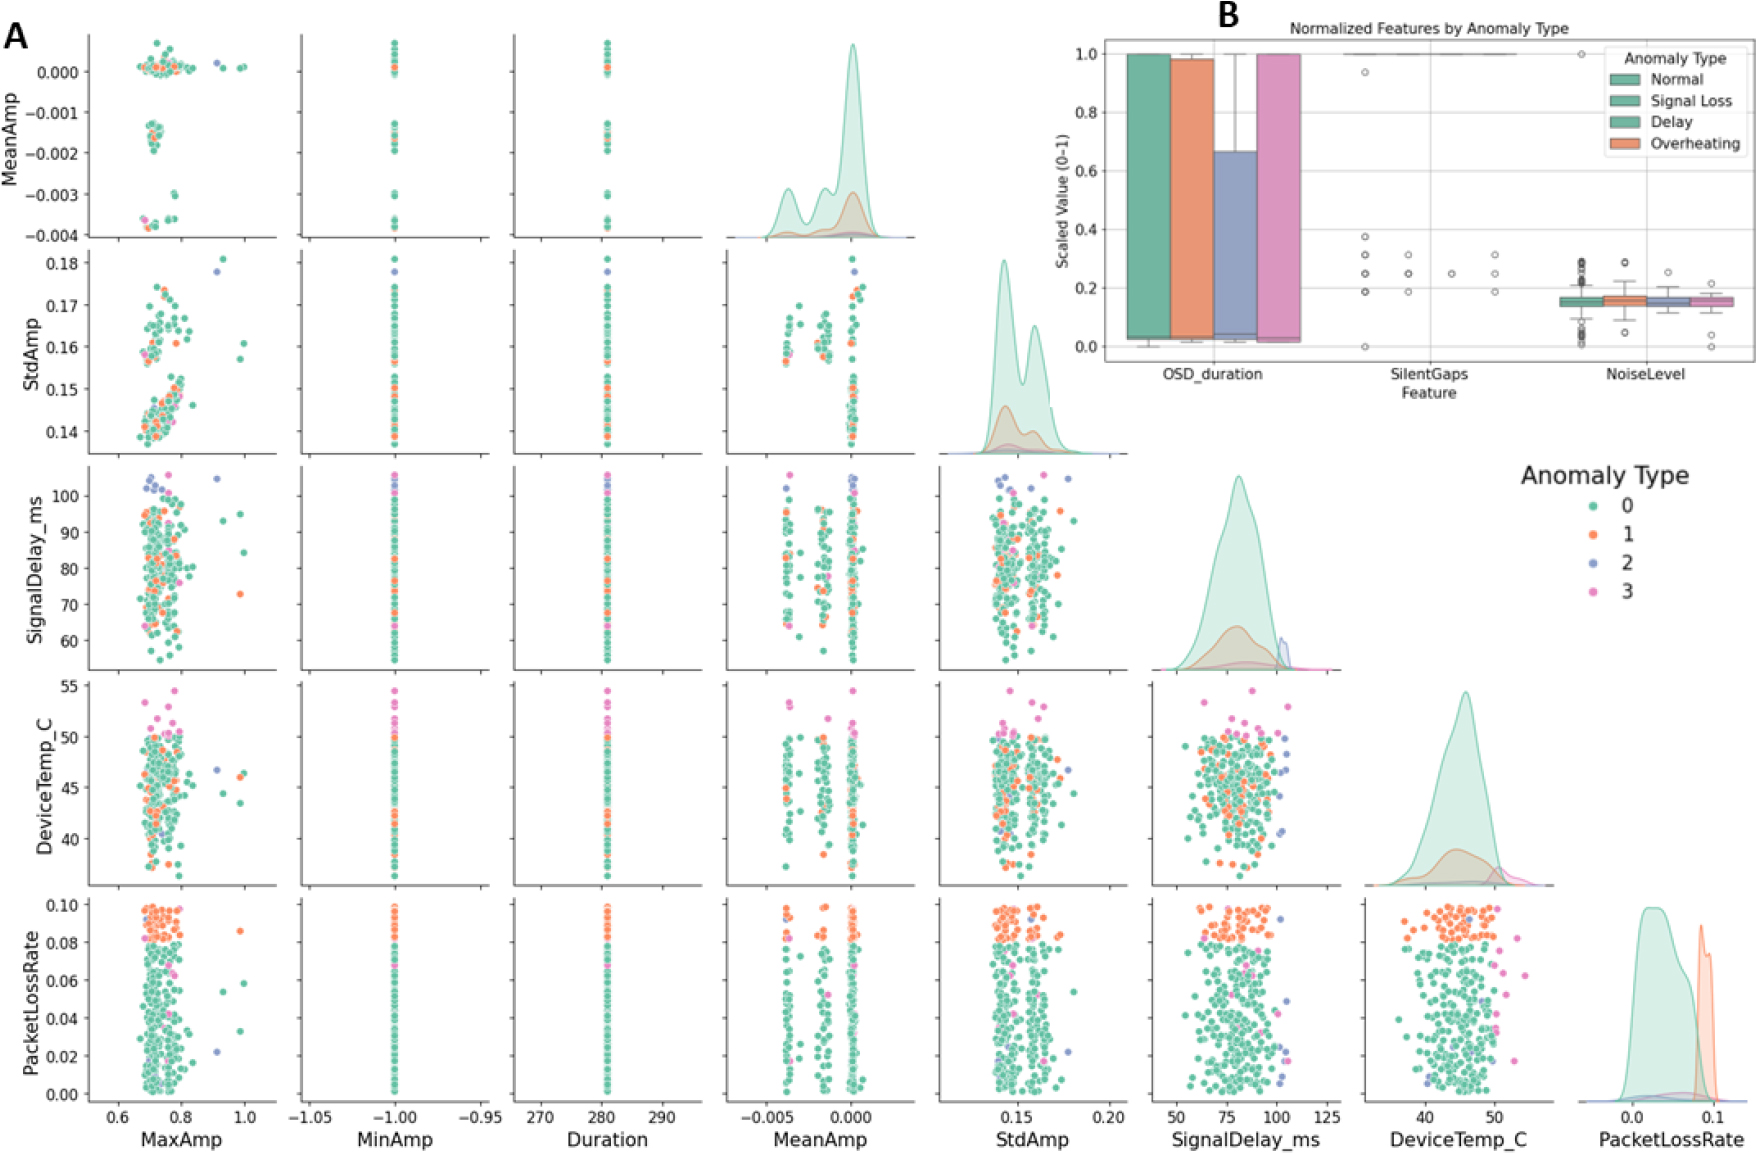
Figure 3.
(A) Pairwise scatter plot matrix showing the distribution and interaction of diagnostic and transmission-related features across four anomaly types. Features include both waveform-derived parameters (e.g., MaxAmp, StdAmp) and device metrics (e.g., SignalDelay_ms, DeviceTemp_C, PacketLossRate). (B) Normalized distribution of OSD duration, silent gaps, and noise level, highlighting statistically significant differences between anomaly classes, supporting reliable classification by the diagnostic model.
Table 1.
Multiclass Classification Performance of the Diagnostic System
| Anomaly Type | Precision | Recall | F1-Score | Support |
|---|---|---|---|---|
| Normal | 1.00 | 1.00 | 1.00 | 273 |
| Signal Loss | 1.00 | 1.00 | 1.00 | 62 |
| Delay | 1.00 | 1.00 | 1.00 | 12 |
| Overheating | 0.94 | 1.00 | 0.97 | 16 |
| Overall Accuracy | 1.00 | 363 | ||
| Macro Avg | 0.99 | 1.00 | 0.99 | 363 |
| Weighted Avg | 1.00 | 1.00 | 1.00 | 363 |
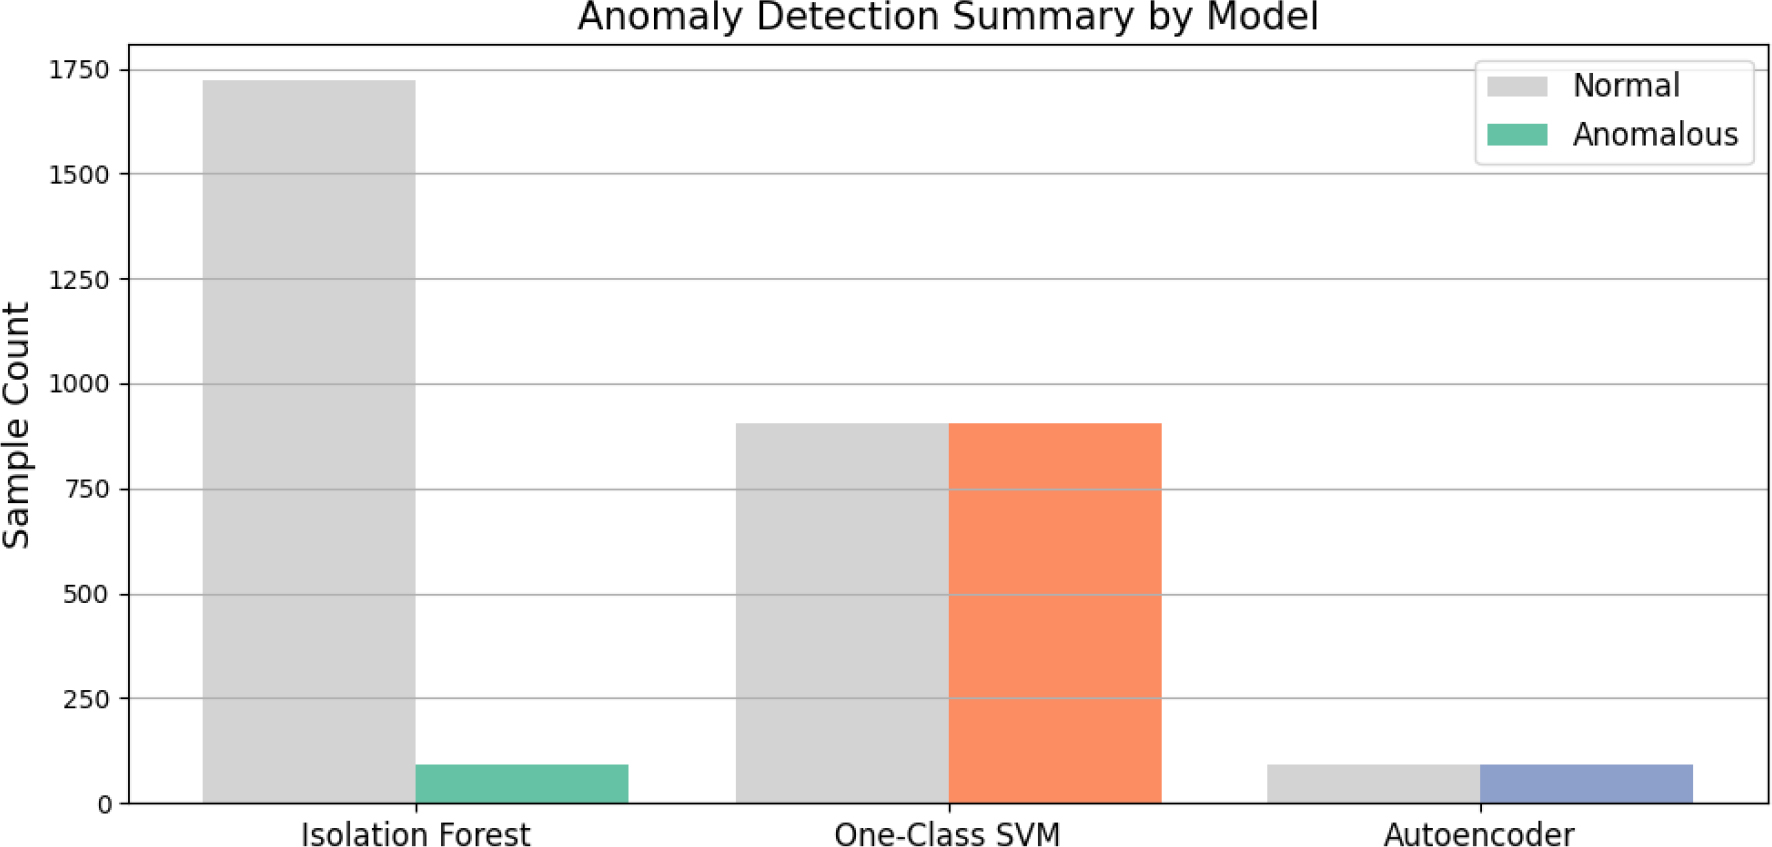
Figure 4.
Bar chart comparing anomaly detection results from Isolation Forest, One-Class SVM, and Autoencoder models. Normal vs. anomalous classification counts are shown per model, highlighting differences in sensitivity and selectivity across methods.