
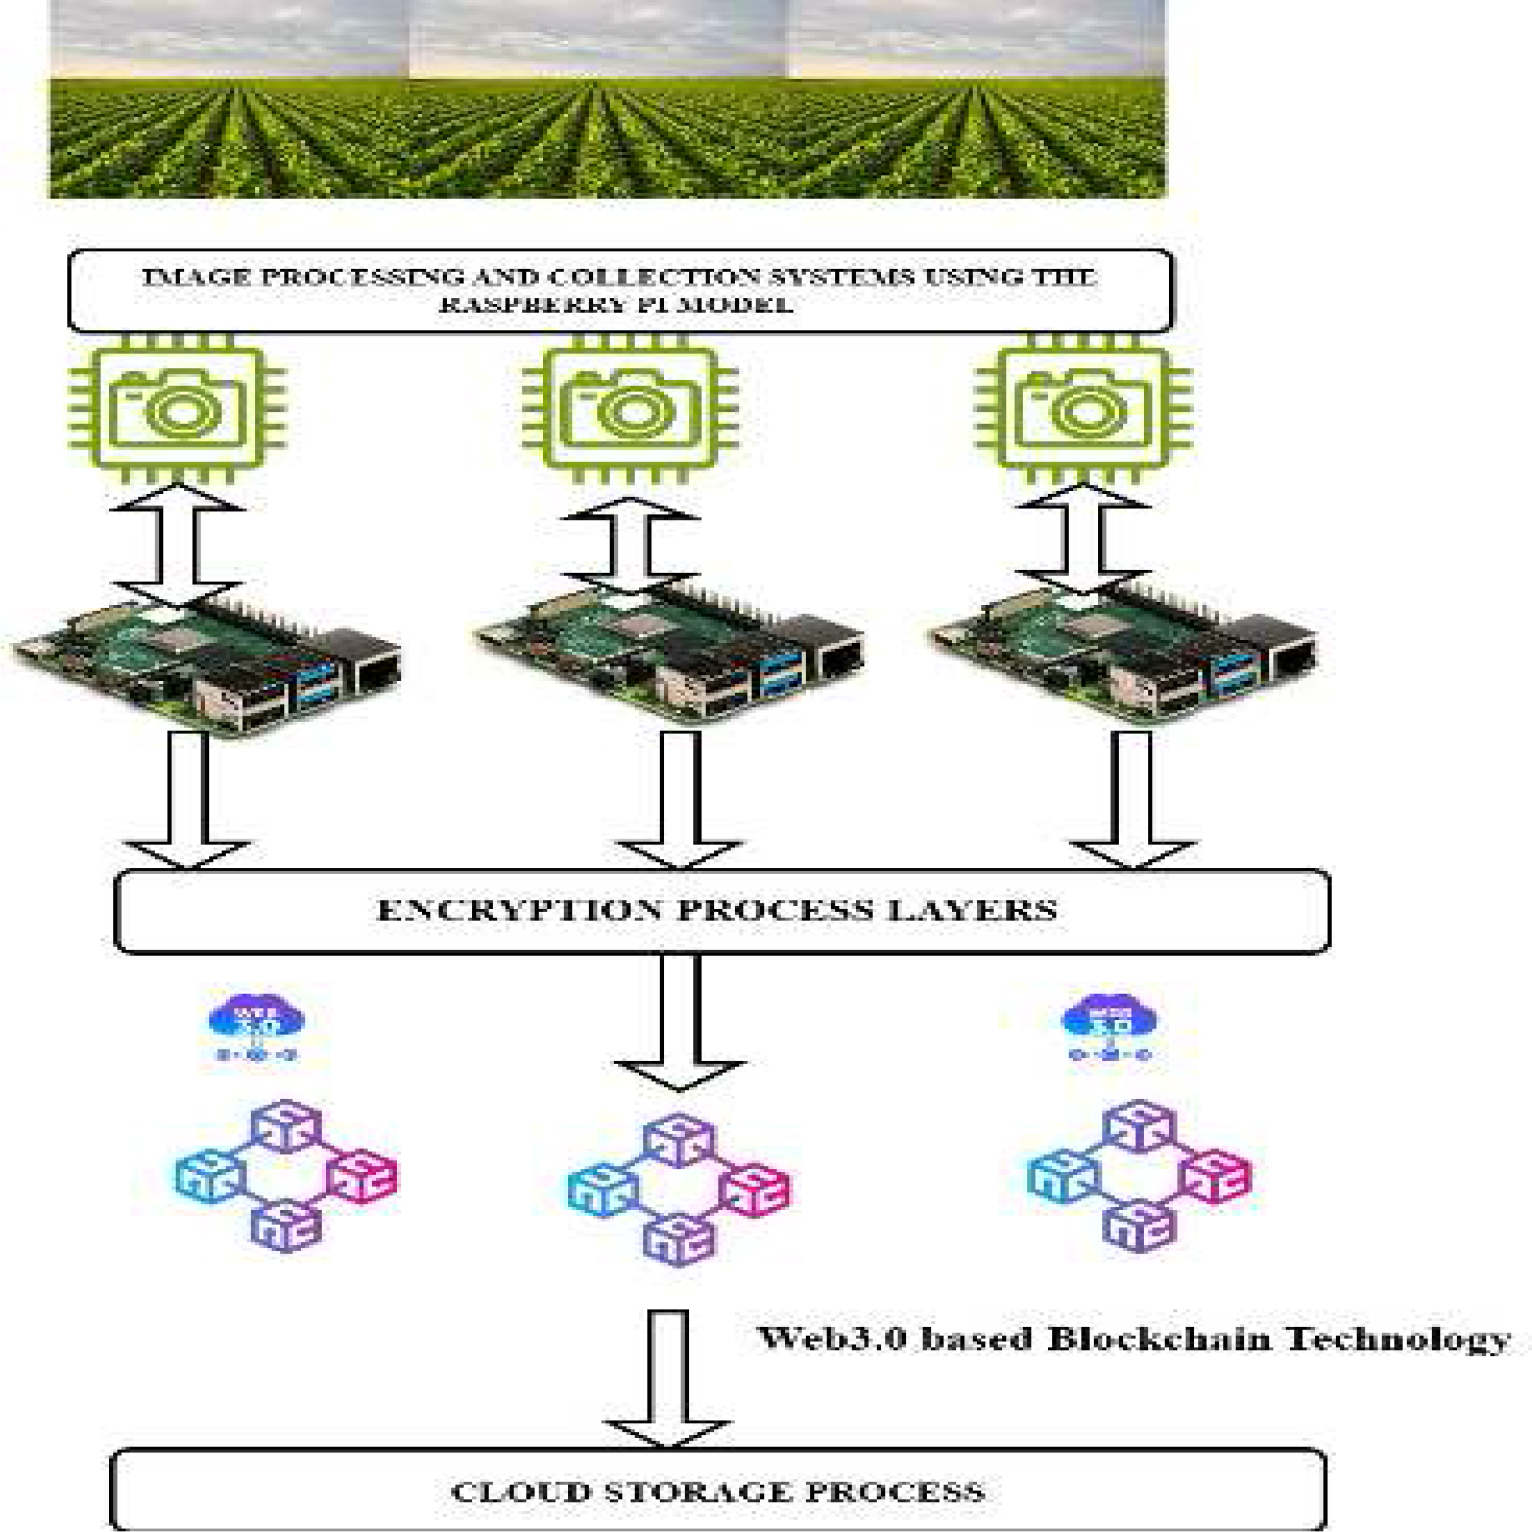
Figure 1:
Web.3.0-Block Chain Frameworks for Secured Plant Disease Detection
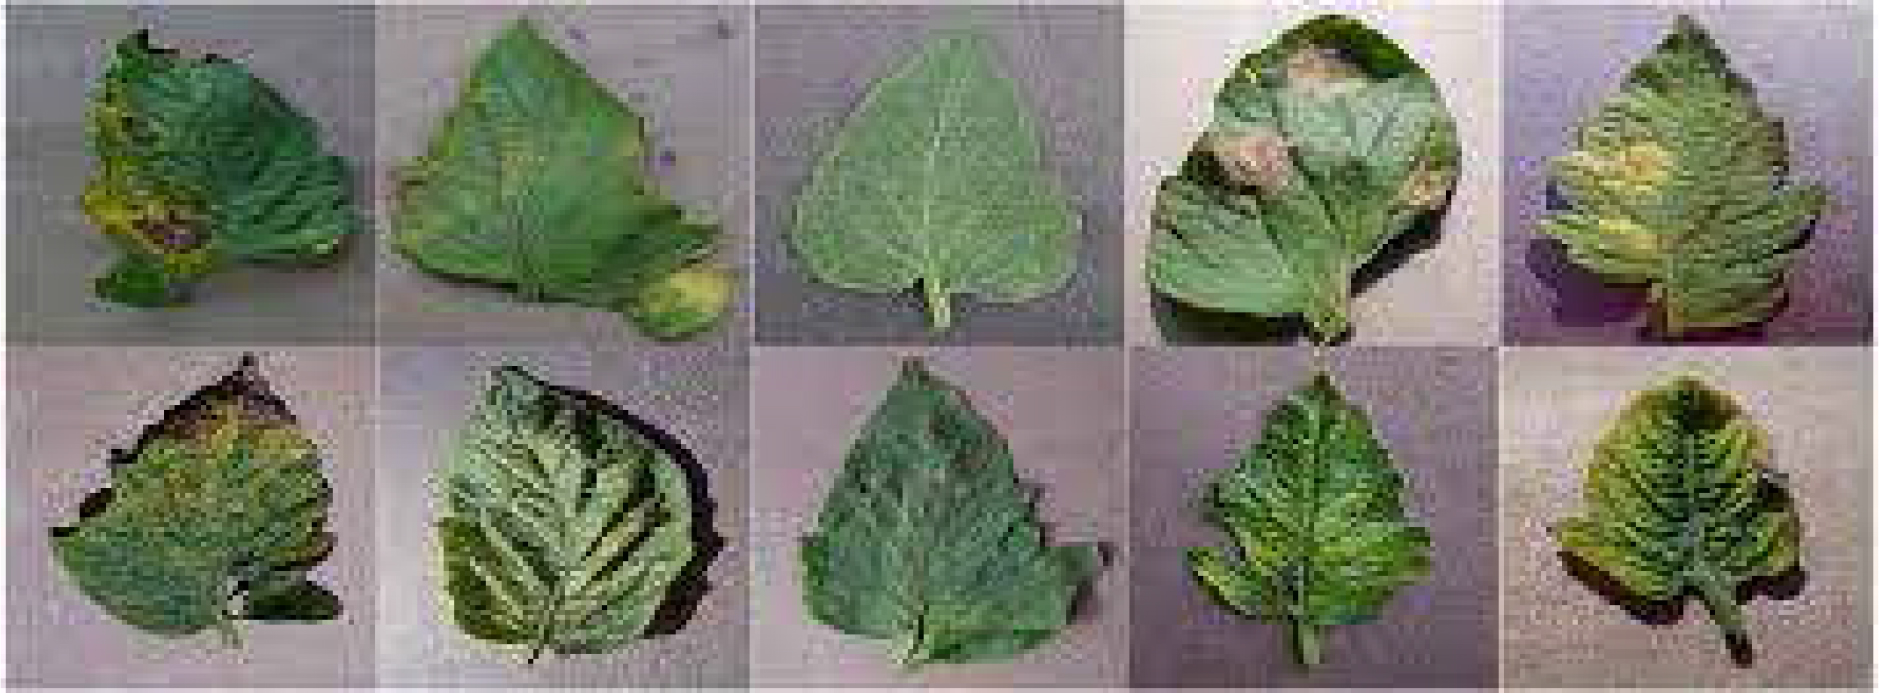
Figure 2:
Sample Plant Disease Captured from the Image Acquisition Systems
| Steps | Algorithm-1 //Encryption Process Involved For the Complete Images |
|---|---|
| 1 | Input : Plant Images |
| 2 | Output : Encrypted Images |
| 3 | While n=1 to Max_iterations |
| 4 | X= Scrolls_Maps Creation using Equation(1),(2) and(3) |
| 5 | Rescale the X into 256 |
| 6 | Y1= X Permutated I1//Intermediate Key Generation Process |
| 7 | Y2 =Y1 Permutated I2//Intermediate Encrypted Results |
| 8 | Y3= Y1 ^ Y2 |
| 9 | End |
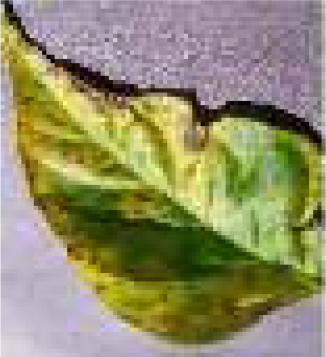
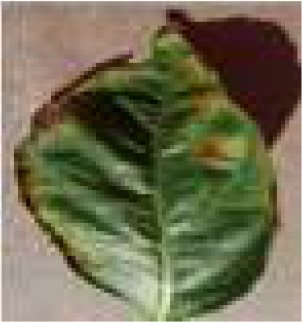
Table 1:
NIST Performance of the Recommended Key generation
| Sl.No | NIST Test Specification | Status of test |
|---|---|---|
| 1 | DFT Test | PASS |
| 2 | RunTest | PASS |
| 3 | Long Run Test | PASS |
| 4 | Frequency Test | PASS |
| 5 | Block Frequency Test | PASS |
| 6 | Frequency MonoTest | PASS |
| 7 | Matrix Rank Test | PASS |
| 8 | Lempel-ZIV Compression Test | PASS |
| 9 | Random Excursion Test | PASS |
| 10 | Universal Statistical Test | PASS |
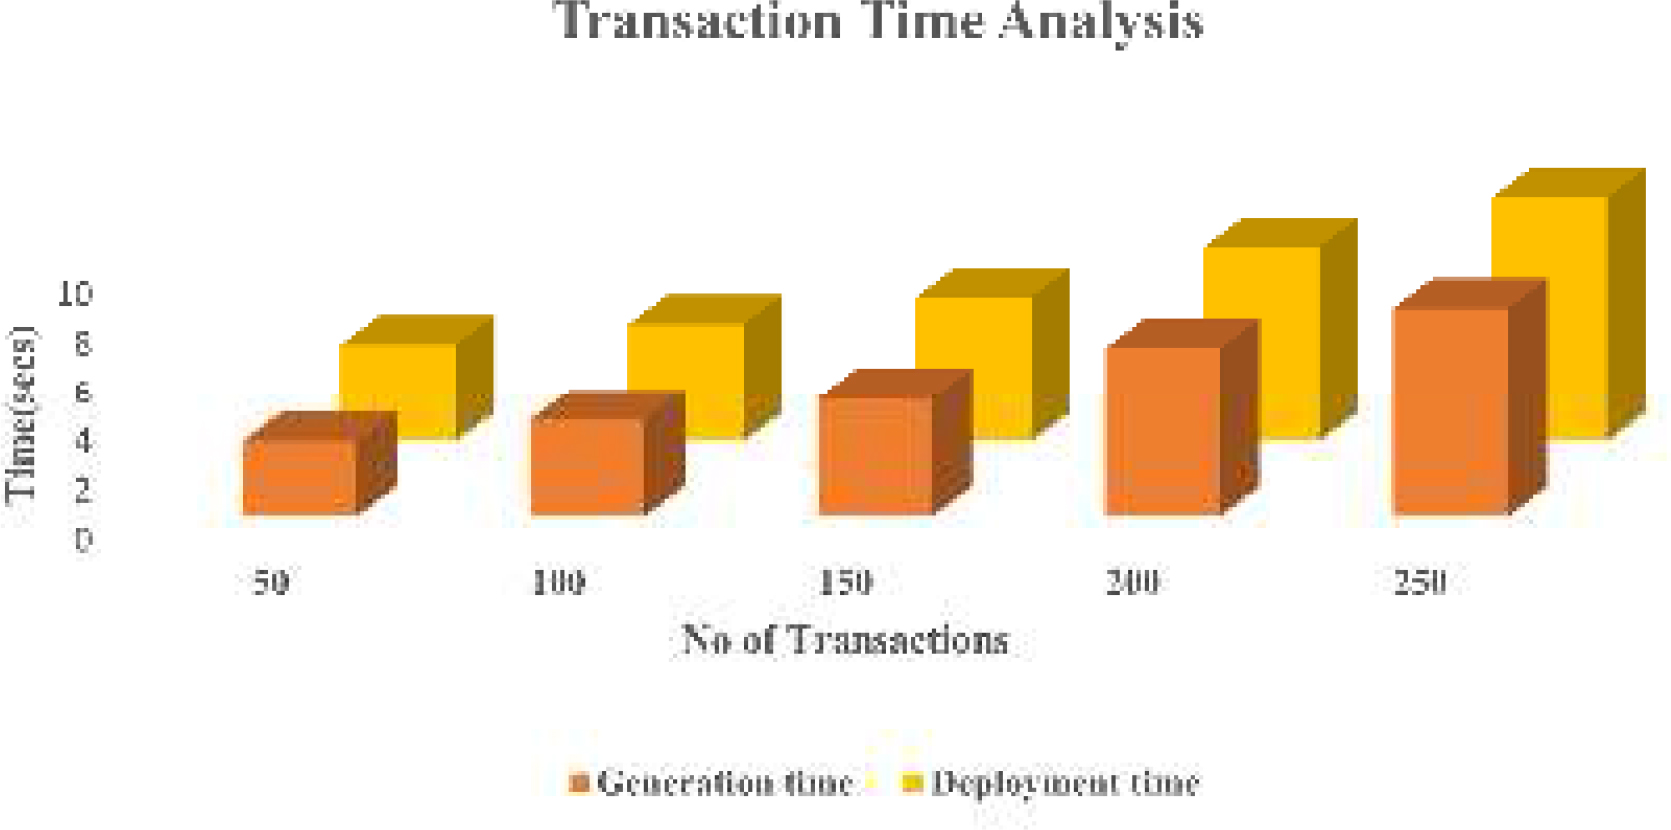
Figure 3:
Transaction Time Analysis for the Recommended approach
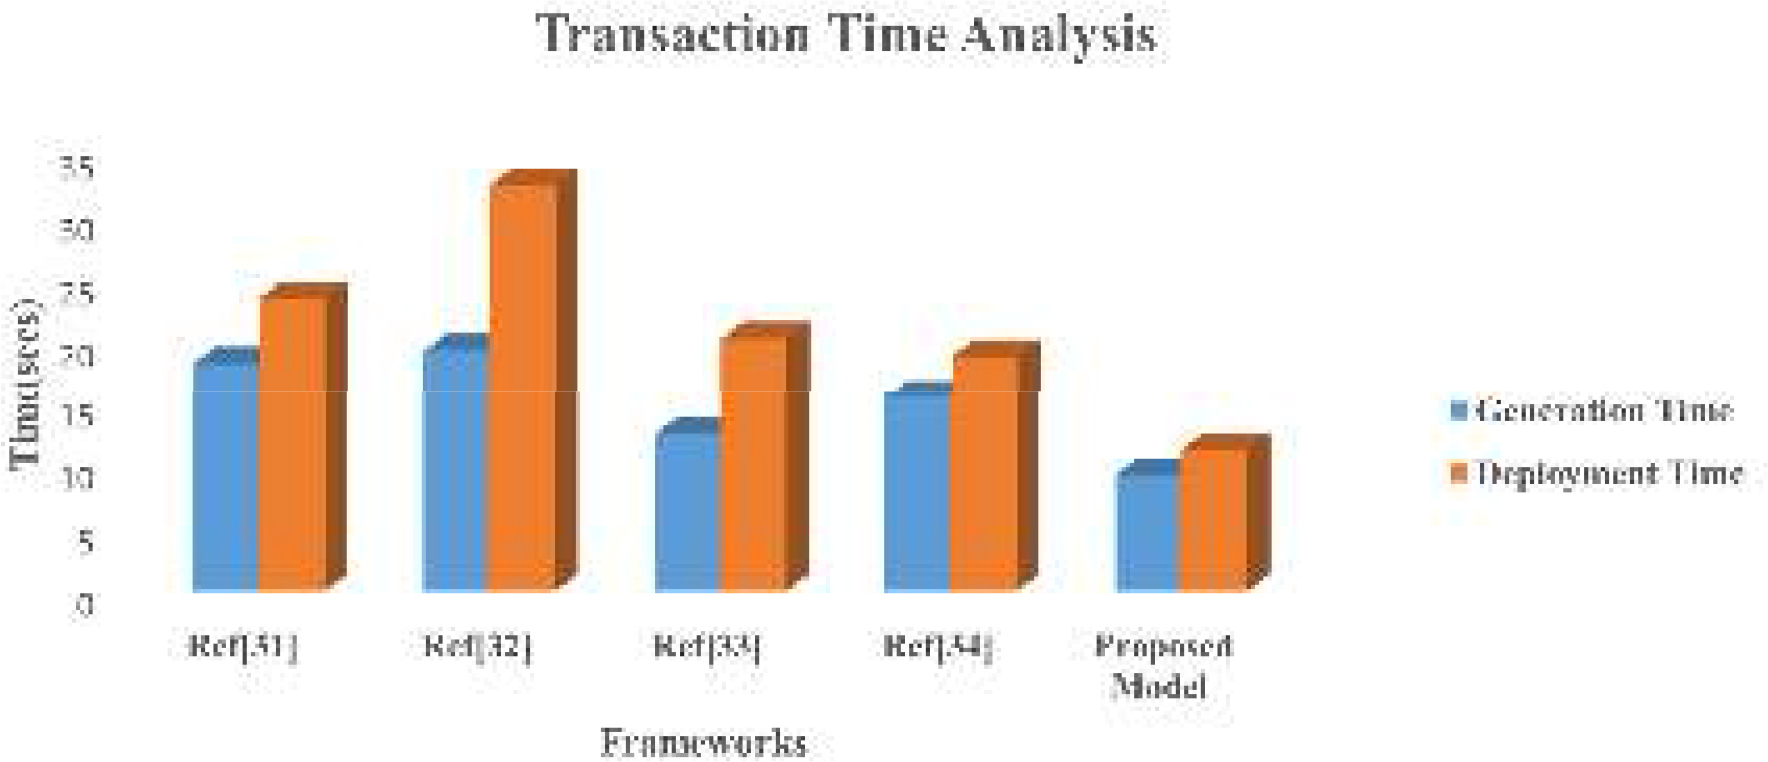
Figure 4:
Analysis Average of 100 Transactions with residing approaches.
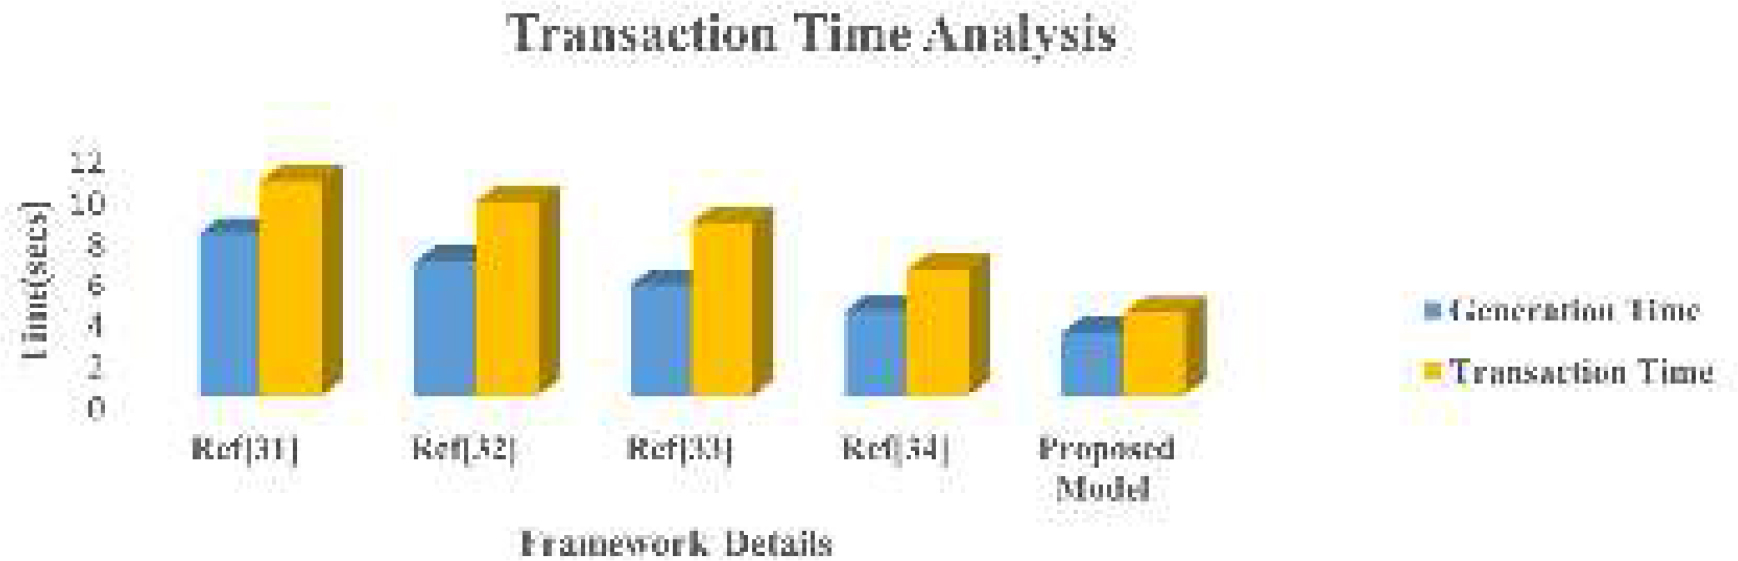
Figure 5:
Analysis Average of 200 Transactions with residing approaches.