
Table 1
The number of mothers in particular combinations
| Treatment number | Treatment temperature and photoperiod | Number of mothers for linaeges L1, L2, and T, respectively |
|---|---|---|
| I | 23 °C, 16L/8D | 48, 49, 48 |
| II | 23 °C, 8L/16D | 50, 50, 29 |
| III | 15 °C, 8L/16D | 11, 22, 32 |
Table 2
Effect of photoperiod and temperature on the preoviposition period of T. tabaci lineages (days) (mean ± 95% confidence interval)
| Lineages | Treatments | ||
|---|---|---|---|
| I (23 °C, 16L/8D) | II (23 °C, 8L/16D) | III (15 °C, 8L/16D) | |
| L1 | 2.55 ± 0.2a (n = 49) | 2.78 ± 0.4a (n = 50) | 27.72 ± 6.9b (n = 11) |
| L2 | 2.40 ± 0.3a (n = 48) | 4.50 ± 0.5b (n = 50) | 17.80 ± 2.8c (n = 22) |
| T | 2.76 ± 0.3a (n = 49) | 3.37 ± 1.1a (n = 29) | 9.03 ± 1.6b (n = 32) |
[i] Note: Different letters indicate a significant difference between photoperiod (column) and temperature (column) within lineages (column) (Games–Howell, p < 0.05)
Table 3
Incidence of reproductive diapause among the lineages at different treatments (%)
| Lineages | Treatments | ||
|---|---|---|---|
| I (23 °C, 16L/8D) | II (23 °C, 8L/16D) | III (15 °C, 8L/16D) | |
| L1 | 0 | 0 | 50 (n = 11/22) |
| L2 | 0 | 0 | 42 (n = 16/38) |
| T | 0 | 40a (n = 21/50) | 28a (n = 14/50) |
[i] Note: see Table 2
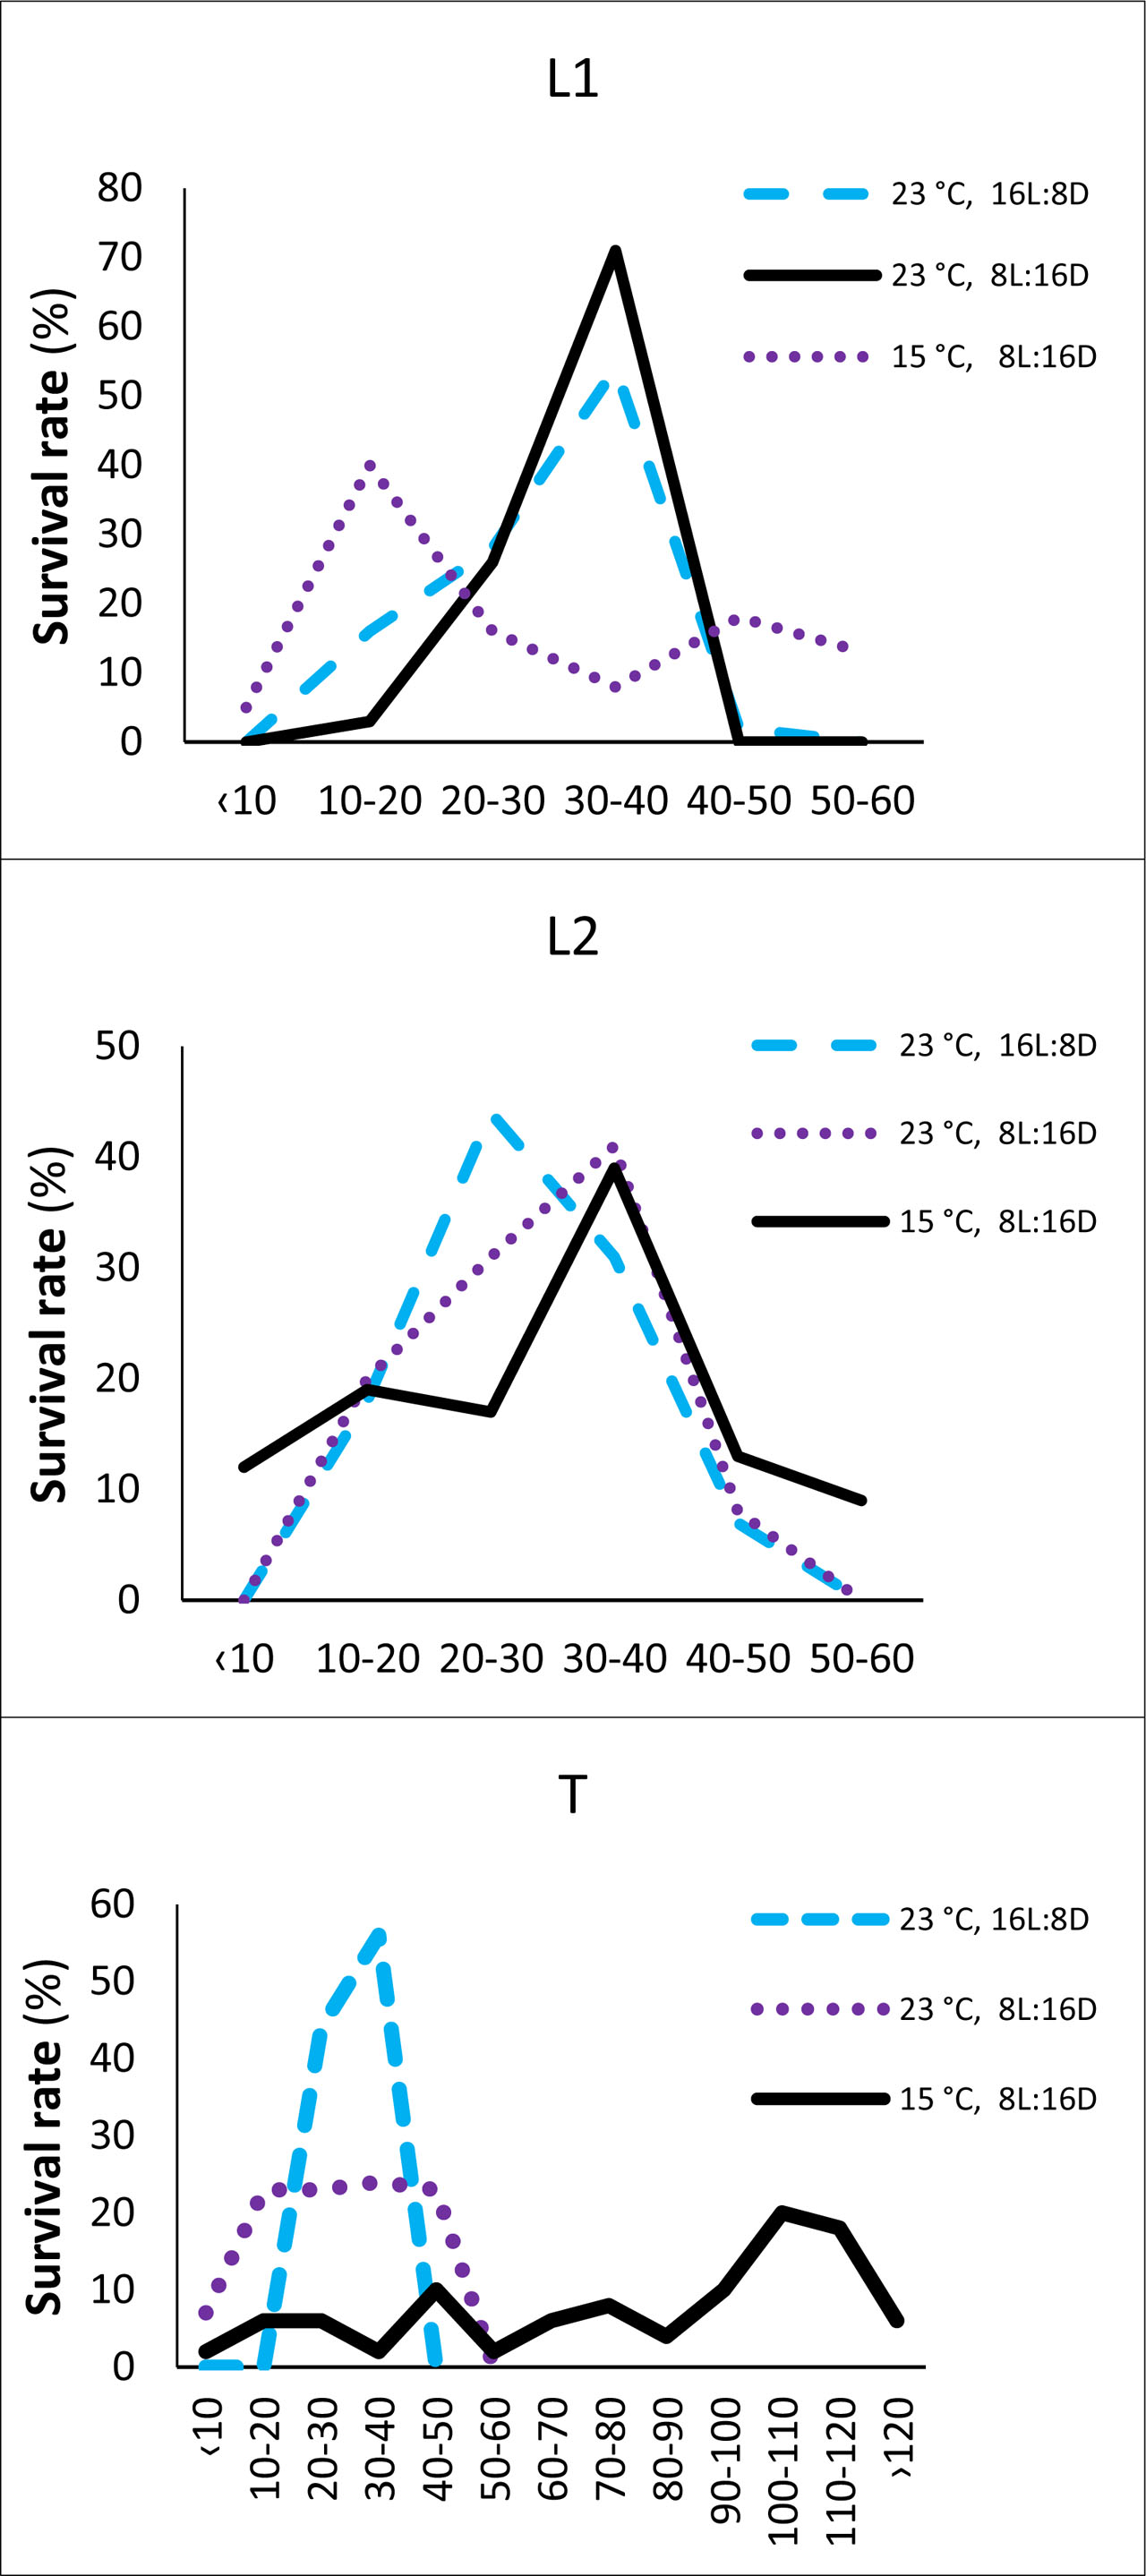
Figure 1
Effects of temperature and photoperiod on the survival rate of L1, L2, and T lineages of adult females at 23 °C under long and short daylight and at 15 °C under short daylight
Table 4
Effect of photoperiod and temperature on oviposition period of T. tabaci lineages (days) (mean ± 95% confidence interval)
| Lineage | Treatments | ||
|---|---|---|---|
| I (23 °C, 16L/8D) | II (23 °C, 8L/16D) | III (15 °C, 8L/16D) | |
| L1 | 23.60 ± 1.9b (n = 49) | 14.02 ± 1.8a (n = 50) | 10.72 ± 2.7a (n = 11) |
| L2 | 20.31 ± 1.5b (n = 48) | 16.80 ± 1.9ab (n = 50) | 13.75 ± 5.4a (n = 22) |
| T | 20.50 ± 1.5b (n = 49) | 14.90 ± 3.2a (n = 29) | 14.71 ± 3.1a (n = 32) |
[i] Note: see Table 2
Table 5
Effect of photoperiod and temperature on longevity of reproducing females of T. tabaci lineages (days) (mean ± 95% confidence interval)
| Lineage | Treatments | ||
|---|---|---|---|
| I (23 °C, 16L/8D) | II (23 °C, 8L/16D) | III (15 °C, 8L/16D) | |
| L1 | 29.51 ± 2.2a (n = 49) | 30.90 ± 1.3a (n = 50) | 48.90 ± 8.7b (n = 11) |
| L2 | 25.69 ± 1.8a (n = 48) | 28.52 ± 2.5a (n = 50) | 34.22 ± 6.3b (n = 22) |
| T | 29.76 ± 1.2a (n = 49) | 38.06 ± 4.3b (n = 29) | 76.89 ± 12.4c (n = 32) |
[i] Note: see Table 2
Table 6
Effect of photoperiod and temperature on fecundity of T. tabaci lineages (in days) (mean ± 95% confidence interval)
| Lineage | Treatments | ||
|---|---|---|---|
| I (23 °C, 16L/8D) | II (23 °C, 8L/16D) | III (15 °C, 8L/16D) | |
| L1 | 89.30 ± 5.5a (n = 49) | 40.14 ± 5.4b (n = 50) | 7.00 ± 1.6c (n = 11) |
| L2 | 80.31 ± 8.3a (n = 48) | 46.94 ± 4.3b (n = 50) | 13.85 ± 4.9c (n = 22) |
| T | 86.76 ± 6.6a (n = 49) | 39.34 ± 10.3b (n = 29) | 17.87 ± 3.3c (n = 32) |
[i] Note: see Table 2