
Figure 1

Figure 2
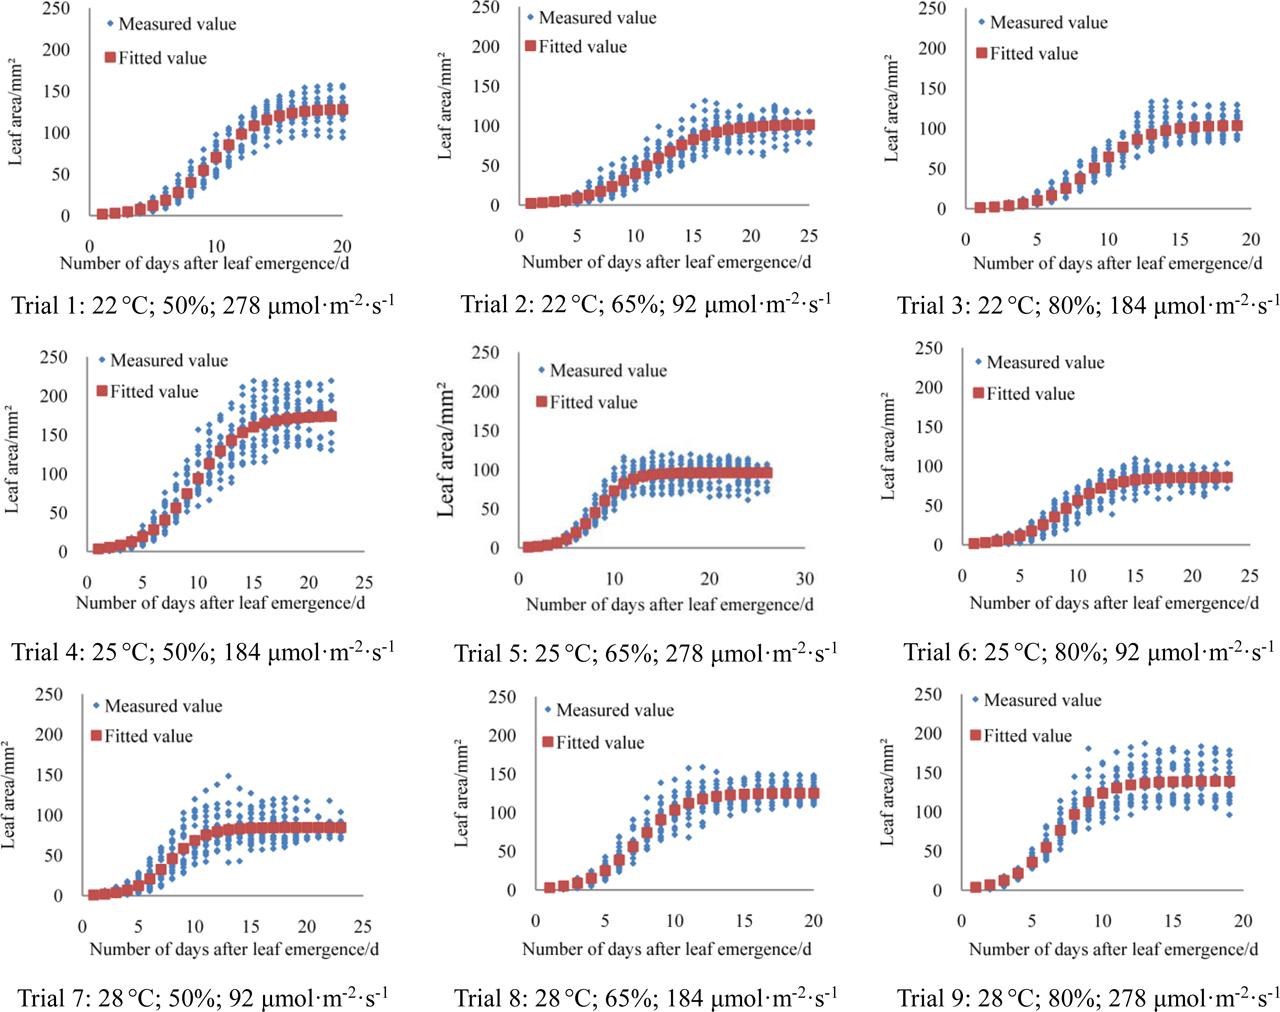
Figure 3

Figure 4

Range analysis results of the final size and the number of the rosette leaves of A_ thaliana
| Trial number | Trial factors | Estimated results | ||||
|---|---|---|---|---|---|---|
| T | H | I | Final leaf size per mm2 | Leaf number | ||
| temperature (°C) | humidity (%) | light intensity (μmol·m−2·s−1) | ||||
| Trial design | 1 | 22 | 50 | 278 | 129.03 | 21 |
| 2 | 22 | 65 | 92 | 102.06 | 16 | |
| 3 | 22 | 80 | 184 | 104.26 | 18 | |
| 4 | 25 | 50 | 184 | 174.31 | 15 | |
| 5 | 25 | 65 | 278 | 95.99 | 15 | |
| 6 | 25 | 80 | 92 | 85.90 | 14 | |
| 7 | 28 | 50 | 92 | 84.75 | 12 | |
| 8 | 28 | 65 | 184 | 125.30 | 11 | |
| 9 | 28 | 80 | 278 | 139.18 | 12 | |
| Final leaf size | K1 | 335.35 | 388.09 | 272.71 | ||
| K2 | 356.2 | 323.35 | 403.87 | |||
| K3 | 349.23 | 329.34 | 364.21 | |||
|
| 111.78 | 129.36 | 90.90 | |||
|
| 118.73 | 107.78 | 134.62 | |||
|
| 116.41 | 109.78 | 121.40 | |||
| Range R | 6.95 | 21.58 | 43.72 | |||
| Leaf number analysis | K1 | 55 | 48 | 42 | ||
| K2 | 44 | 42 | 44 | |||
| K3 | 35 | 44 | 48 | |||
|
| 18 | 16 | 14 | |||
|
| 15 | 14 | 15 | |||
|
| 12 | 15 | 16 | |||
| Range R | 6 | 2 | 2 | |||
Analysis of variance for the final rosette leaf size of A_ thaliana
| Source | SS | DF | MS | F-value | Fα | Sig. |
|---|---|---|---|---|---|---|
| T | 75.11 | 2 | 37.56 | 0.026 | F0.05(2,2) = 19.0 | |
| H | 853.19 | 2 | 426.60 | 0.30 | ||
| I | 3018.77 | 2 | 1509.39 | 1.06 | ||
| Error | 2860.54 | 2 | 1430.27 | |||
| Total | 6807.61 | 8 |
Analysis of variance for the number of rosette leaves of A_ thaliana
| Source | SS | DF | MS | F-value | Fα | Sig. |
|---|---|---|---|---|---|---|
| T | 66.89 | 2 | 33.45 | 42.88 | F0.05(2,2) = 19.0 | ** |
| H | 6.22 | 2 | 3.11 | 3.99 | ||
| I | 6.22 | 2 | 3.11 | 3.99 | ||
| Error | 1.56 | 2 | 0.78 | |||
| Total | 80.89 | 8 |
Trial environment parameters of each group
| Trial number | Trial factors | Trial factors | ||
|---|---|---|---|---|
| T | H | I | ||
| temperature (°C) | humidity (%) | light intensity (μmol·m−2·s−1) | ||
| 1 | 22 | 50 | 278 | 22 °C; 50%; 278 μmol·m−2·s−1 |
| 2 | 22 | 65 | 92 | 22 °C; 65%; 92 μmol·m−2·s−1 |
| 3 | 22 | 80 | 184 | 22 °C; 80%; 184 μmol·m−2·s−1 |
| 4 | 25 | 50 | 184 | 25 °C; 50%; 184 μmol·m−2·s−1 |
| 5 | 25 | 65 | 278 | 25 °C; 65%; 278 μmol·m−2·s−1 |
| 6 | 25 | 80 | 92 | 25 °C; 80%; 92 μmol·m−2·s−1 |
| 7 | 28 | 50 | 92 | 28 °C; 50%; 92 μmol·m−2·s−1 |
| 8 | 28 | 65 | 184 | 28 °C; 65%; 184 μmol·m−2·s−1 |
| 9 | 28 | 80 | 278 | 28 °C; 80%; 278 μmol·m−2·s−1 |
Regression equations of leaf number under various growth environments (temperature; humidity; light intensity)
| Trial factors | Growth regression equation | Trial factors | Growth regression equation |
|---|---|---|---|
| 22 °C; 50%; 278 μmol·m−2·s−1 | N = 0.68*t + 0.17 | 22 °C; 80%; 184 μmol·m−2·s−1 | N = 0.65*t + 0.40 |
| 22 °C; 65%; 92 μmol·m−2·s−1 | N = 0.47*t + 0.22 | 25 °C; 65%; 278 μmol·m−2·s−1 | N = 0.68*t + 0.80 |
| 25 °C; 50%; 184 μmol·m−2·s−1 | N = 0.67*t + 0.99 | 25 °C; 80%; 92 μmol·m−2·s−1 | N = 0.45*t + 0.61 |
| 28 °C; 80%; 278 μmol·m−2·s−1 | N = 0.71*t + 0.74 | 28 °C; 65%; 184 μmol·m−2·s−1 | N = 0.57*t + 0.63 |
| 28 °C; 50%; 92 μmol·m−2·s−1 | N = 0.38*t + 1.53 |
Optimization table for the environmental factors
| Characteristic | Combination of optimal growth conditions |
|---|---|
| Final leaf size | 25 °C, 50% humidity, 184 μmol·m−2·s−1 |
| Leaf number | 22 °C, 50% humidity, 278 μmol·m−2·s−1 |