
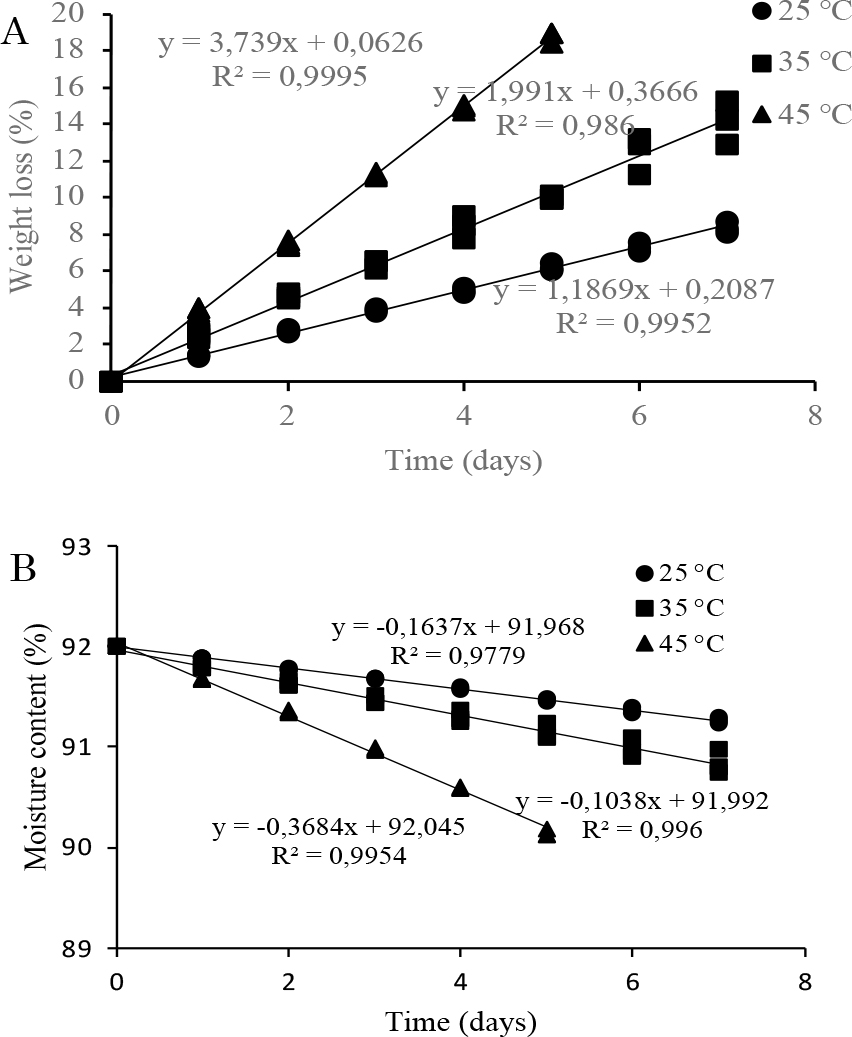
Figure 1
Changes in weight loss of lemons during storage (A) and changes in moisture content (B)
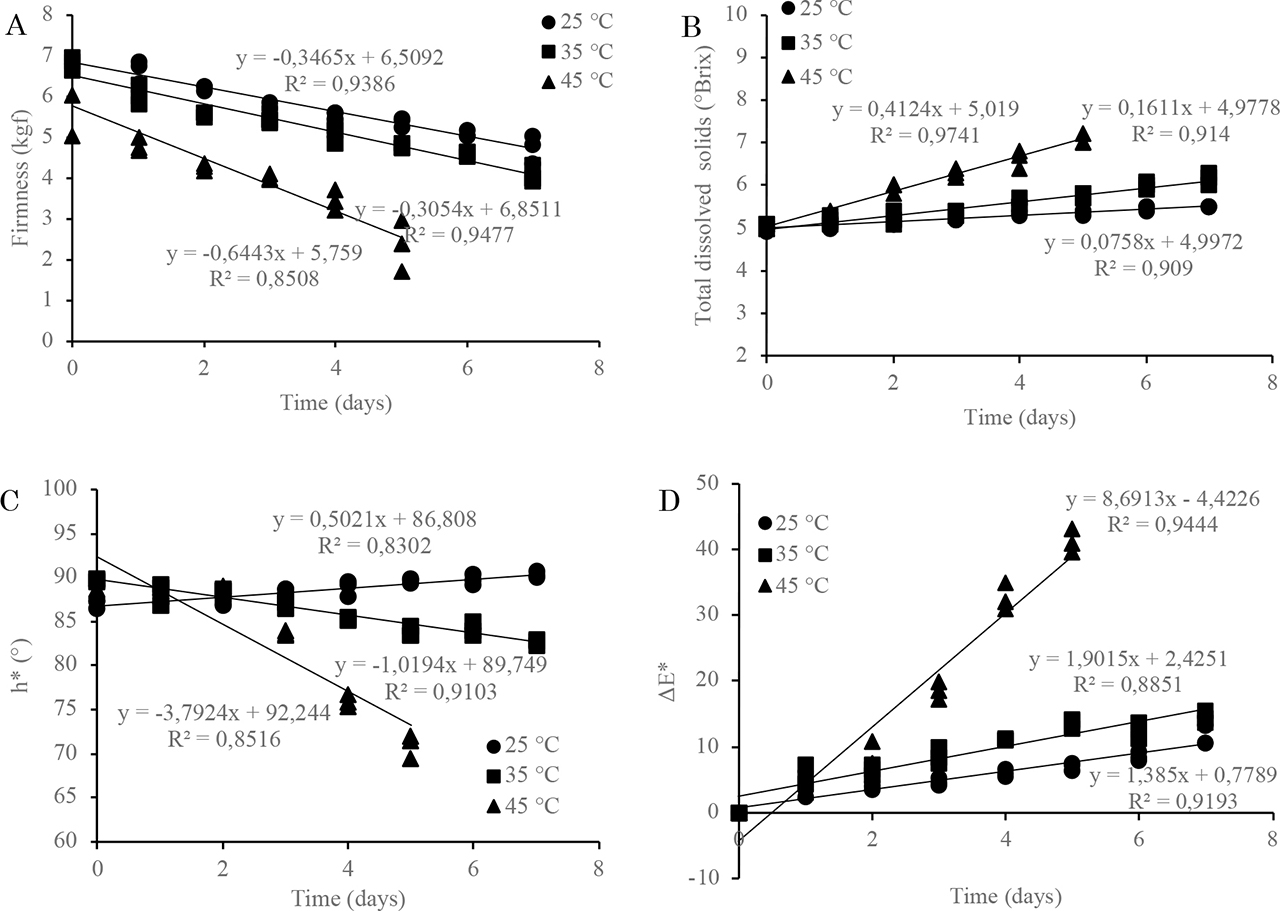
Figure 2
Change in the firmness (A), changes in the total dissolved solid (B), changes in the hue angle (h*) (C), and total change in color difference (∆E*) of lemon samples during storage at temperatures of 25, 35, and 45 °C (D)
Table 1
Average ± standard deviation hedonic score of lemon fruit at storage temperature of 45 °C
| Time (days) | Average score | |||
|---|---|---|---|---|
| Color | Firmness | Texture | Appearance | |
| 0 | 5.0 ± 0.0 | 5.0 ± 0.0 | 5.0 ± 0.0 | 5.0 ± 0.0 |
| 1 | 4.3 ± 0.6 | 4.0 ± 0.9 | 4.2 ± 0.8 | 4.2 ± 0.6 |
| 2 | 3.9 ± 1.1 | 3.3 ± 0.7 | 3.3 ± 1.0 | 3.9 ± 0.9 |
| 3 | 2.9 ± 0.8 | 2.6 ± 0.7 | 2.7 ± 1.0 | 2.8 ± 0.9 |
| 4 | 2.5 ± 1.0 | 1.7 ± 0.4 | 2.4 ± 1.0 | 2.4 ± 1.0 |
| 5 | 1.8 ± 0.4 | 1.0 ± 0.0 | 1.1 ± 0.3 | 1.1 ± 0.3 |
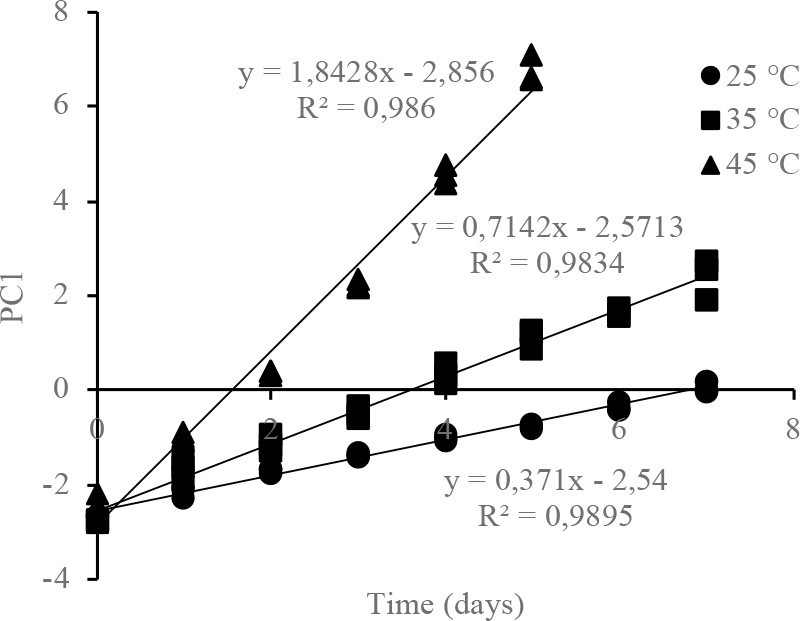
Figure 3
Multivariate kinetics of the PC1 score of lemon samples during storage at temperatures of 25, 35, and 45 °C
Table 2
Parameters of zero-order reaction kinetics of PC1 score as a function of storage of lemons at temperatures of 25, 35, and 45 °C
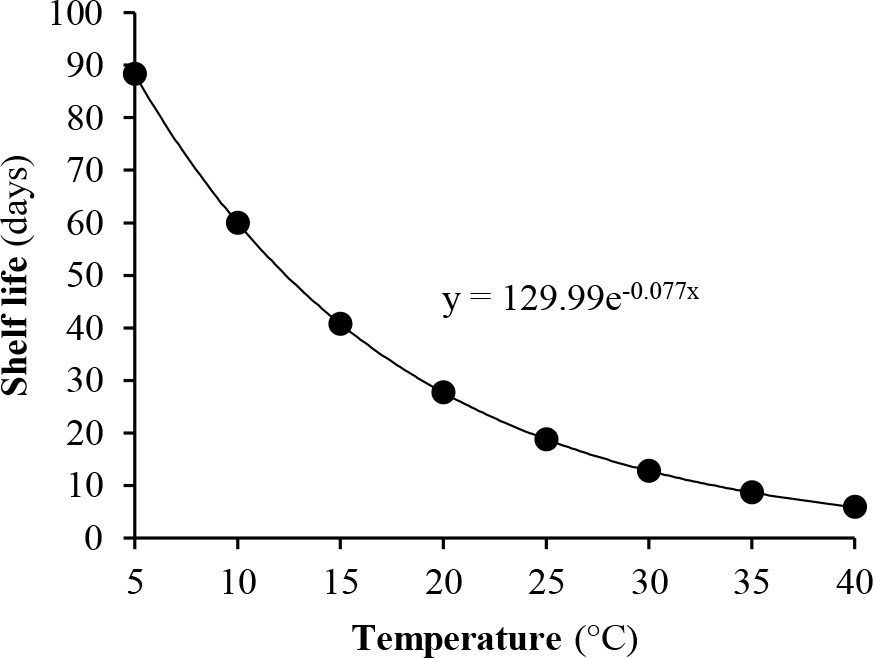
Figure 4
The relationship between storage temperature and shelf life of lemons (y = 129.99e−0.077x)