
Table 1
Different PGR treatments used for callus induction from leaf segments of carnation
| PGRs (mg·dm−3) | Treatment number | |||||||||||||||
|---|---|---|---|---|---|---|---|---|---|---|---|---|---|---|---|---|
| 1 | 2 | 3 | 4 | 5 | 6 | 7 | 8 | 9 | 10 | 11 | 12 | 13 | 14 | 15 | 16 | |
| 2,4-D | 0.5 | 0.5 | 0.5 | 0.5 | 0.2 | 0.2 | 1 | 1 | 0.5 | 0.5 | 0.5 | 0.5 | 0.5 | 0.5 | 0.2 | 0.2 |
| BA | 0.2 | 0.2 | 0.5 | 0.5 | 0.2 | 0.2 | 0.2 | 0.2 | 0.2 | 0.2 | 0.5 | 0.5 | 0 | 0 | 0 | 0 |
| NAA | 0.5 | 0.5 | 0.5 | 0.5 | 0.5 | 0.5 | 0.5 | 0.5 | 0 | 0 | 0 | 0 | 0 | 0 | 0 | 0 |
| CH | 0 | 200 | 0 | 200 | 0 | 200 | 0 | 200 | 0 | 200 | 0 | 200 | 0 | 200 | 0 | 200 |
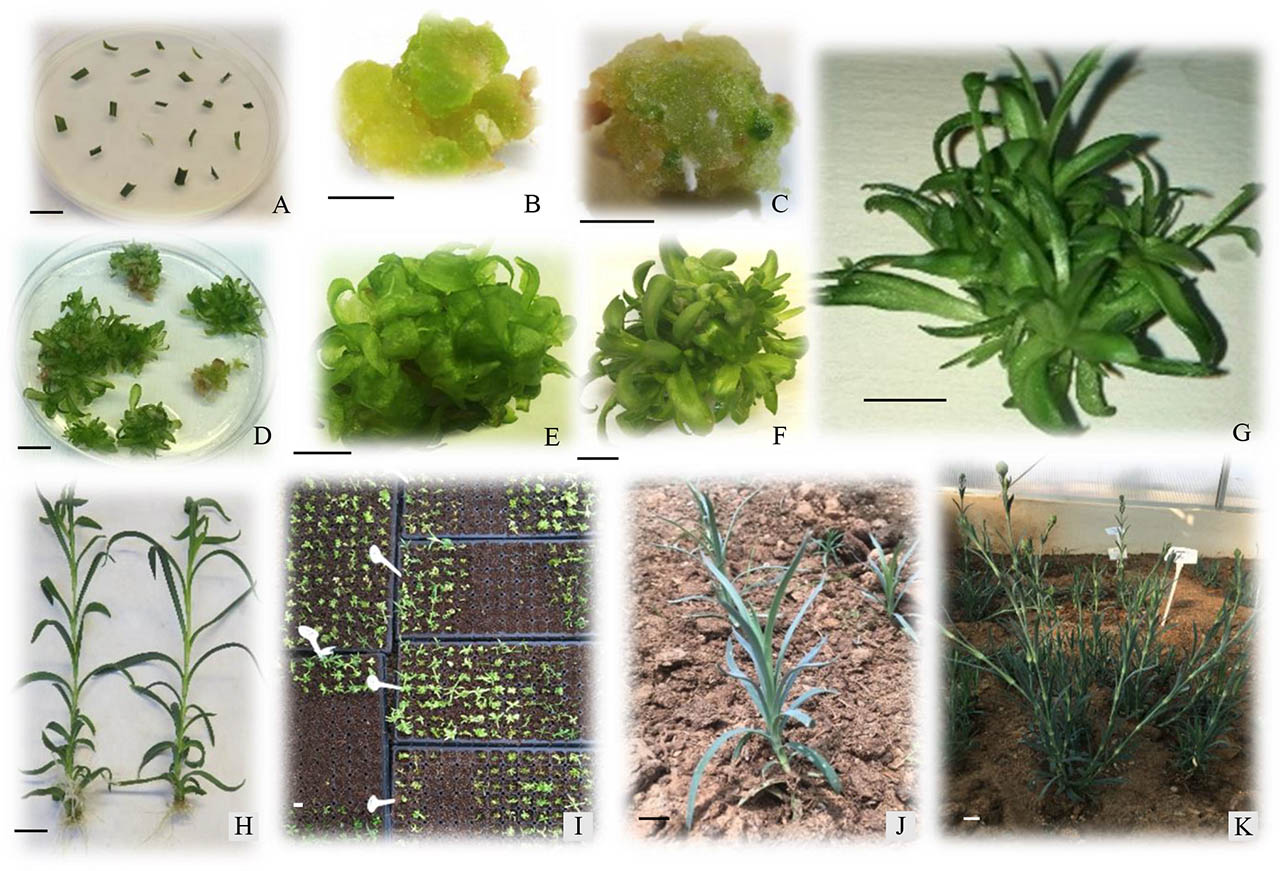
Figure 1
Different stages of organogenesis from leaf explants in carnation cultivars: A, B – explant type and callus induction after 21 days; C – green spots on the surface of the callus 25 days after sub-culture on the regeneration medium; D – efficient shoot induction on the MS medium supplemented with 3 mg·dm−3 of BA, 0.6 mg·dm−3 of NAA, 5 mg·dm−3 of AgNO3, and 40 mg·dm−3 of As two months after incubation; E – hyperhydric shoots regenerated in most explants; F – recovery from hyperhydricity on the modified MS (0.275 mg·dm−3 of NH4NO3) containing 0.5 mg·dm−3 of GA3, 0.3 mg·dm−3 of BA, and 0.1 mg·dm−3 of NAA after 2–3 weeks; G – shoot elongation on the MS medium with 1 mg·dm−3 of KIN and 0.1 mg·dm−3 of NAA; H – rooting on the ½ MS macro- and full micronutrients and 1.5 mg·dm−3 of IBA; I – the acclimatization of plantlets in the greenhouse with controlled climate system and high relative humidity; J, K – acclimatized plantlets transferred to the soil in the greenhouse (scale bars = 1 cm)
Table 2
Callus induction response to treatments among different carnation cultivars based on Duncan’s multiple range grouping
| Callus induction in different carnation cultivars | |||||||||||
|---|---|---|---|---|---|---|---|---|---|---|---|
| Dependent variable | Visual score | SS | ‘Mariposa’ | ‘Eskimo’ | ‘Cameron’ | ‘Tabasco’ | ‘Tabor’ | ‘Noblesse’ | ‘Liberty’ | ‘White Liberty’ | ‘Grand Slam’ |
| CF 0–100% | excellent | ≥ 86 | 91.67% | 90.33% | |||||||
| good | 51–85 | 72.33 | 62.25% | ||||||||
| medium | 25–50 | 38.92% | 37.72% | ||||||||
| weak | ≤ 25 | 18.67% | 22.73% | 19.67% | |||||||
| DCI 2–30 day | excellent | ≤ 9 | 6 | 5 | |||||||
| good | 10–19 | 14 | 14 | ||||||||
| medium | 20–29 | 25 | 21 | 21 | 21 | ||||||
| weak | ≥ 30 | 33 | |||||||||
| CGR score 1–5 | excellent | 5 | 5 | 5 | |||||||
| good | 4 | 4 | 4 | ||||||||
| medium | 3 | 3 | 3 | 3 | |||||||
| weak | ≤ 2 | 2 | 1 | ||||||||
| CC score 1–5 | green | 5 | 5 | 5 | 5 | 5 | 5 | 5 | |||
| green - yellow | 4 | 4 | 4 | 4 | 4 | 4 | |||||
| white | 3 | 3 | 3 | ||||||||
| brown | ≤ 2 | 1 | |||||||||
[i] CF – callus frequency, DCI – days to callus induction (showing the number of days required for visible callus induction), CGR – callus growth rate scored from 1 for lowest to 5 for highest, CC – callus color scored from 1 for brown to 5 for green, SS – statistical score
Table 3
Effects of different PGR treatments on regeneration frequency for plant regeneration in different carnation cultivars
| Regeneration frequency (%) for carnation cultivars | |||||||||||||
|---|---|---|---|---|---|---|---|---|---|---|---|---|---|
| PGR (mg·dm−3) | ‘Mariposa’ | ‘Eskimo’ | ‘Cameron’ | ‘Tabasco’ | ‘Tabor’ | ‘Noblesse’ | ‘Liberty’ | ‘White Liberty’ | ‘Grand Slam’ | Mean for all cultivars | |||
| BA | NAA | As | AgNO3 | ||||||||||
| 3 | 0.2 | 0 | 0 | 4.76±0.74d | 23.81±0.74e | 23.81±0.74e | 28.57±1.3e | 19.05±0.74d | 23.81±0.74d | 19.05±0.74d | 23.81±0.74e | 4.76±0.74d | 19.05±0.95f |
| 3 | 0.6 | 0 | 0 | 19.05±0.74b | 66.67±0.74b | 71.43±1.3b | 66.67±0.74b | 66.67±0.74b | 42.86±2.24c | 66.67±0.74b | 66.67±0.74b | 19.05±0.74b | 53.96±2.38b |
| 2 | 0.2 | 0 | 0 | 4.76±0.74d | 14.29±1.3g | 4.76±0.74h | 14.29±0.14f | 9.53±0.74e | 14.29±1.3e | 9.53±0.74e | 4.76±0.74h | 9.53±0.74c | 9.53±0.46h |
| 2 | 0.6 | 0 | 0 | 0e | 38.1±0.74d | 9.53±1.5f | 38.1±0.74d | 0f | 23.81±1.98d | 0f | 9.53±1.5g | 0e | 13.23±1.79g |
| 2 | 0.2 | 20 | 5 | 9.53±1.4c | 38.1±0.74d | 33.34±0.74d | 38.1±0.74d | 9.53±1.44e | 33.34±0.74c | 9.53±1.5e | 23.81±1.98e | 23.81±1.98b | 24.34±1.36e |
| 3 | 0.2 | 20 | 5 | 9.53±0.74c | 33.34±1.5d | 76.19±0.74b | 38.1±1.98d | 33.34±1.5c | 80.95±0.74b | 76.19±0.74b | 38.1±1.98d | 23.81±1.5b | 45.51±2.86b |
| 2 | 0.6 | 40 | 5 | 4.76±0.74d | 57.14±1.27c | 61.91±1.5c | 61.91±1.5c | 42.86±0.79c | 61.91±1.5c | 33.34±1.5c | 42.86±1.3c | 9.53±0.74d | 41.80±2.46c |
| 3 | 0.6 | 40 | 5 | 38.1±0.74a | 90.47±0.74a | 95.24±0.74a | 95.24±0.74a | 80.95±0.74a | 95.24±0.74a | 90.47±0.74a | 90.47±0.74a | 33.34±0.74a | 78.83±2.76a |
| 5 | 0.6 | 40 | 5 | 4.76±0.74d | 23.81±0.74e | 66.67±0.74c | 61.91±0.74c | 28.57±2.24d | 14.29±1.3e | 28.57±2.24d | 19.05±1.98f | 9.53±0.74c | 28.57±2.42d |
| 3 | 0.6 | 80 | 5 | 0e | 19.05±0.74f | 19.05±0.74e | 19.05±0.74f | 33.34±1.5c | 0f | 28.57±1.3d | 19.05±0.74f | 4.76±0.74d | 15.87±1.32g |
[i] Different letters in a column indicate significant differences according to Duncan’s multiple range test (p < 0.05); values represent mean ± SE
Table 4
Effects of different treatments on shoot number per explant for plant regeneration in different carnation cultivars
| Shoot number per explant for carnation cultivars | |||||||||||||
|---|---|---|---|---|---|---|---|---|---|---|---|---|---|
| PGR (mg·dm−3) | Mariposa’ | ‘Eskimo’ | ‘Cameron’ | ‘Tabasco’ | ‘Tabor’ | ‘Noblesse’ | ‘Liberty’ | ‘White Liberty’ | ‘Grand Slam’ | Mean for all cultivars | |||
| BA | NAA | As | AgNO3 | ||||||||||
| 3 | 0.2 | 0 | 0 | 0.43±0.07c | 1.81±0.08d | 3.85±0.2f | 1.81±0.78f | 2.81±0.12e | 1.81±0.08d | 2.24±0.7c | 1.81±0.077c | 0.43±0.07d | 1.89±0.12e |
| 3 | 0.6 | 0 | 0 | 1±0.02a | 1.15±0.022c | 8.53±0.12e | 8.5±0.11d | 7.76±0.12d | 1.91±0.13e | 1.91±0.13d | 5.86±0.18b | 1±0.02c | 4.18±0.38d |
| 2 | 0.2 | 0 | 0 | 0.29±0.05d | 0.67±0.055e | 0.29±0.044g | 1.05±0.1g | 1.05±.1f | 0.76±0.06e | 0.67±0.5e | 0.29±0.04d | 0.57±0.04d | 0.63±0.03f |
| 2 | 0.6 | 0 | 0 | 0e | 1.81±0.077d | 3.71±0.59g | 4.76±0.56g | 0g | 1.81±0.08d | 0f | 1.05±0.1c | 0 e | 1.46±0.20e |
| 2 | 0.2 | 20 | 5 | 0.76±0.12c | 2.29±0.0c | 20.67±0.91d | 3.14±0.066f | 0.76±0.12f | 5±0.33c | 0.76±0.12e | 1.53±0.12c | 1.95±0.17c | 4.22±0.85d |
| 3 | 0.2 | 20 | 5 | 0.76±0.06b | 7.09±017b | 28.3±0.29a | 21.24±1.29c | 21.24±1.29c | 6.47±0.21b | 7.81±0.21b | 7.09±0.18b | 2.28±0.22b | 11.36±1.08b |
| 2 | 0.6 | 40 | 5 | 2.71±0.34a | 5.76±0.37c | 24.19±0.38b | 27.81±0.66a | 24.19±0.38a | 5.76±0.38c | 11.57±0.31b | 21.81±0.38a | 2.71±0.34a | 14.06±1.15b |
| 3 | 0.6 | 40 | 5 | 1±0.033a | 22.33±0.11a | 23.76±0.17b | 22±0.1b | 24.14±0.12a | 19±0.36a | 20.19±0.11a | 22.33±0.38a | 0.67±0.22b | 17.27±1.05a |
| 5 | 0.6 | 40 | 5 | 0.19±0.033d | 6.4±0.1b | 7.81±0.21e | 16.19±0.51c | 4.76±0.41e | 2.9±0.36c | 5±0.55d | 4.76±0.41c | 0.62±0.06c | 5.4±0.53c |
| 3 | 0.6 | 80 | 5 | 0e | 0.76±0.033e | 1.05±0.01g | 5.09±0.01e | 1.57±0.04e | 0 f | 2.38±0.01c | 1.28±0.011c | 0.38±0.06c | 1.39±0.18e |
[i] Note: See Table 1
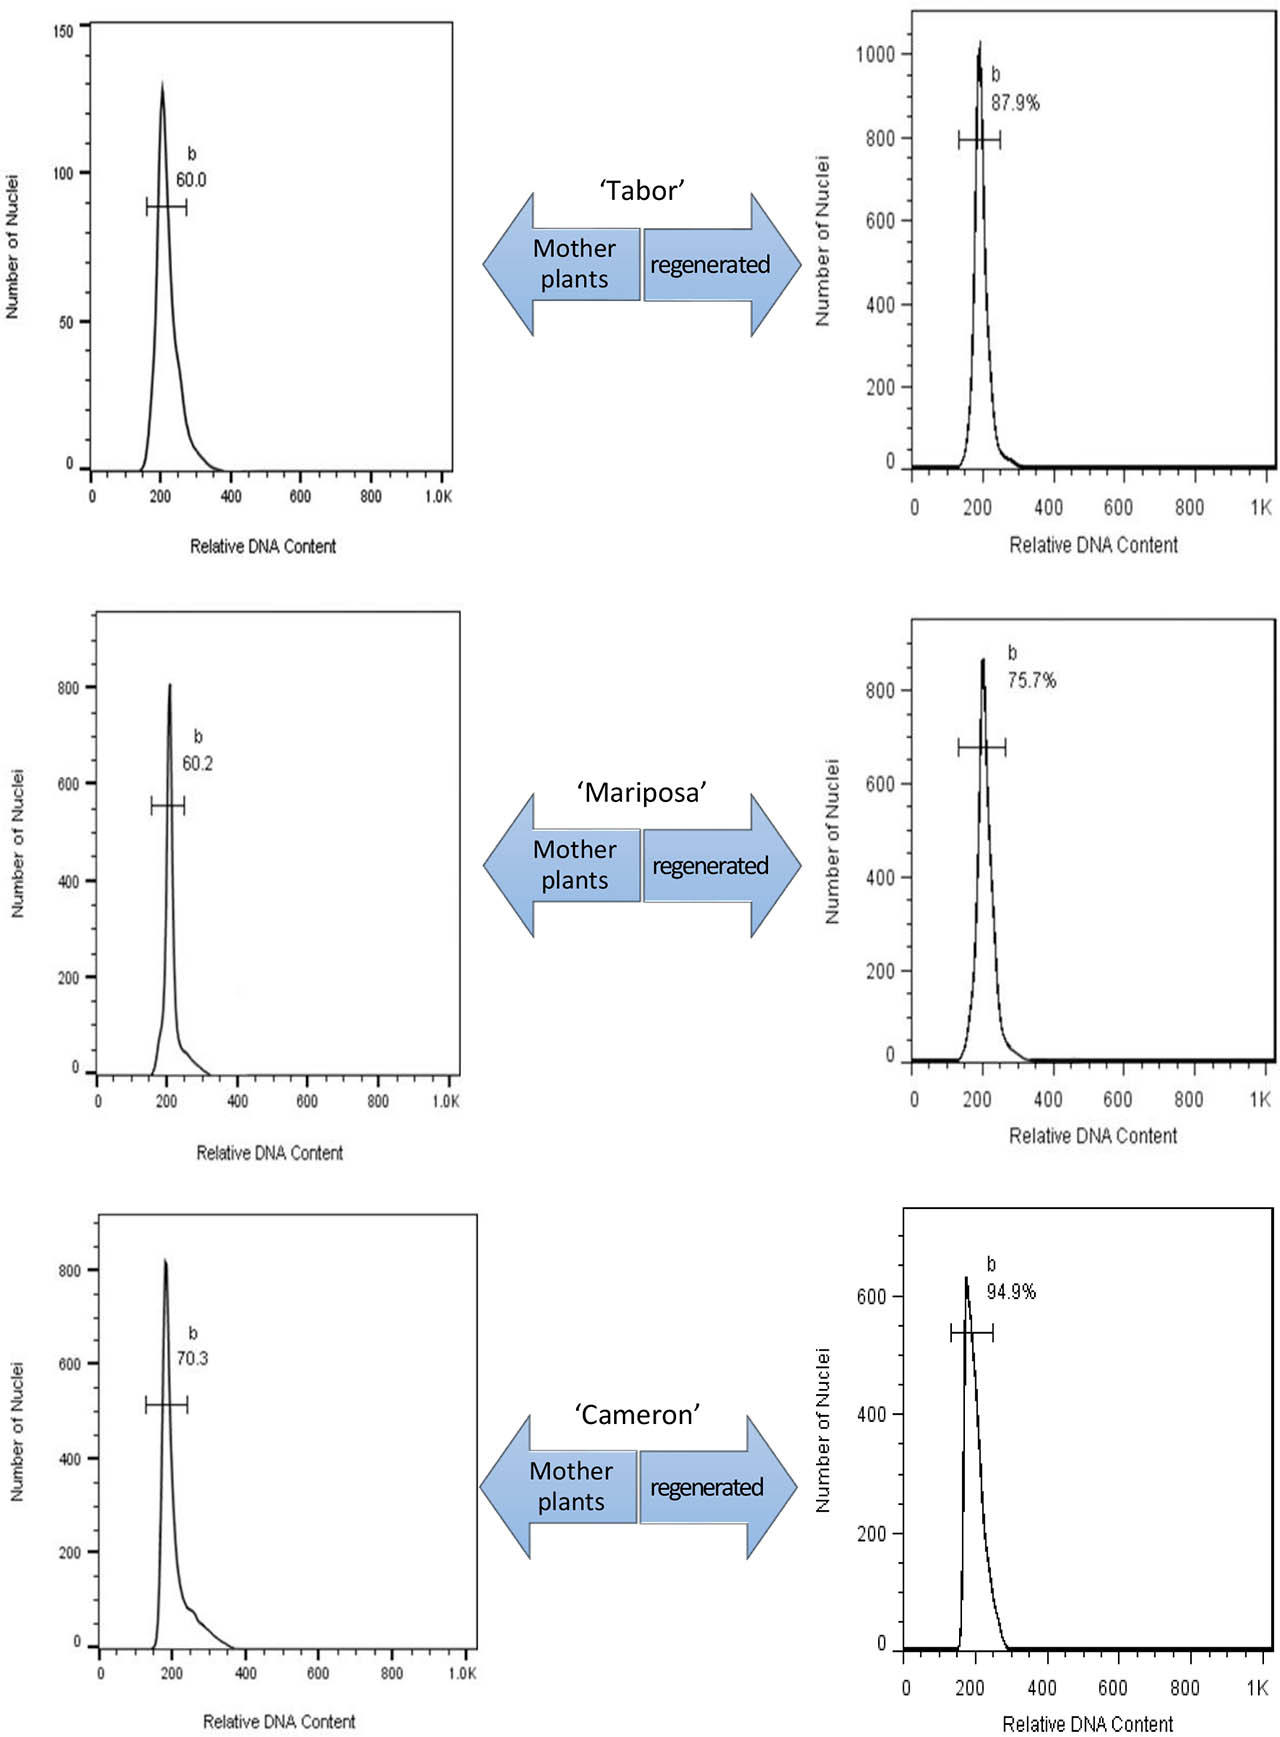
Figure 2
Ploidy level of the regenerated (right) and mother plants (left) of carnation cultivars through flow cytometry analysis. DNA content histogram in ‘Tabor’, ‘Mariposa’, and ‘Cameron’ cultivars showed no significant differences. The nuclei were isolated from the leaves of the mother and regenerated plants