
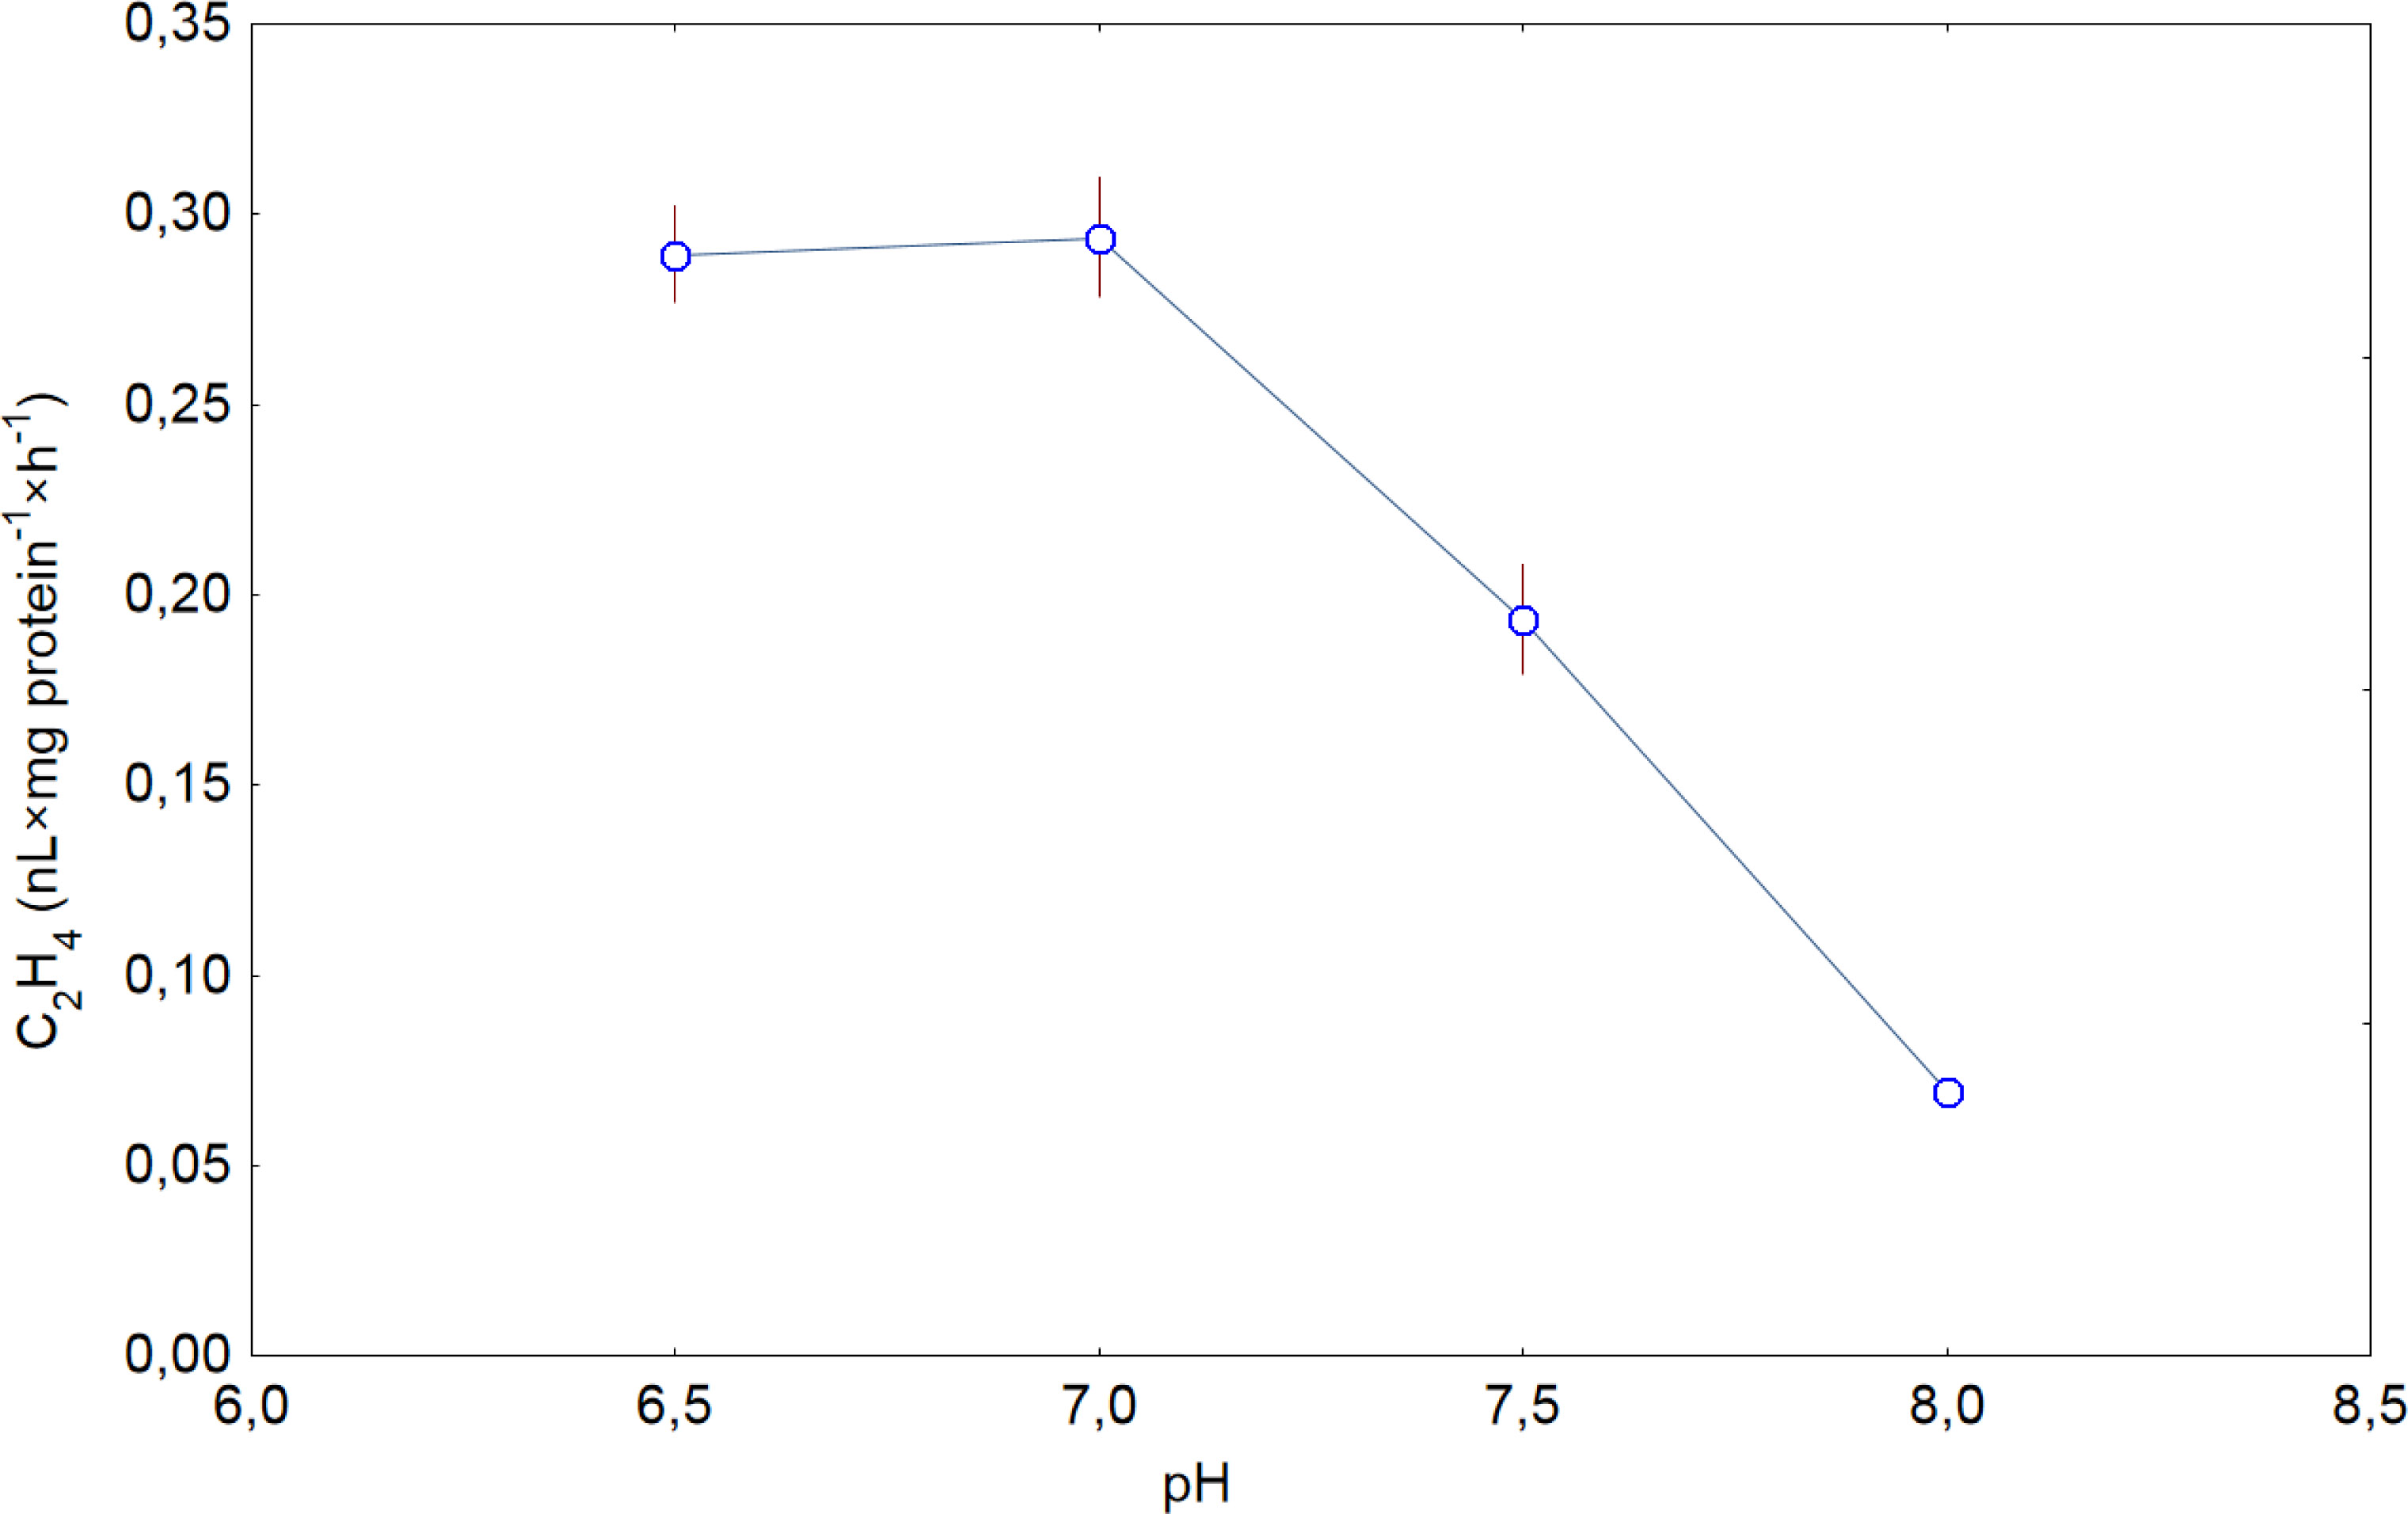
Figure 1
Effect of pH on in vitro ACC oxidase activity from Callistephus chinensis seeds germinated for 24 h; vertical bars denote ±SE
Table 1
Effect of PVPP and NaHCO3 on in vitro activity of ACC oxidase from Callistephus chinensis seeds germinated for 48 h. Means followed with the same letter are not significantly different at p = 0.05 according to Duncan's test; mean ± SE
| PVPP | NaHCO3 | Ethylene (nL·mg protein−1·h−1) | Increment (%) |
|---|---|---|---|
| 5% | - | 1.086 a ± 0.042 | - |
| 5% | 25 mM | 1.158 a ± 0.154 | 6.6 |
| 10% | - | 1.246 a ± 0.073 | 16.4 |
| 10% | 25 mM | 1.925 b ± 0.217 | 77.0 |
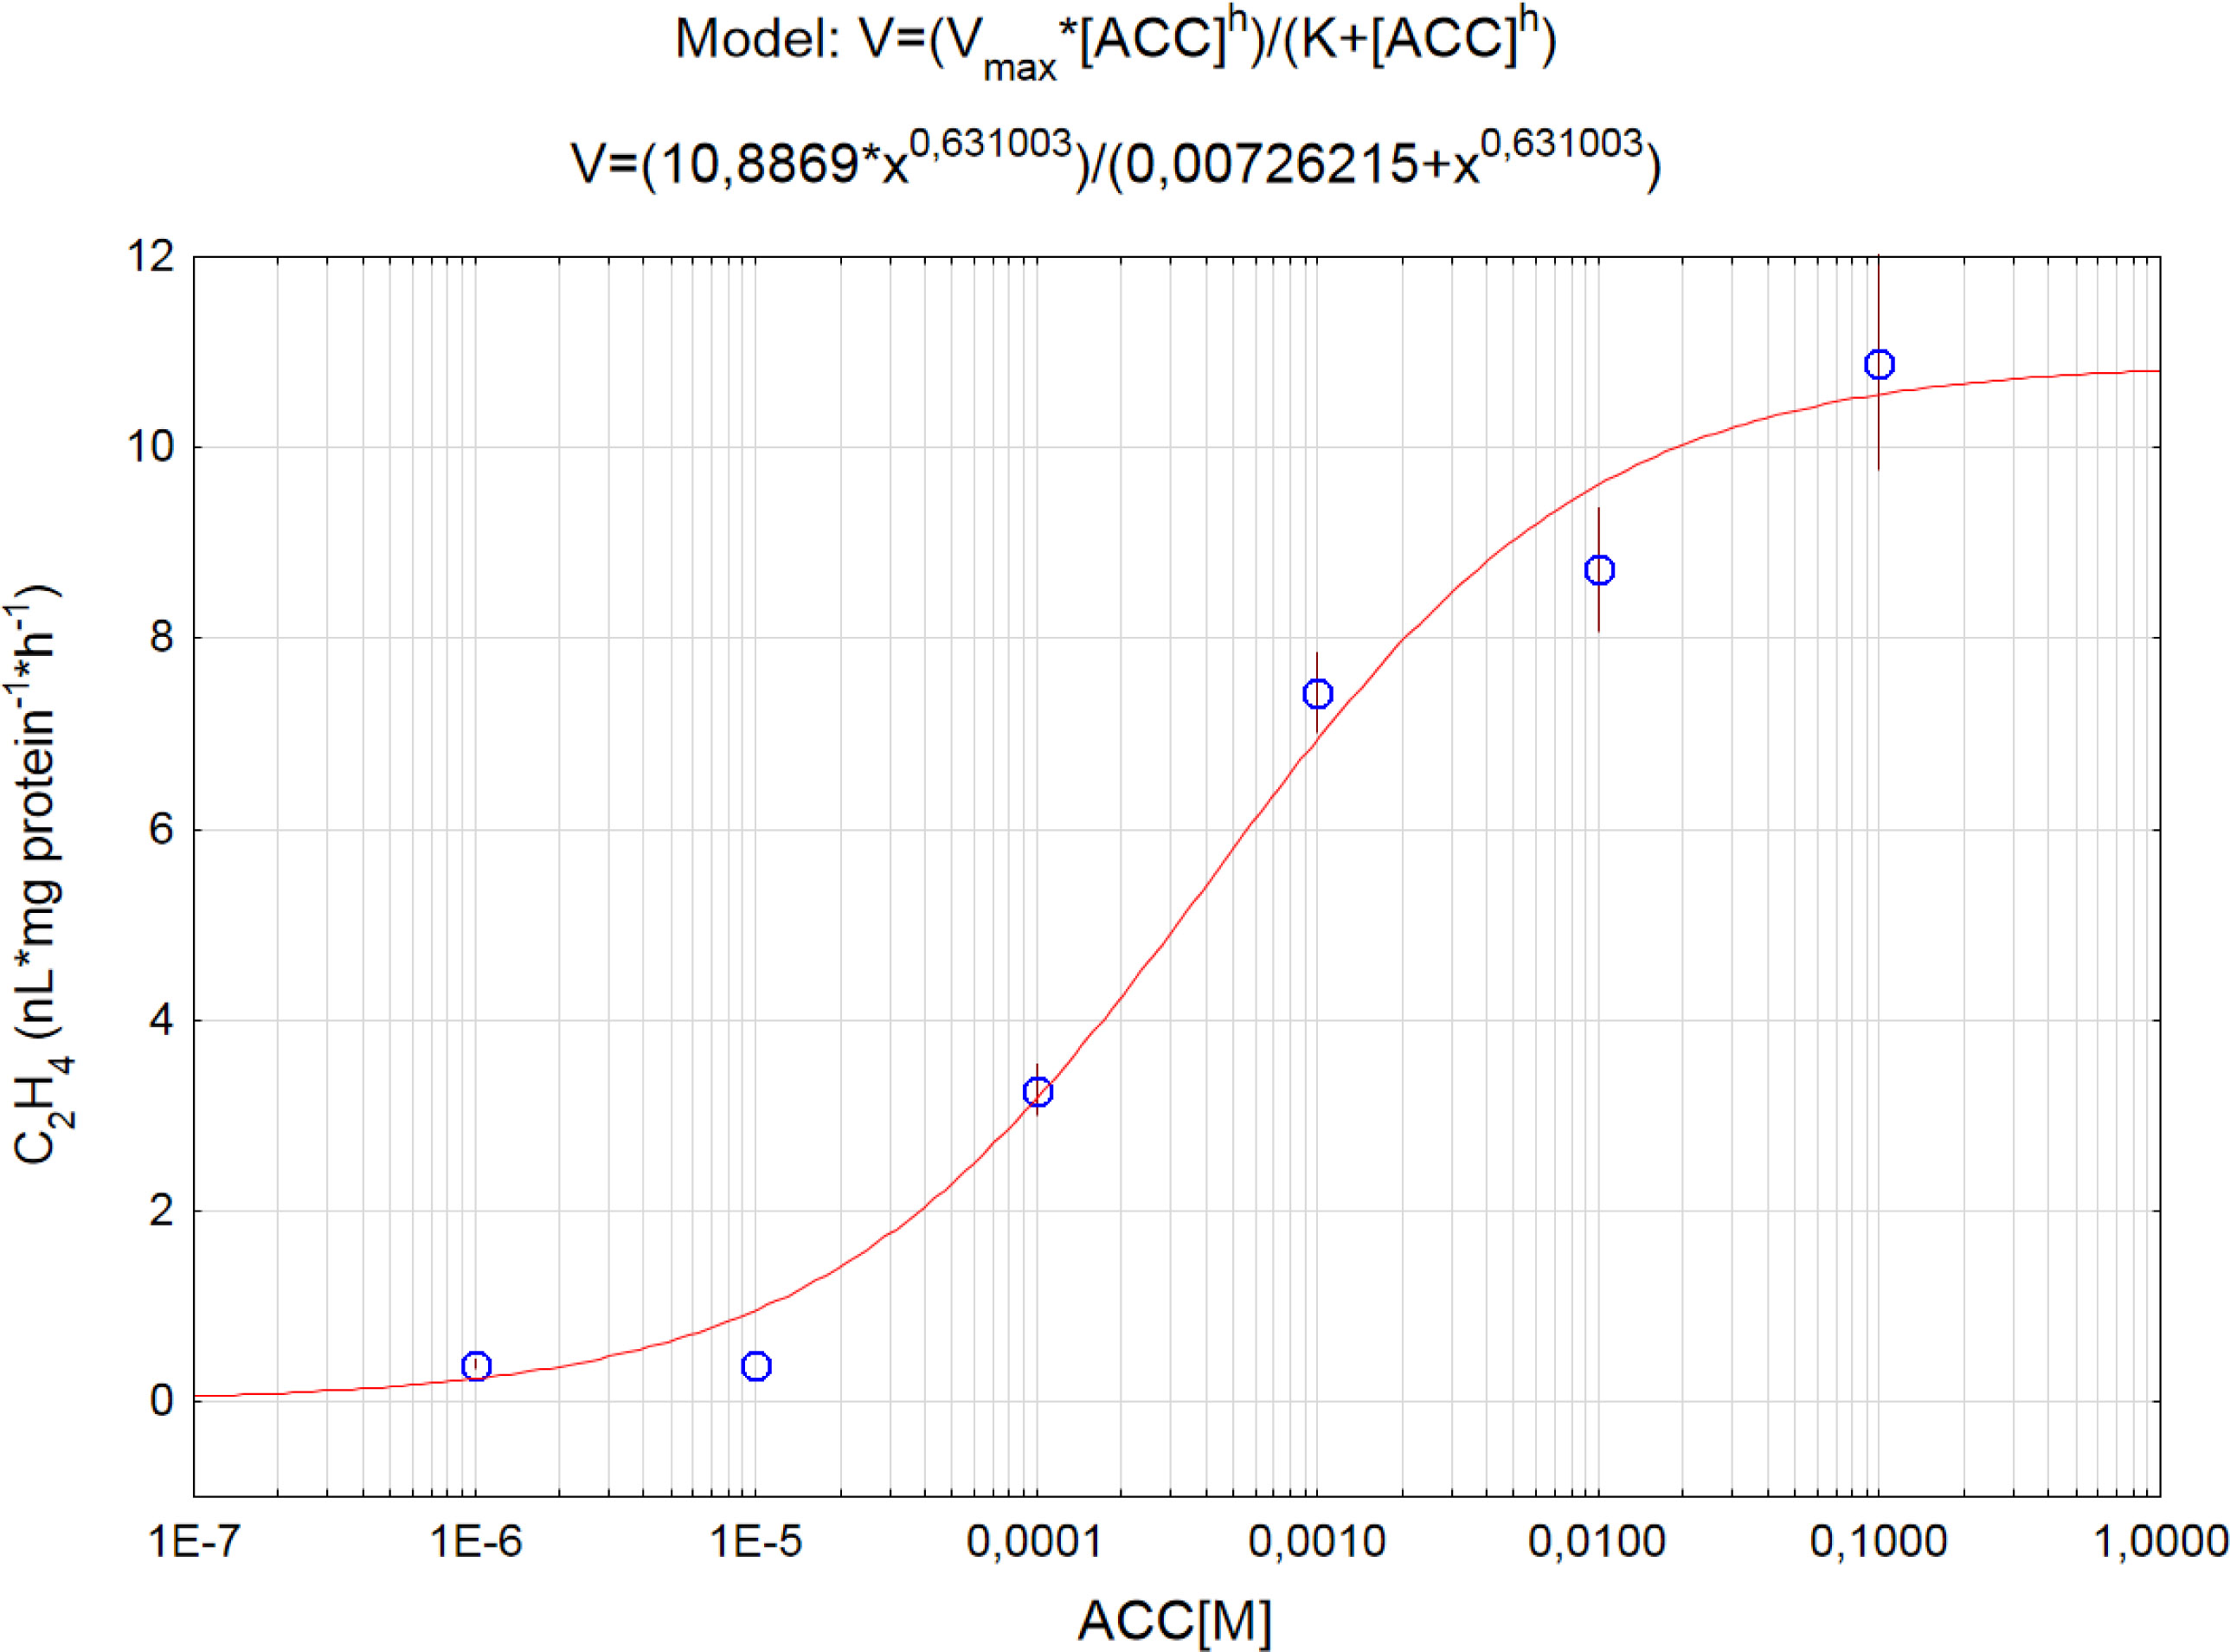
Figure 2
Effect of ACC concentration on in vivo ACC oxidase activity at 25 °C in Callistephus chinensis seeds germinated for 48 h; vertical bars denote ±SE
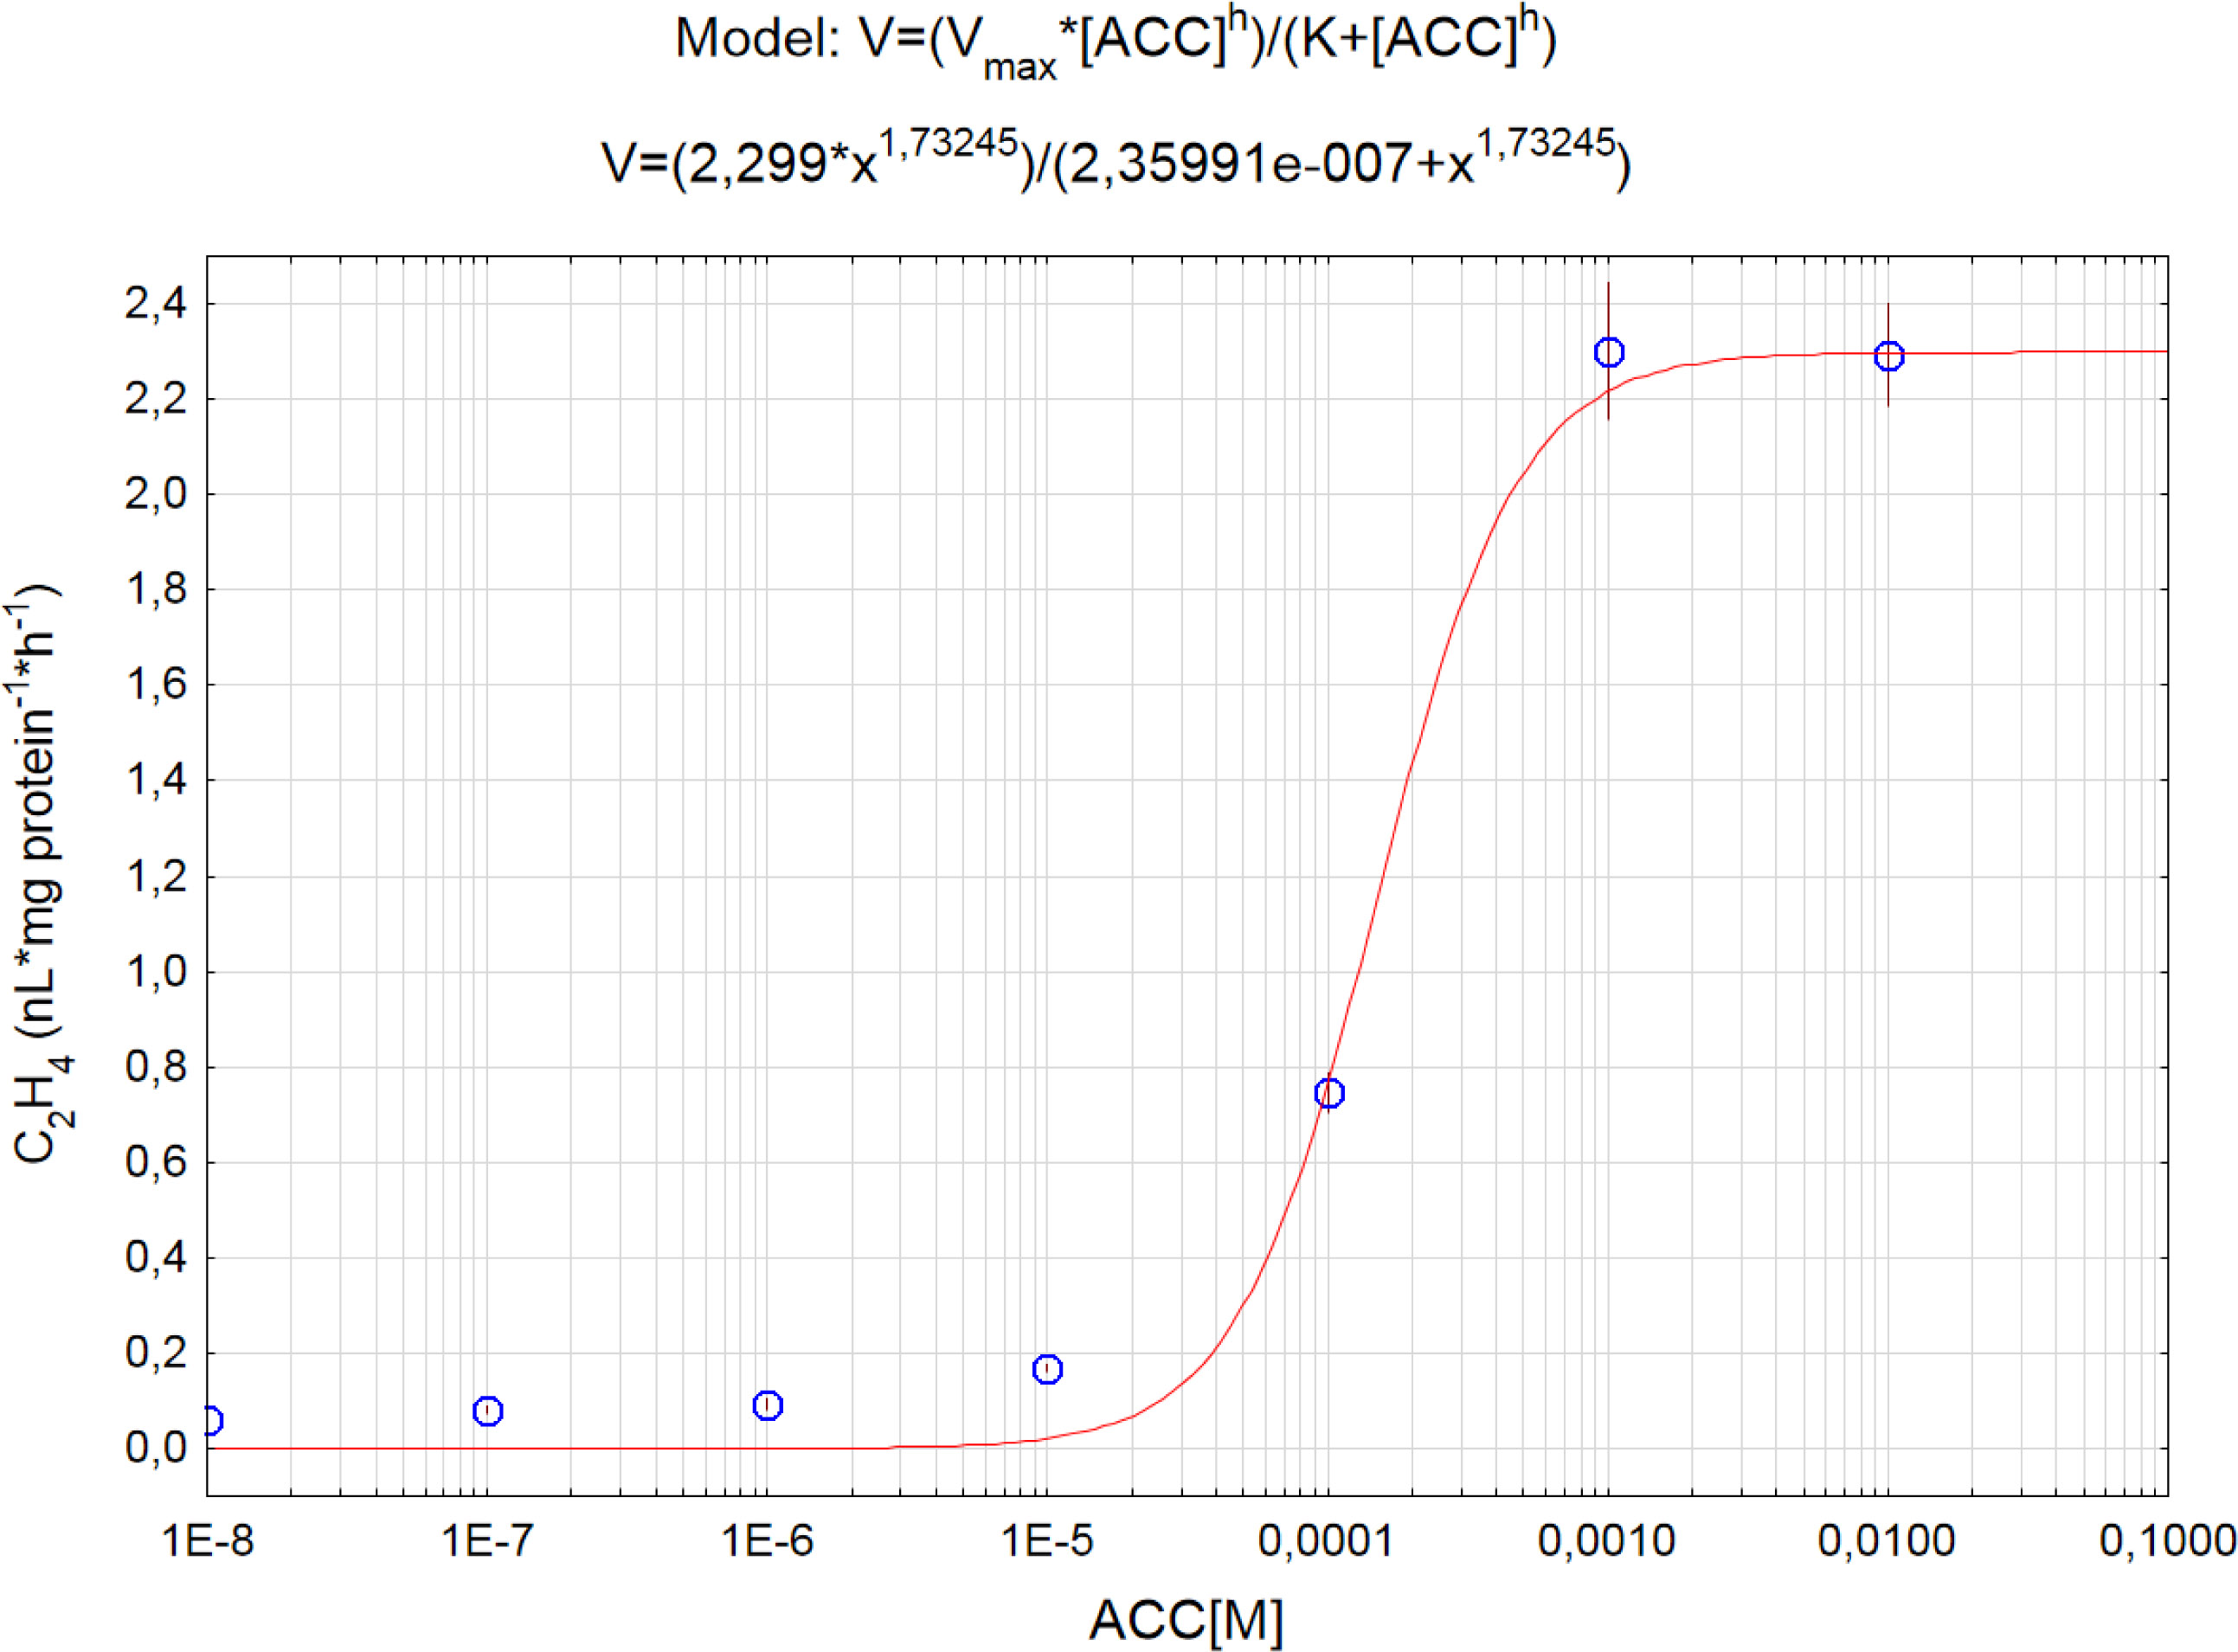
Figure 3
Effect of ACC concentration on in vitro ACC oxidase activity at 25 °C in Callistephus chinensis seeds germinated for 48 h; vertical bars denote ±SE
Table 2
Apparent Vmax, Km and Hill coefficient h of ACC oxidase from Callistephus chinensis seeds analyzed in vivo and in vitro at 25 °C
| ACC oxidase activity | Vmax (nL C2H4·mg protein−1·h−1) ± SE | Km for ACC (μM) ± SE | Hill coefficient h ± SE |
|---|---|---|---|
| In vivo | 10.89 ± 1.13 | 368 ± 92 | 0.63 ± 0.097 |
| In vitro | 2.299 ± 0.14 | 154 ± 20 | 1.73 ± 0.39 |
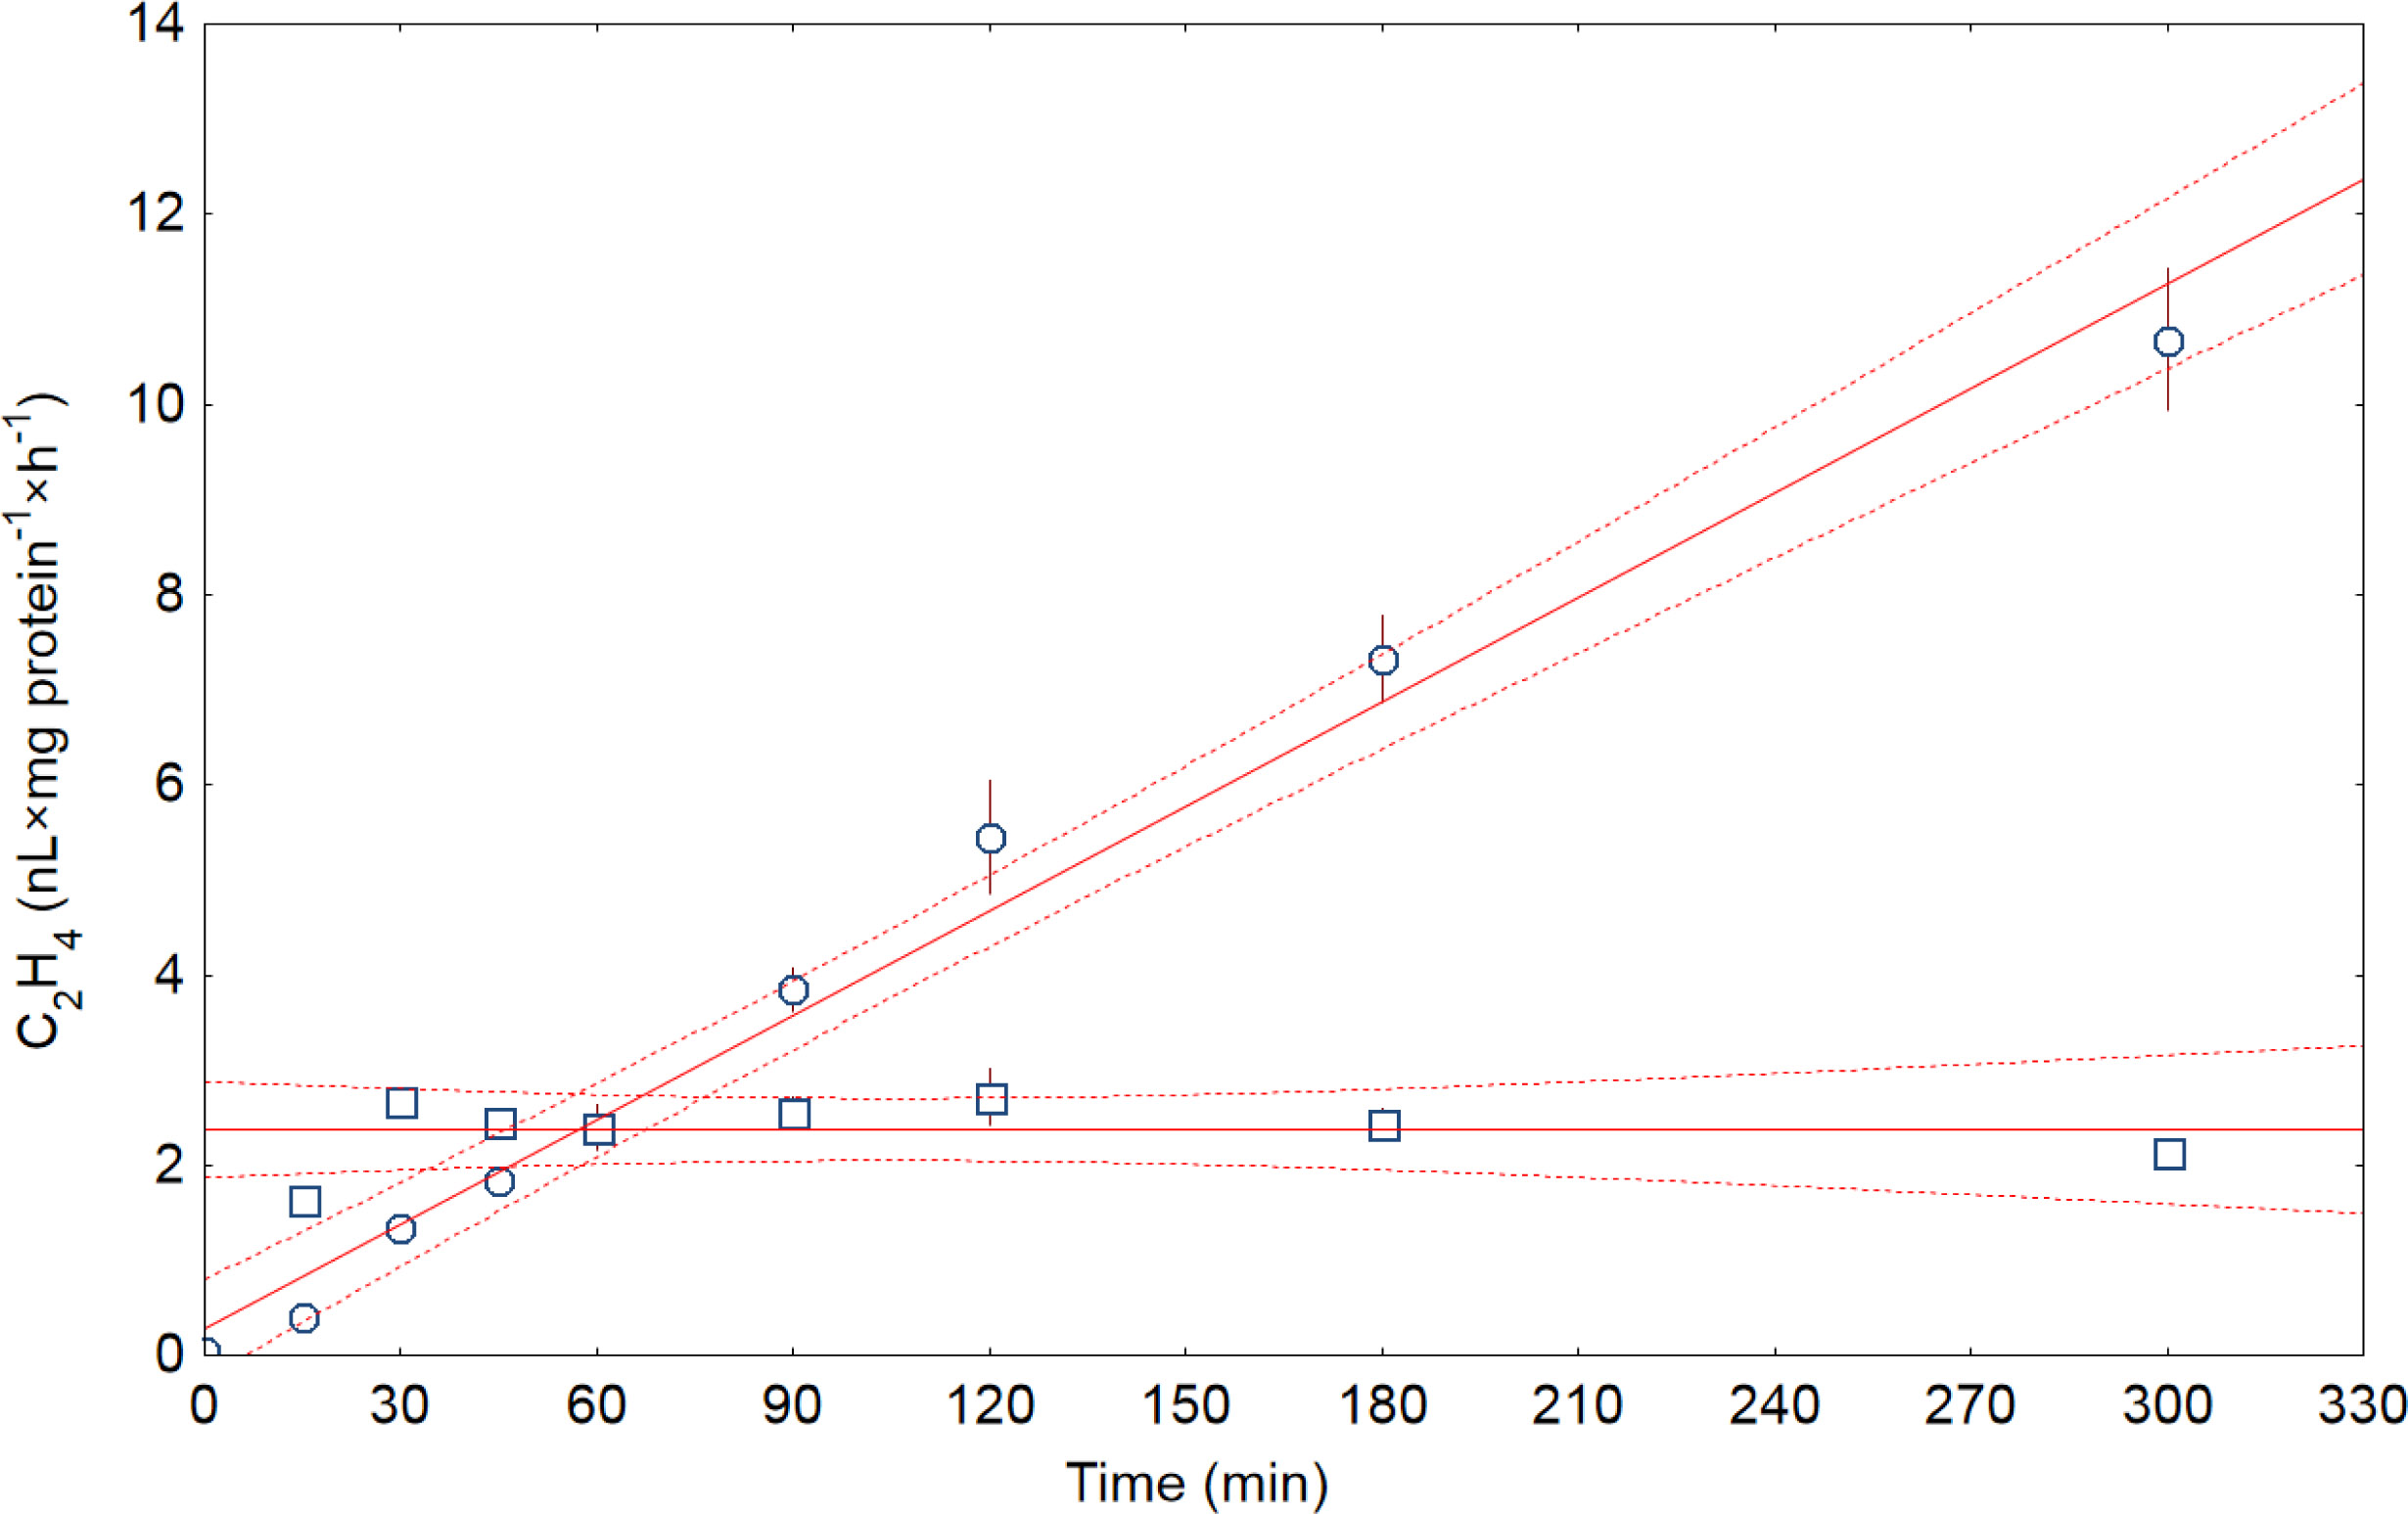
Figure 4
Time-course (total ethylene accumulation) (○) and velocity (amount of ethylene formed per hour) (□) of activity in vitro ACC oxidase from Callistephus chinensis seeds germinated for 48 h; vertical bars denote ±SE; dashed lines are 95% confidence intervals for linear data fitting
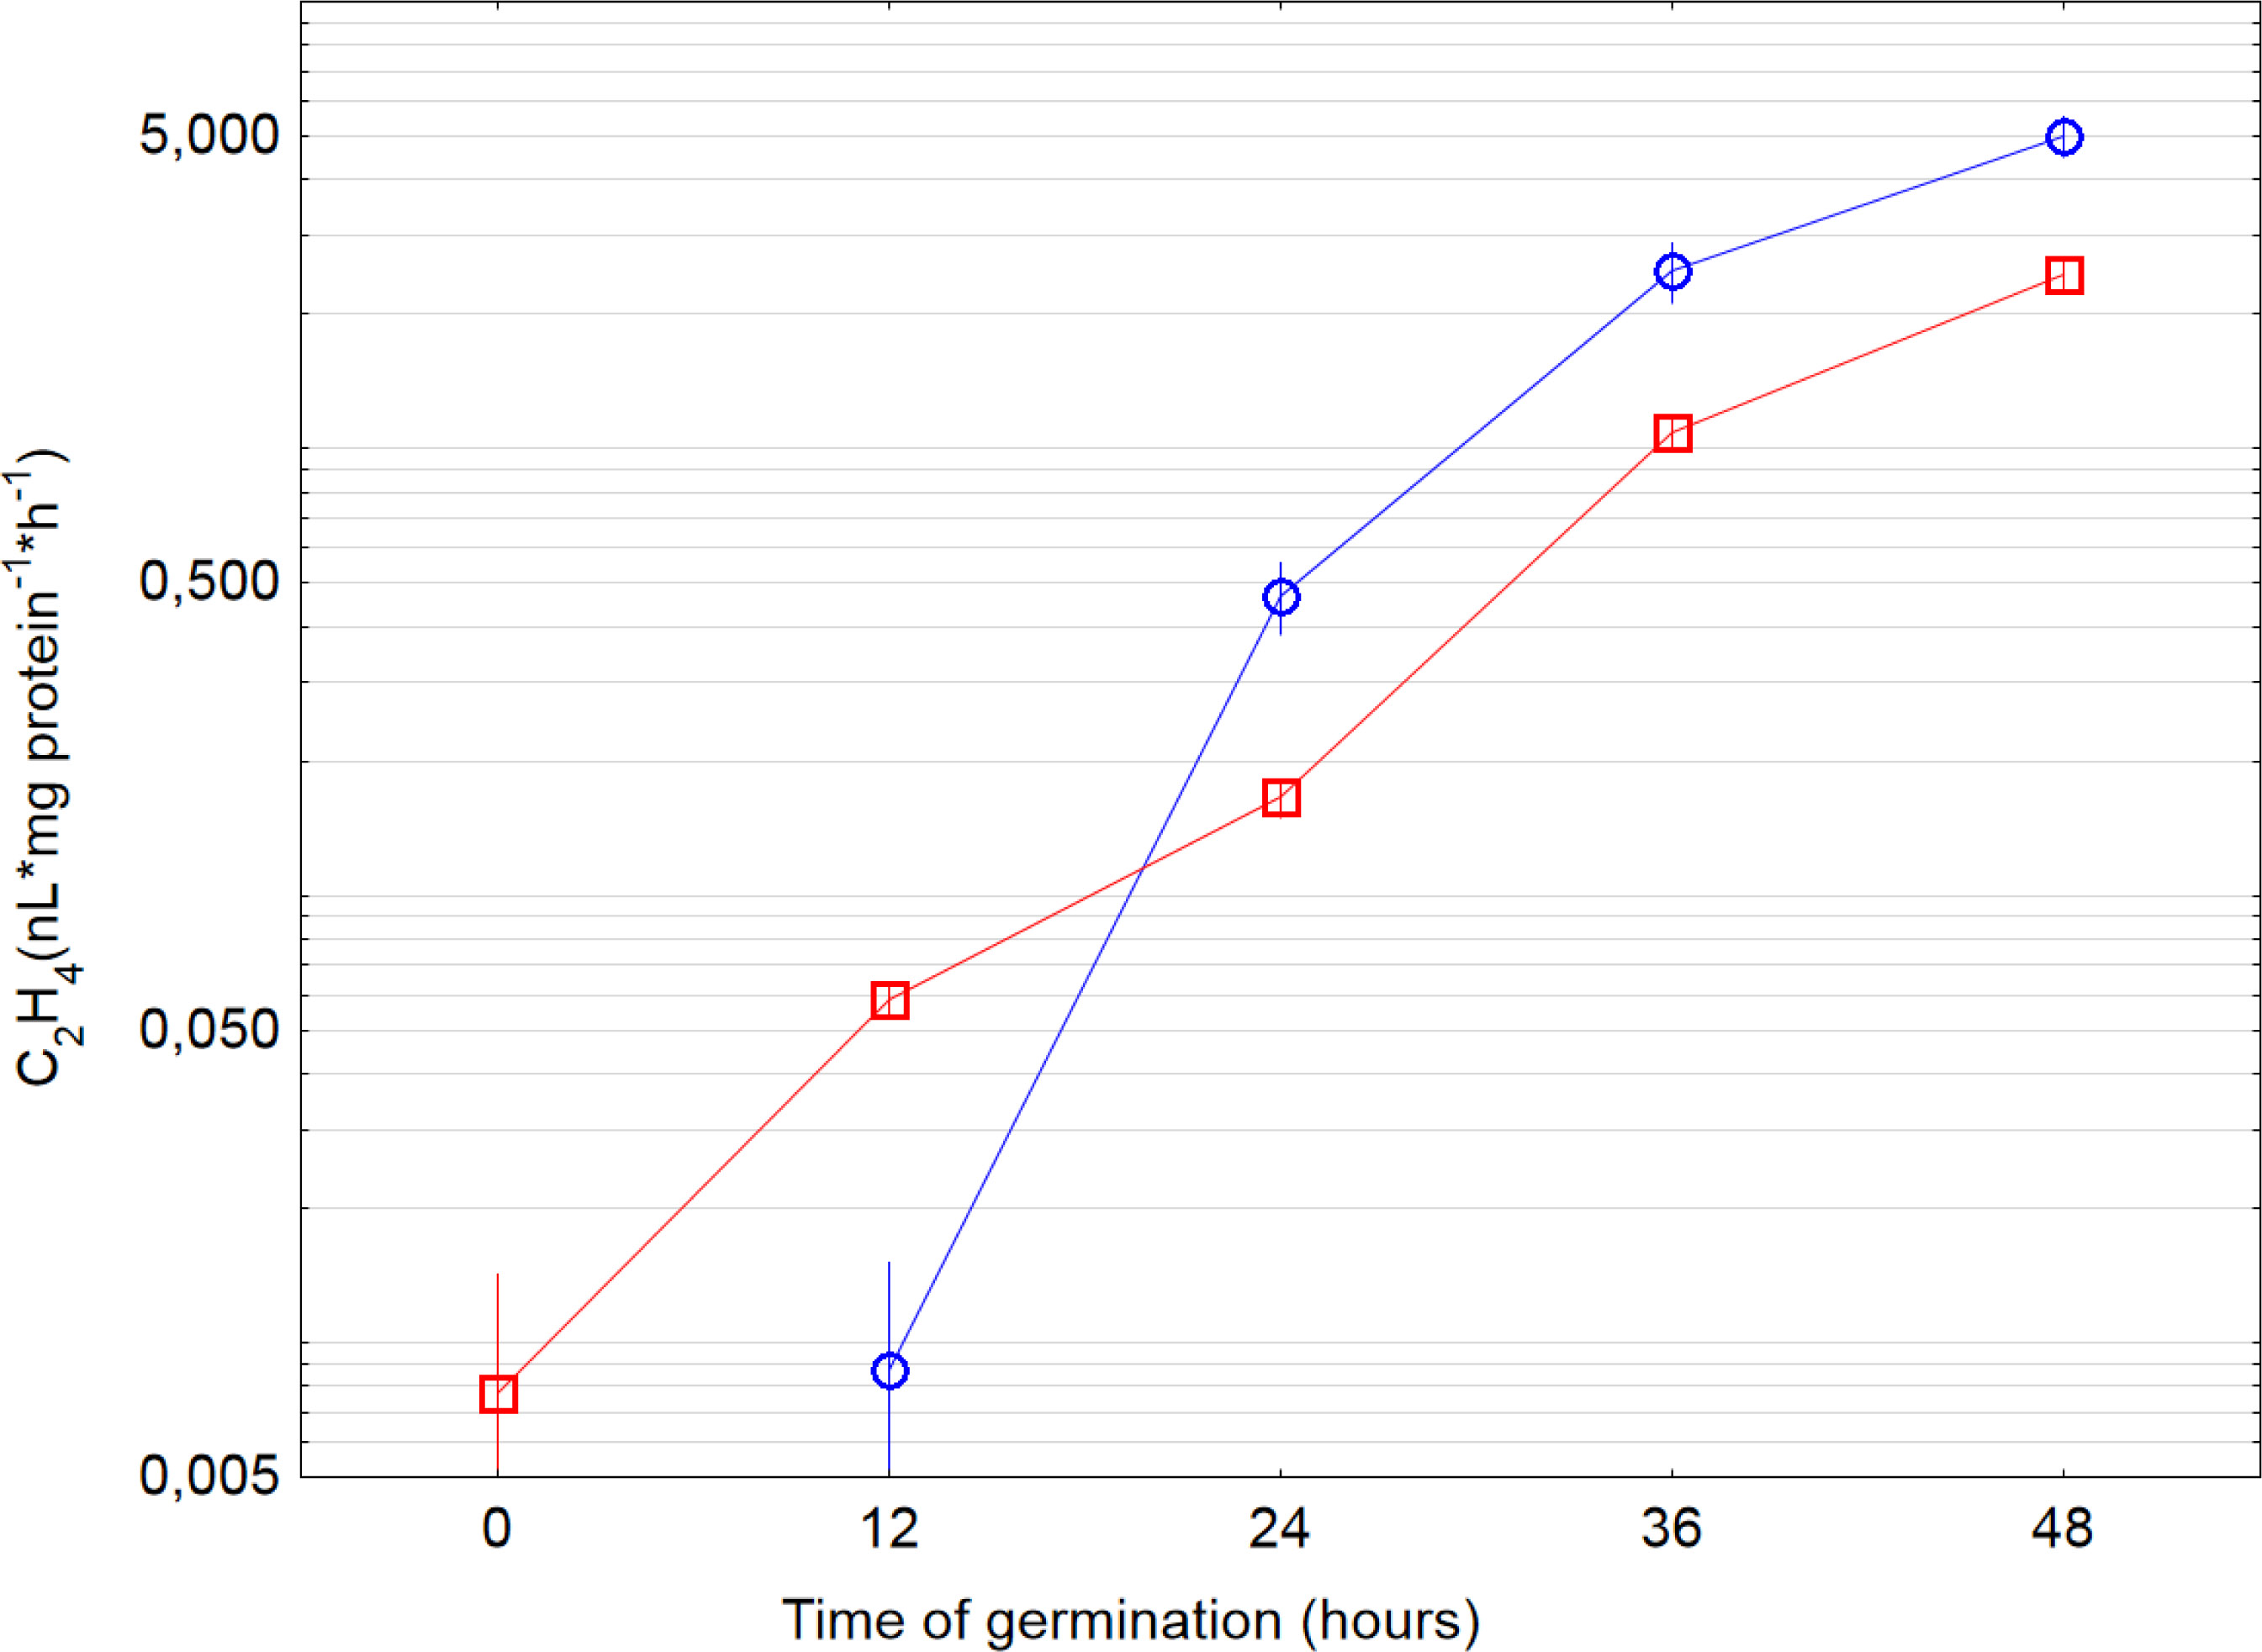
Figure 5
In vivo (○) and in vitro (□) ACC oxidase activity in seeds germinated for different period. Ethylene production shown in log-decimal scale; vertical bars denote ±SE