
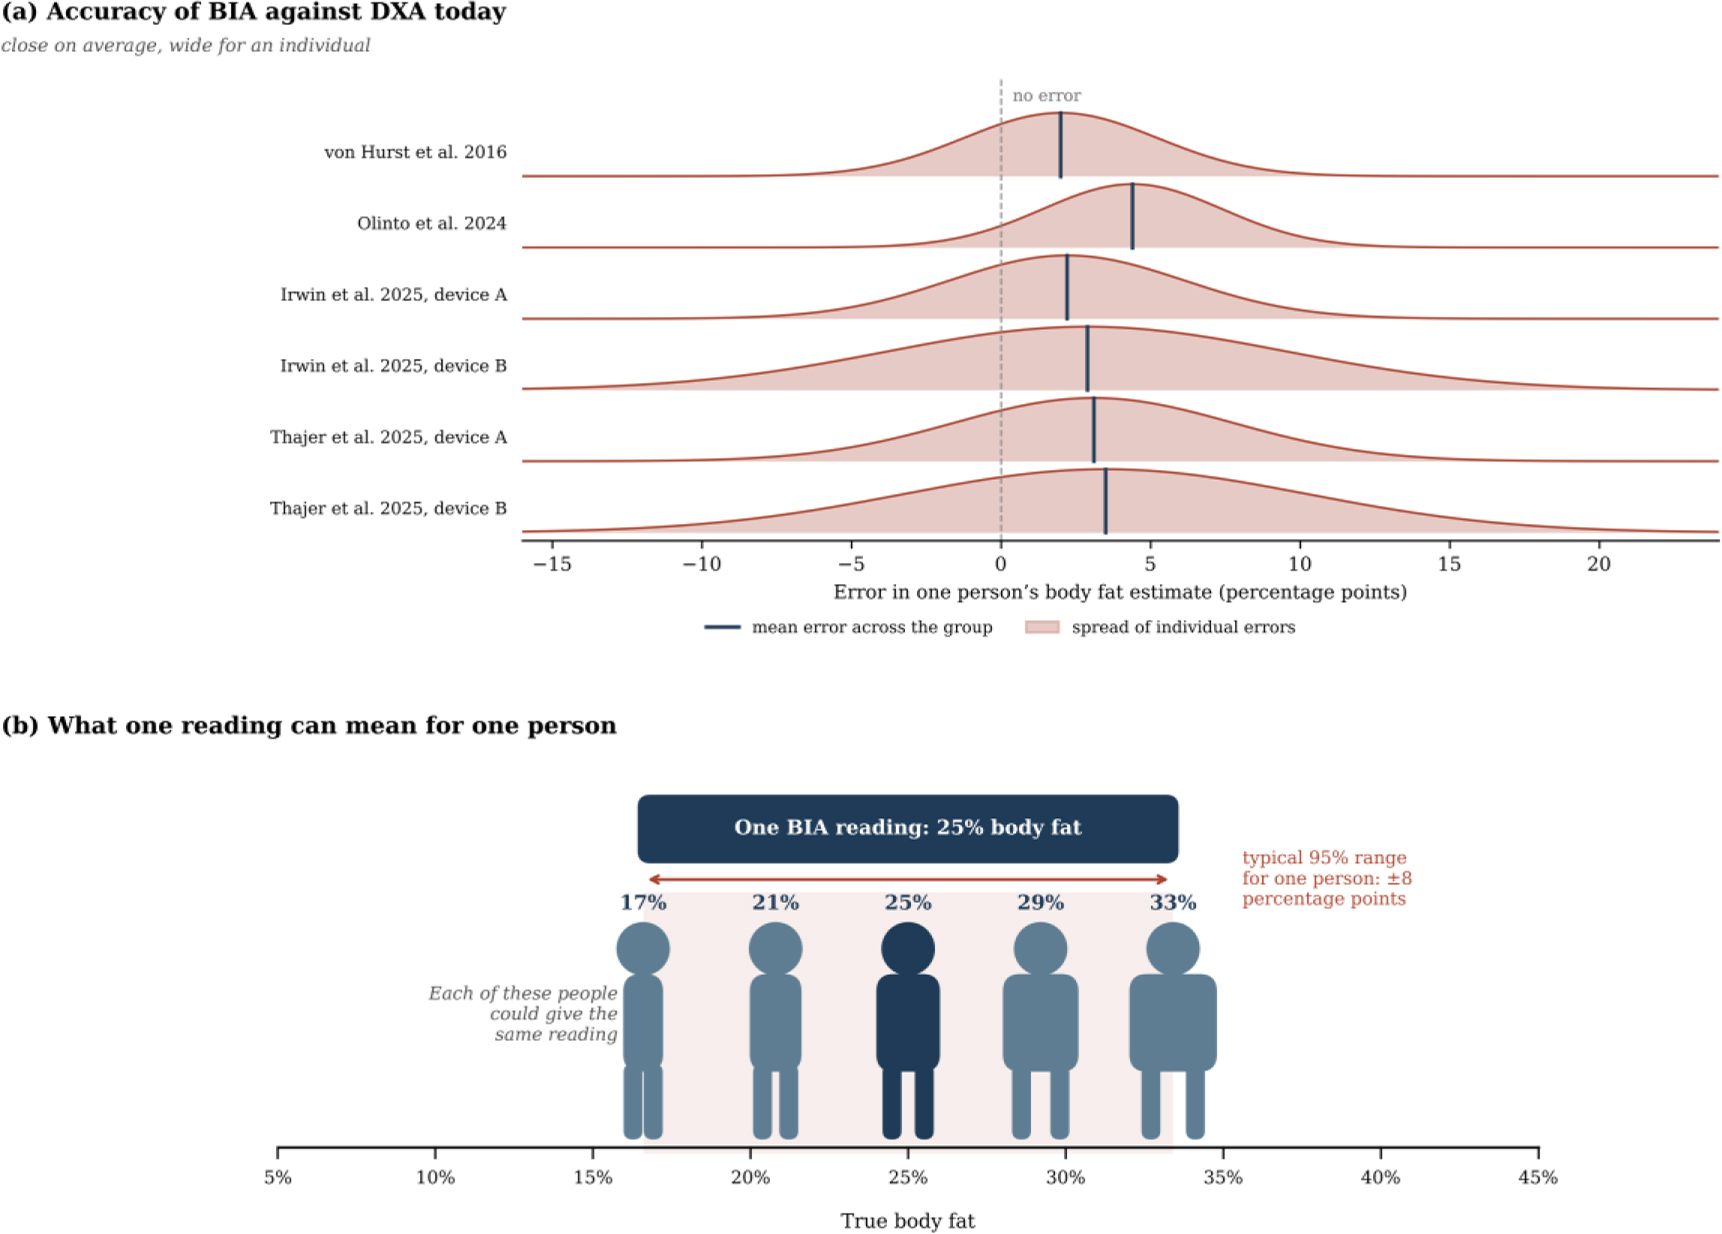
Fig. 1:
Individual error of BIA against DXA. (a) Distribution of individual errors in body fat, derived from the mean error and the 95% limits of agreement reported in four validation studies [6–9]. (b) Range of true body fat consistent with a single reading of 25%, based on the median half-width of these limits of about ±8 percentage points.
Table 1:
Related works on phantoms, modelling and measurement errors in bioimpedance spectroscopy.
| Study | Focus | Frequency range | Relevance to this work |
|---|---|---|---|
| Anand et al. [15] | Forearm phantom of fat, muscle and blood | 1 kHz–349 kHz | Phantom materials and measurement device |
| Yu et al. [16] | Ansys model and wrist phantom | 1 kHz–1 MHz | Electrode type controls how uniform the current is |
| Bublex et al. [17,18,19] | PVA phantoms of muscle and fat, multilayer leg | 1 kHz–1 MHz | Alternative phantom materials and layer bonding |
| Longhitano et al. [20] | Ansys Maxwell model of measuring cells | 1 kHz–1 MHz | Maxwell models match cell measurements |
| Grimnes and Martinsen [22] | Errors in four-electrode measurements | Not frequency-specific | Four-electrode systems are still affected by errors |
| Scharfetter et al. [23] | Model of stray capacitance errors | 5 kHz–1 MHz | Cause of the high-frequency phase difference |
| Buendia et al. [25] | Correction of capacitive leakage | Not frequency-specific | Basis for the stray capacitance correction |
| Jaffrin and Morel [5] | Review of BIS and BIA methods | Multi-frequency | Current practice relies on calibration equations |
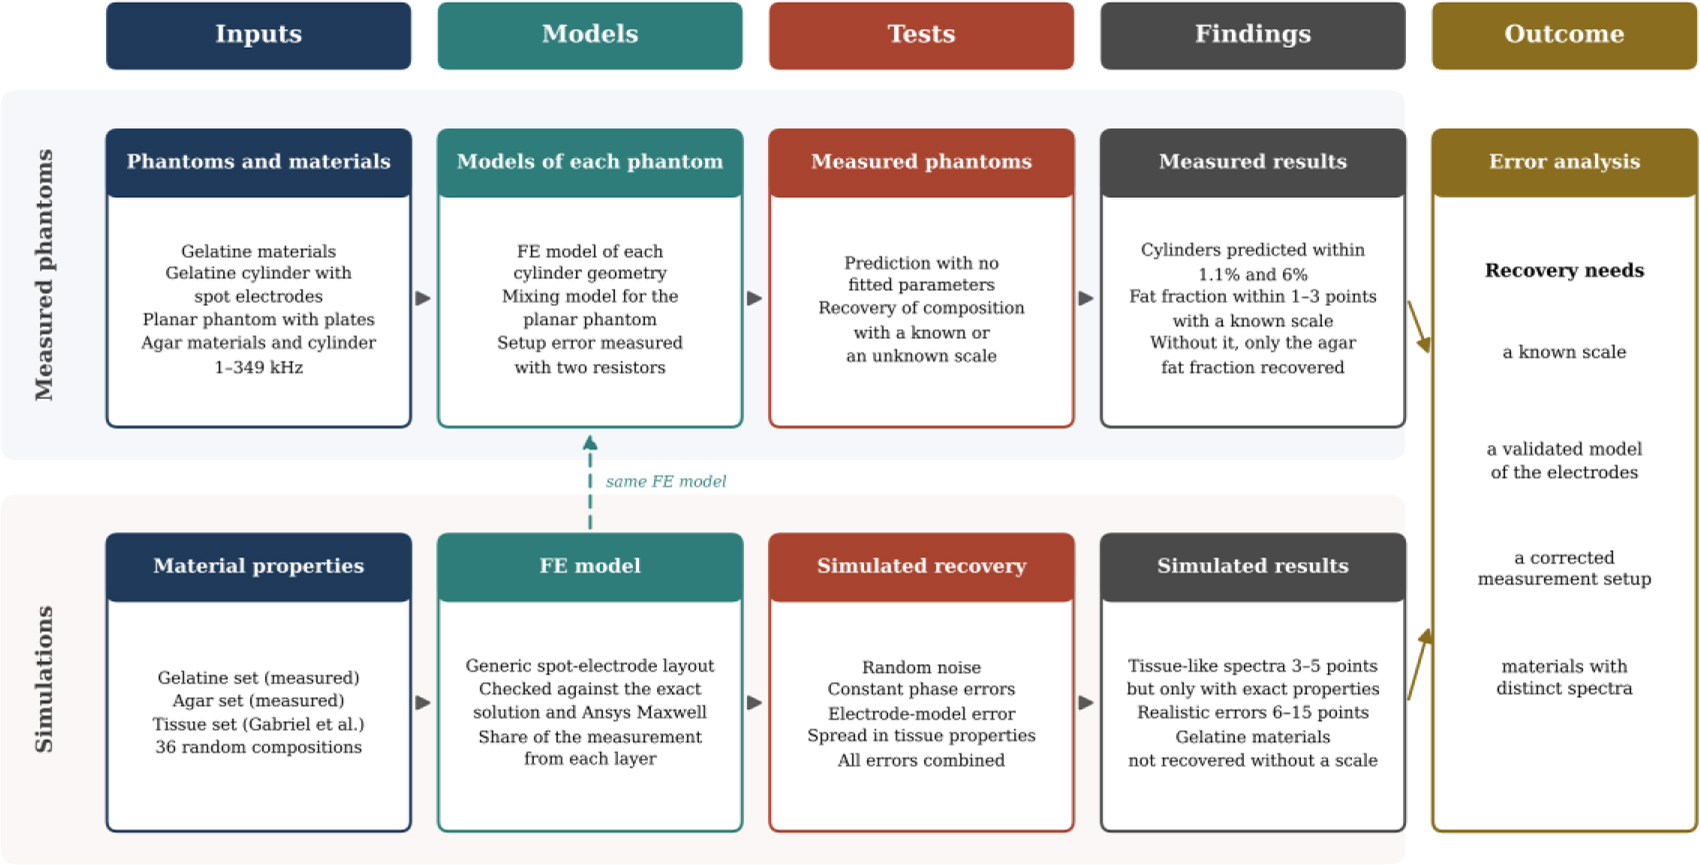
Fig. 2:
Workflow of the study. The upper strand follows the measured phantoms and the lower strand the simulations, and both lead to the error analysis. FE, finite element.
Table 2:
Geometry, electrodes and composition by volume of each phantom.
| Phantom | Geometry | Electrodes | FM (%) | FFM (%) | TBW (%) |
|---|---|---|---|---|---|
| Cylinder, gelatine set | Concentric layers, gel radius 3.4 cm, length 20 cm | Four spot electrodes, voltage 6 cm and current 11.5 cm apart | 46.2 | 42.7 | 11.1 |
| Planar, gelatine set | Stacked layers, height 0.8 cm | Two-electrode plates | 31.3 | 28.9 | 39.8 |
| Cylinder, agar set | Concentric layers, gel radius 3.4 cm, length 20 cm | Four spot electrodes, as above | 50.3 | 44.7 | 5.0 |
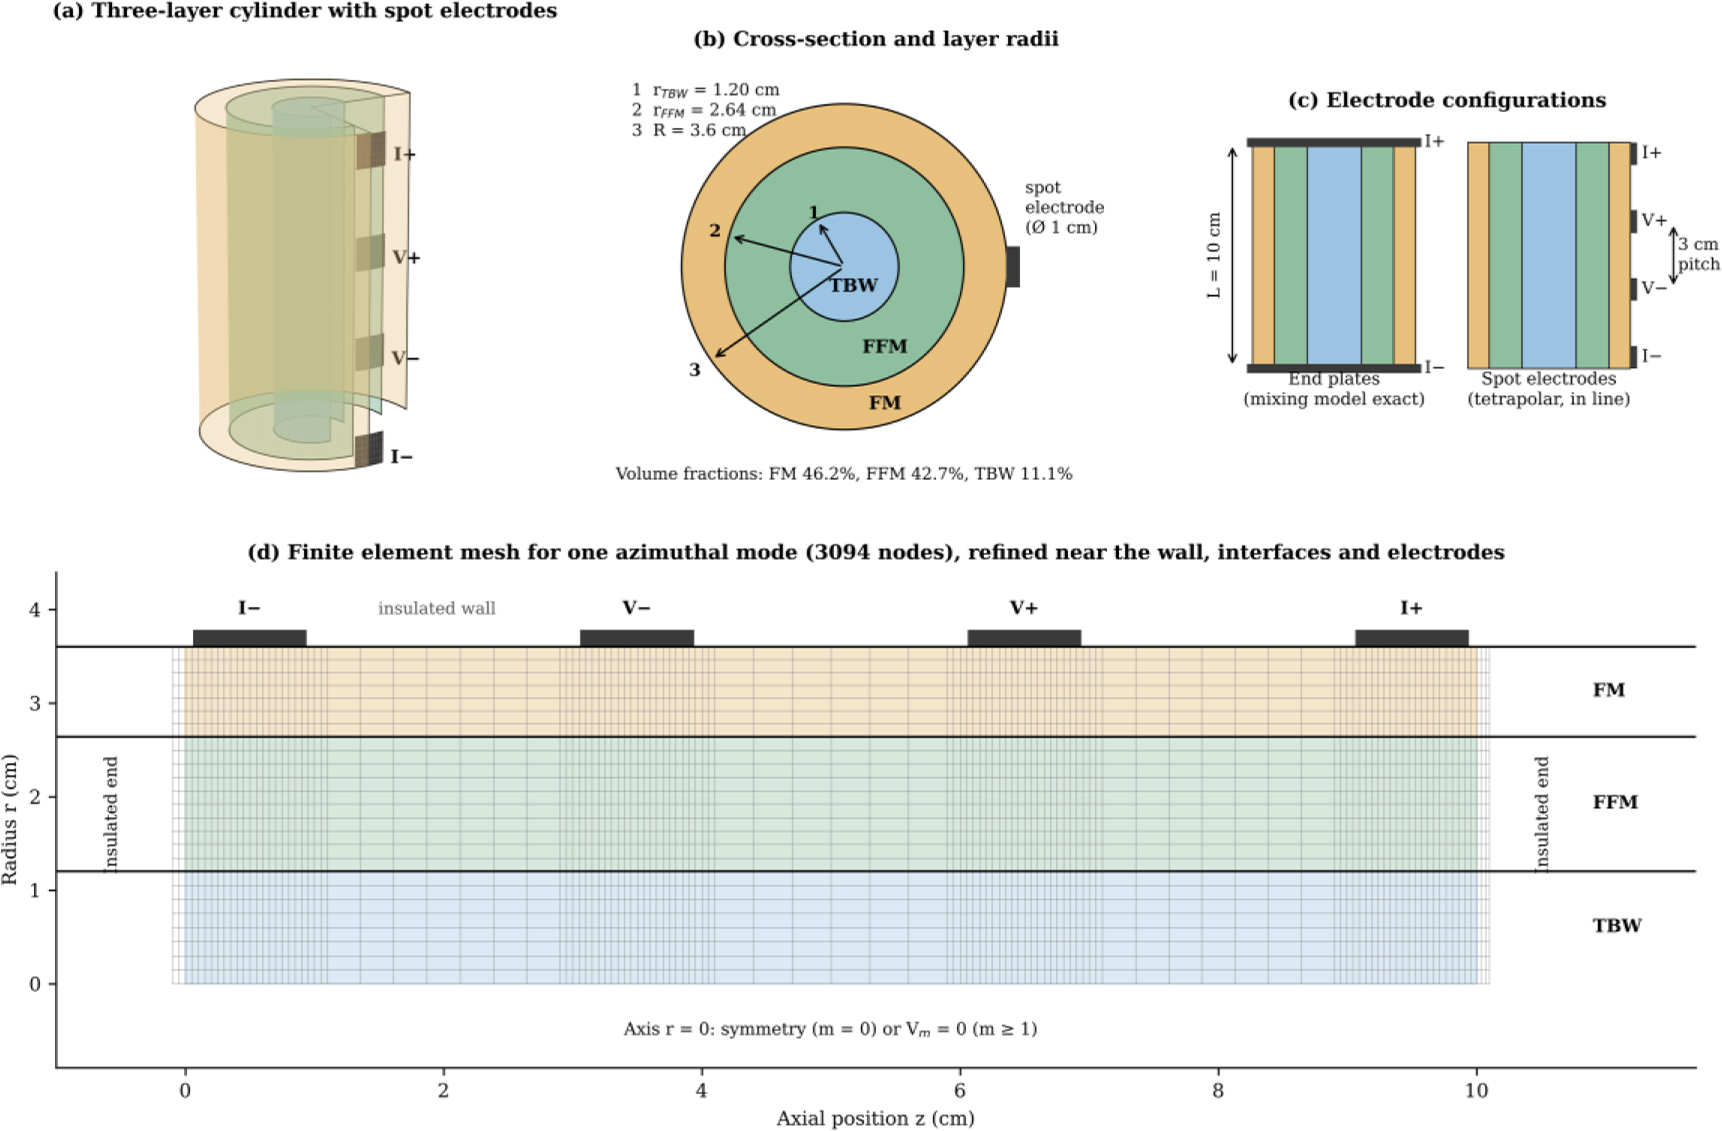
Fig. 3:
Generic simulation setup. (a) Cut-away view of the three-layer cylinder with four spot electrodes. (b) Cross-section with the layer radii. (c) End plates and spot electrodes with their dimensions. (d) Finite element mesh for one azimuthal mode, with the boundary conditions and the electrode positions.
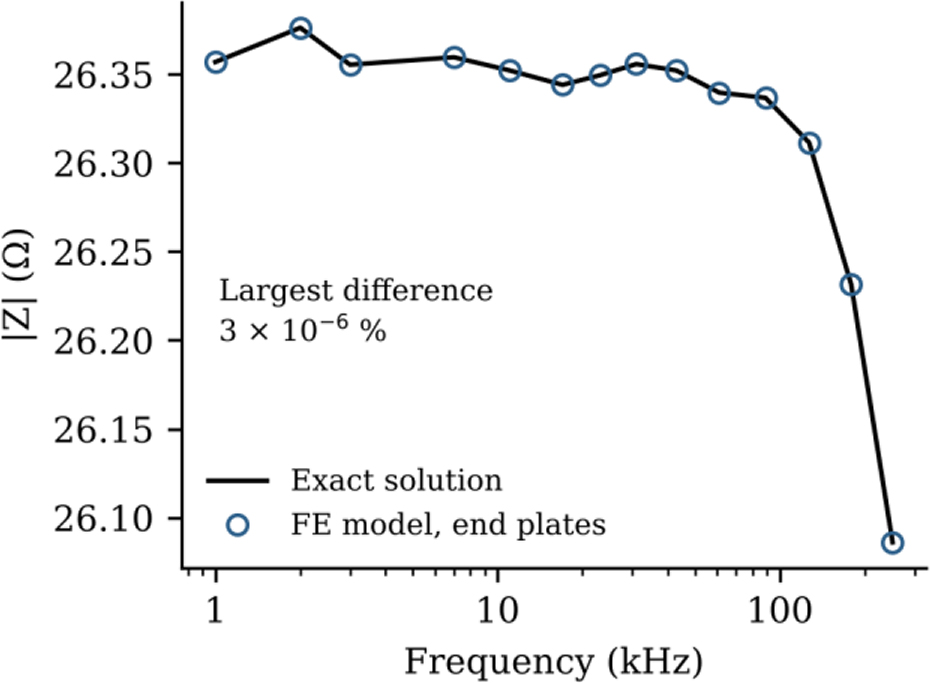
Fig. 4:
Verification of the FE model with end plates. The impedance magnitude of the gelatine cylinder composition from the FE model is compared with the exact solution of the mixing model.
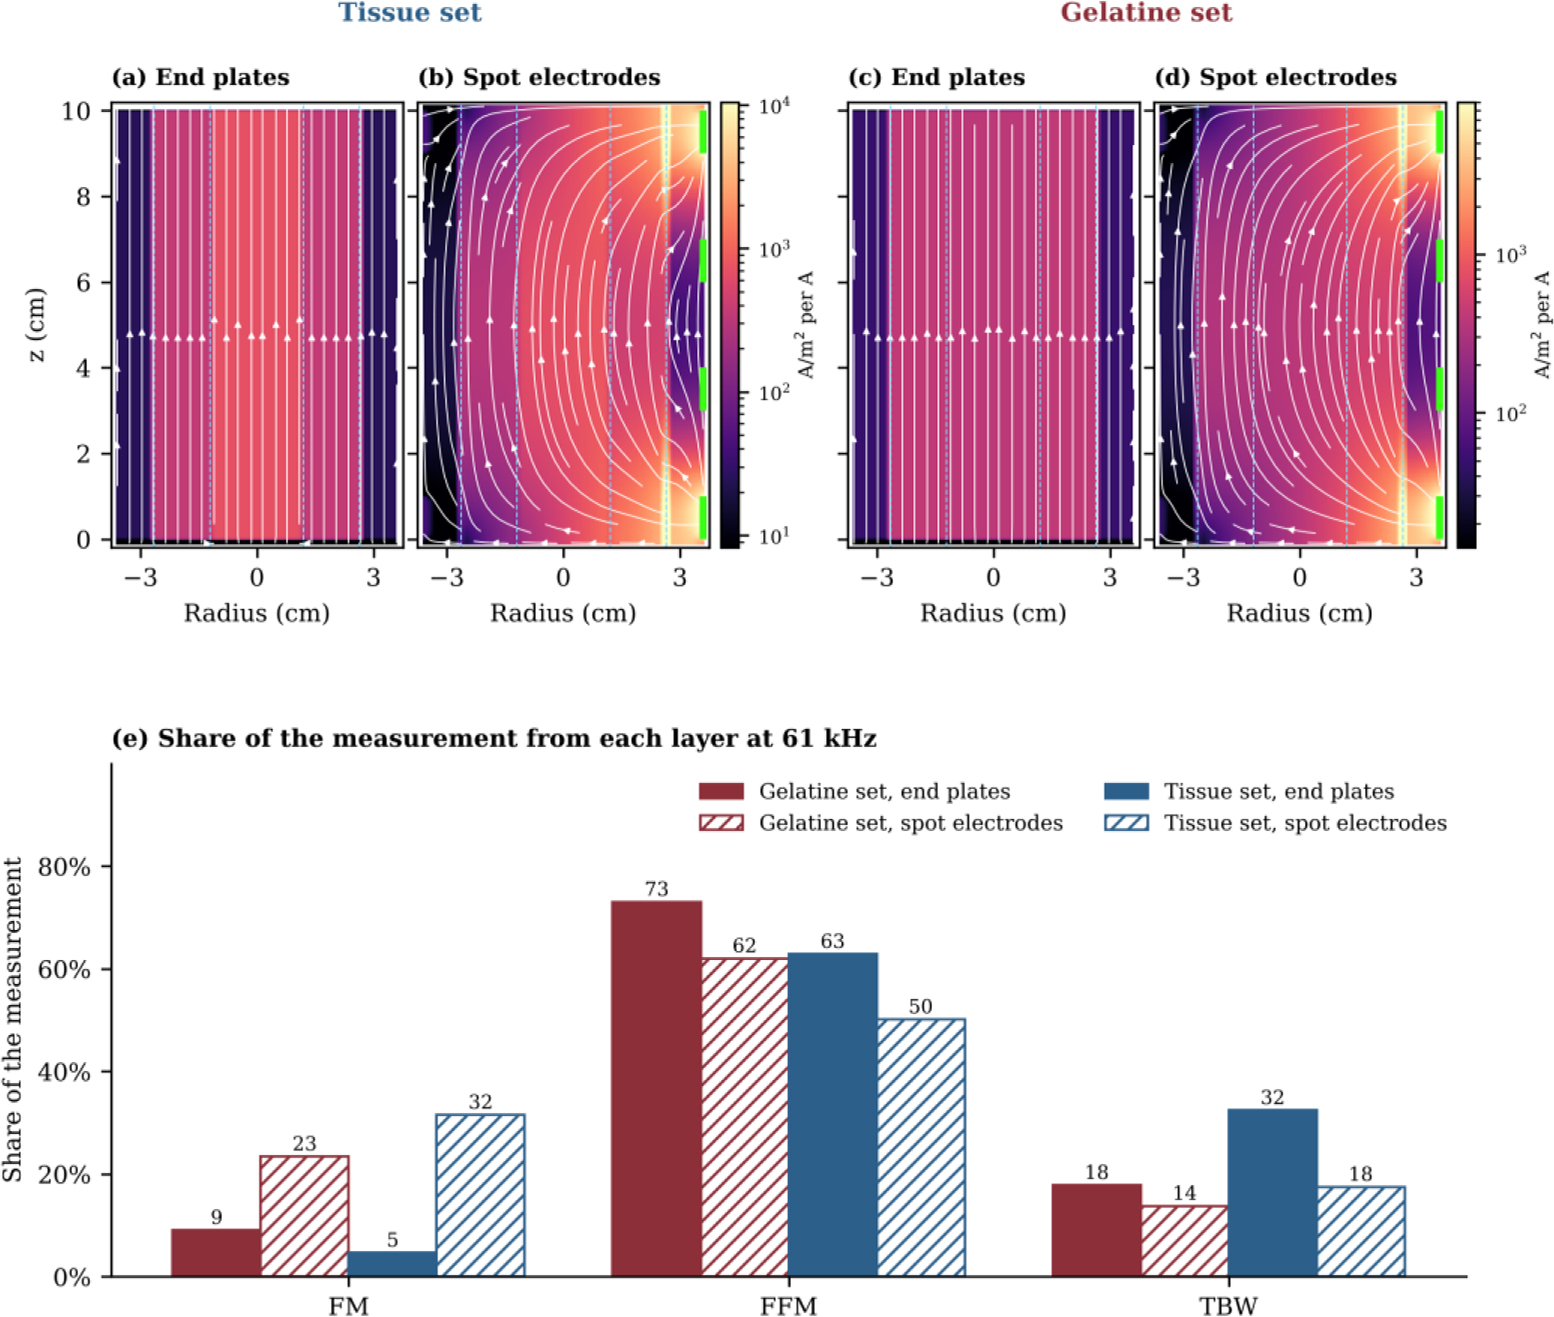
Fig. 5:
Current flow at 61 kHz in the generic cylinder. (a, c) End plates. (b, d) Spot electrodes on the right-hand side. Panels (a) and (b) use the tissue set and panels (c) and (d) the gelatine set, and each pair shares one colour scale. Colour shows the current density for 1 A injected, white lines follow the current, dashed lines mark the layer boundaries and green marks show the spot electrodes. (e) Share of the measurement arising from each layer.
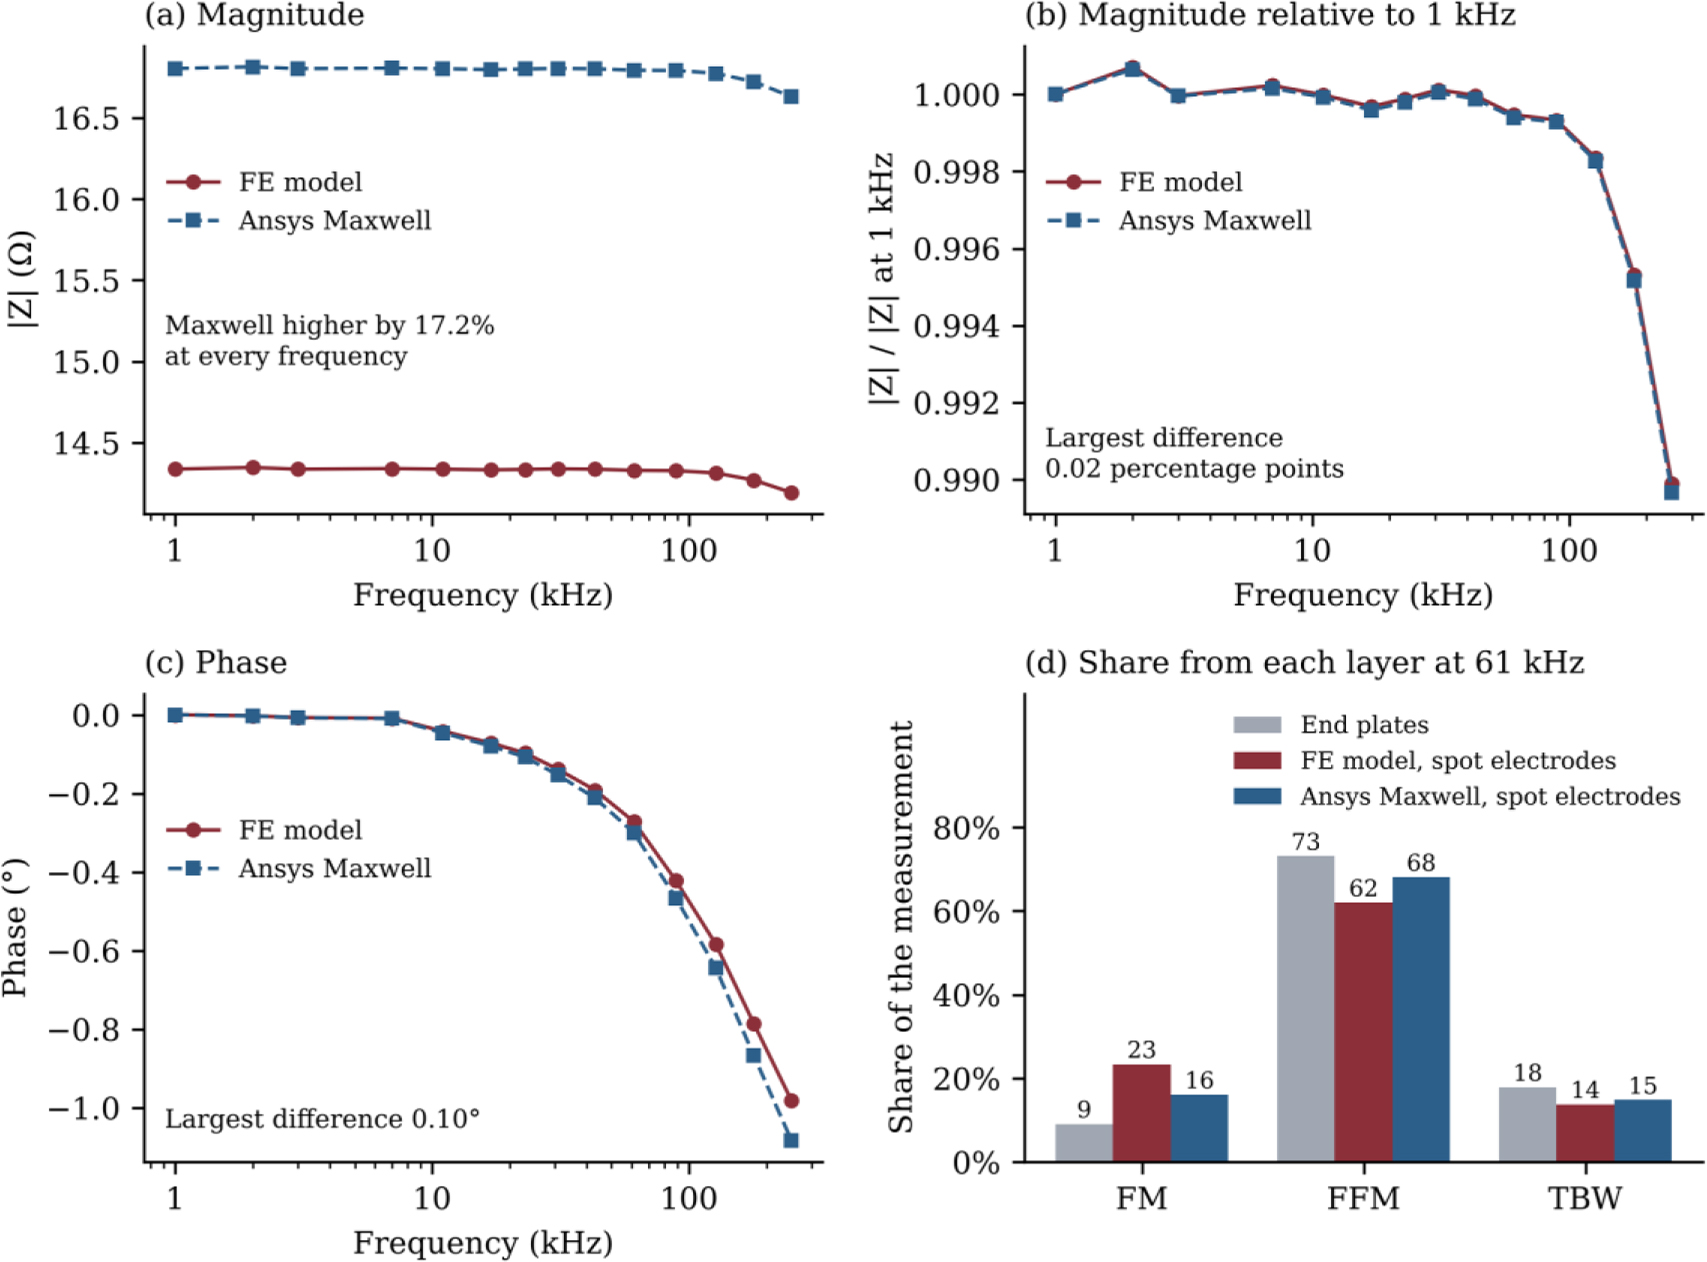
Fig. 6:
Comparison of the FE model with Ansys Maxwell for the generic spot-electrode layout with the composition of the gelatine cylinder. (a) Impedance magnitude. (b) Magnitude relative to its value at 1 kHz. (c) Phase. (d) Share of the measurement arising from each layer at 61 kHz.
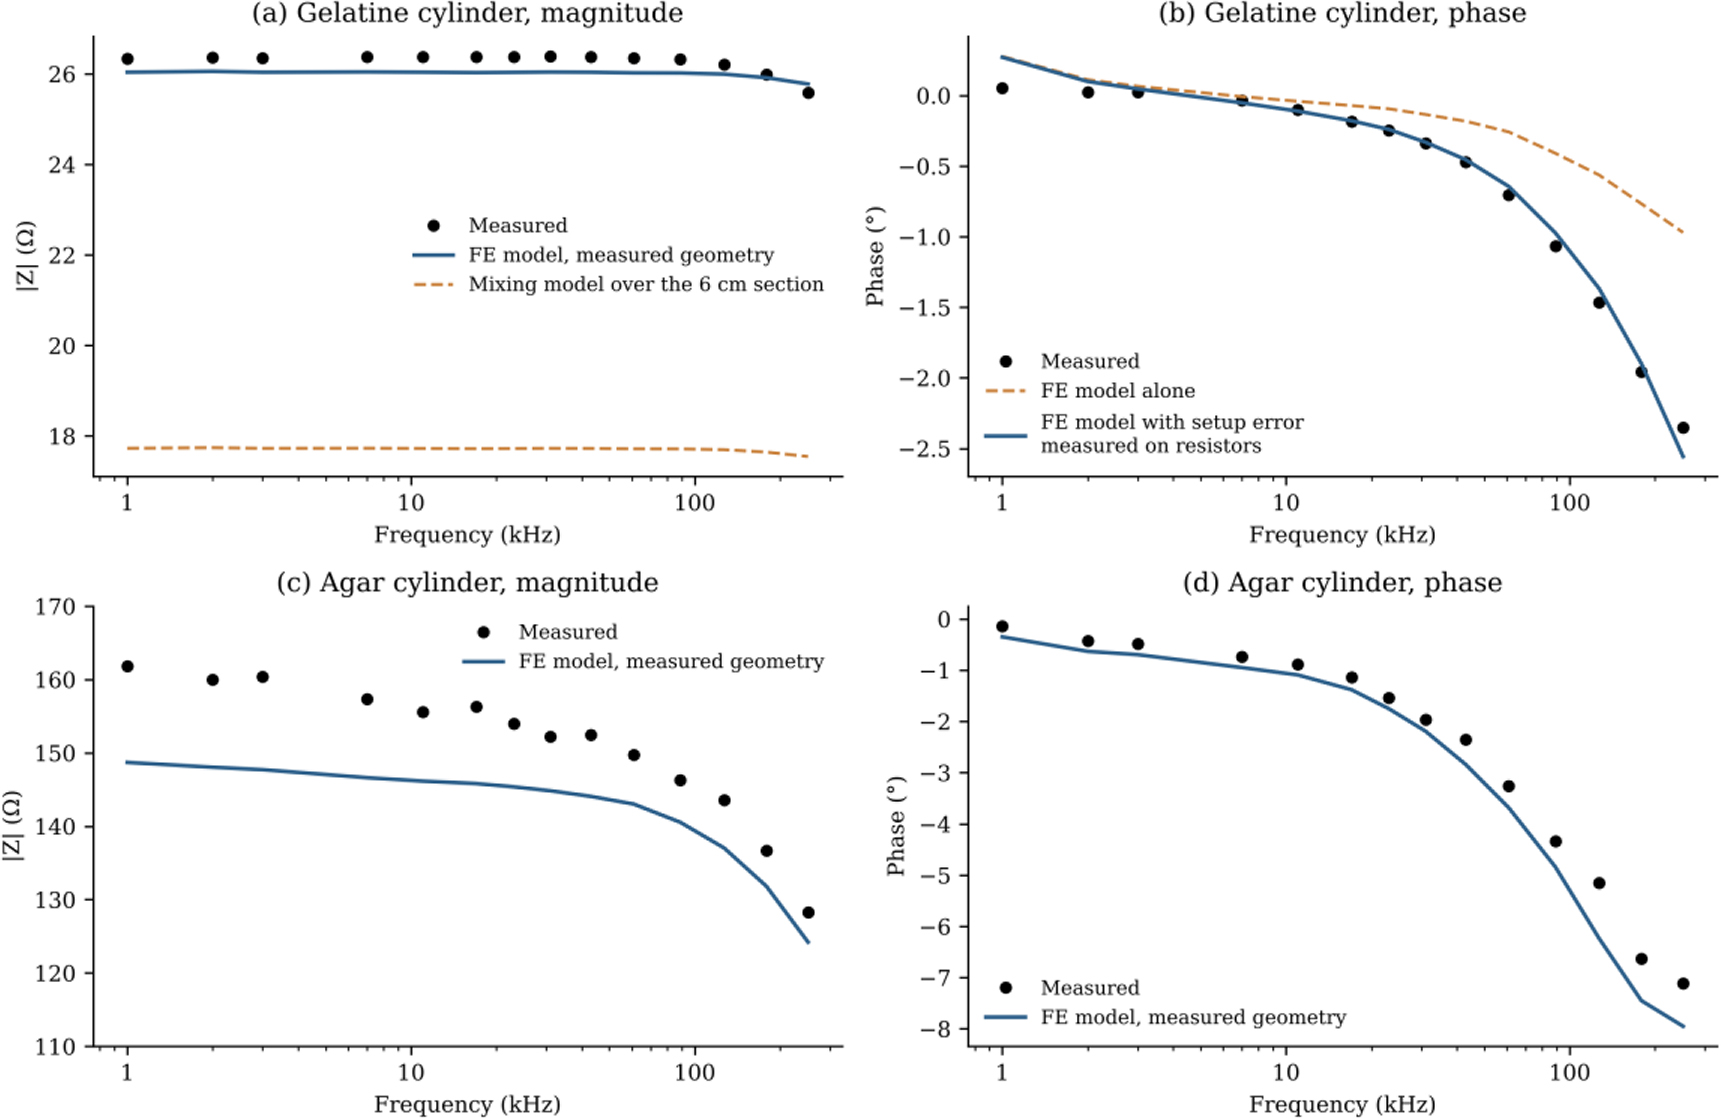
Fig. 7:
Measured cylinders compared with the FE model of their geometry, with no fitted parameters. (a) Magnitude of the gelatine cylinder, together with the mixing model over the section between the voltage electrodes. (b) Phase of the gelatine cylinder from the FE model alone and with the setup error measured on precision resistors. (c) Magnitude and (d) phase of the agar cylinder.
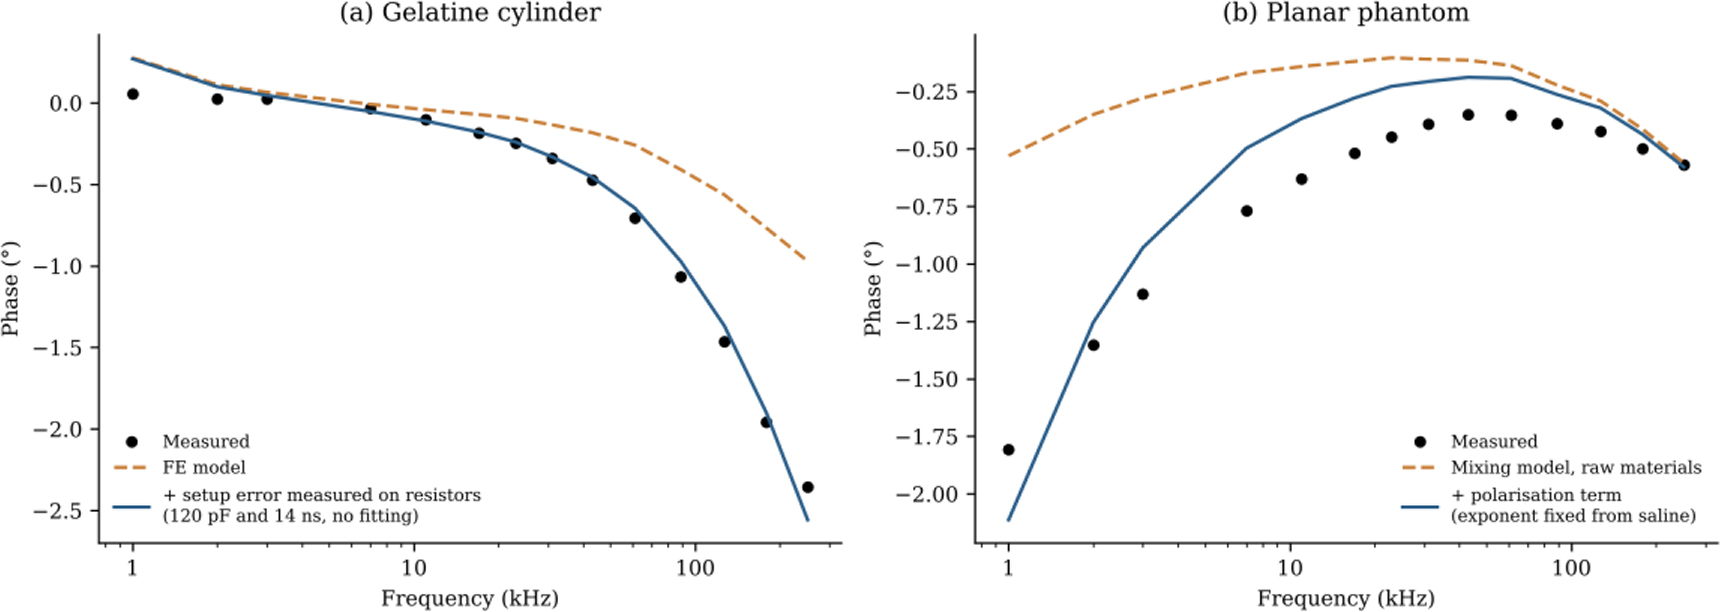
Fig. 8:
Correction of the phase difference between model and measurement. (a) Gelatine cylinder, with the setup error measured on precision resistors. (b) Planar phantom, with an additional polarisation term.
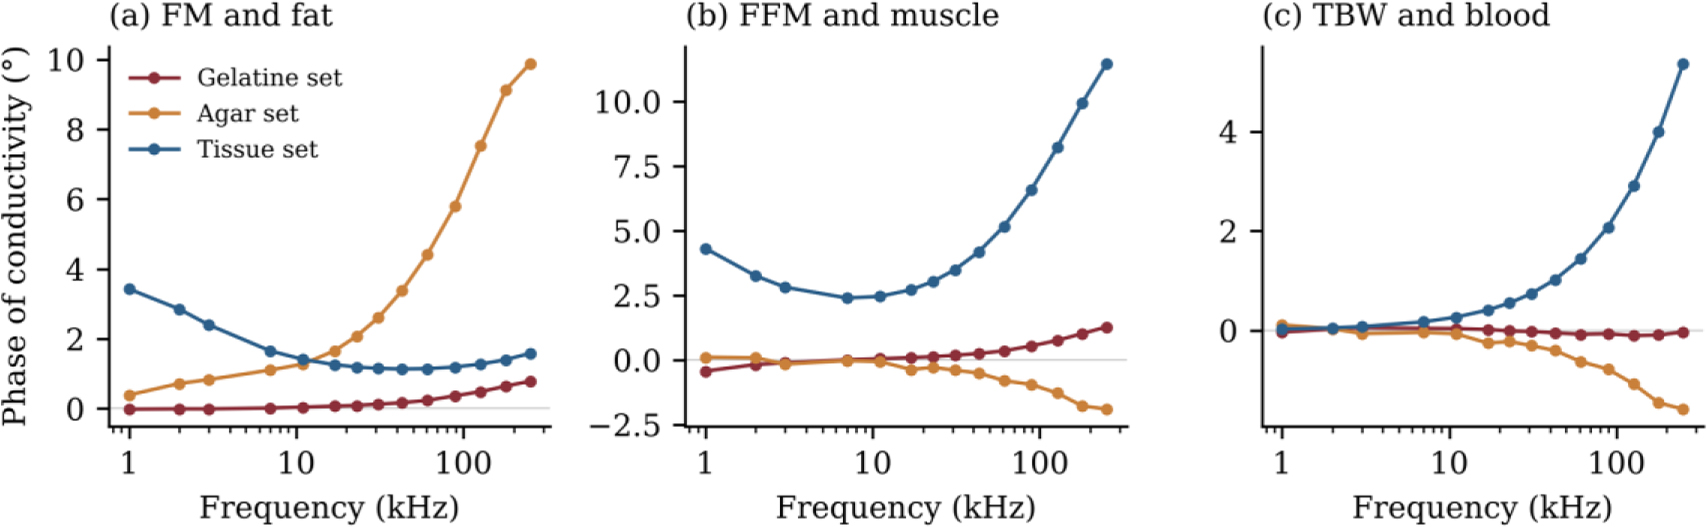
Fig. 9:
Phase of the complex conductivity of the FM, FFM and TBW materials for the gelatine, agar and tissue sets.
Table 3:
Composition recovered from each measured phantom, with one fit of its measured spectrum. Values in brackets give the range of each fraction over all fits within 1% of the lowest residual. For a known scale, this range also includes a change of ±5% in the scale. The gelatine cylinder was corrected for the setup error, and no fit had a free parameter other than the composition and, where stated, the scale. The ranges show how well the spectrum fixes each fraction, but they do not include errors of the model.
| Phantom | Fit | FM (%) | FFM (%) | TBW (%) |
|---|---|---|---|---|
| Gelatine cylinder | True composition | 46.2 | 42.7 | 11.1 |
| Gelatine cylinder | FE model, known scale | 47 (45–49) | 49 (46–51) | 4 (4–5) |
| Gelatine cylinder | FE model, free scale | 39 (36–39) | 57 (57–59) | 4 (4–5) |
| Agar cylinder | True composition | 50.3 | 44.7 | 5.0 |
| Agar cylinder | FE model, known scale | 51 (50–52) | 32 (6–46) | 16 (4–43) |
| Agar cylinder | FE model, free scale | 50 (50–54) | 46 (4–46) | 4 (4–44) |
| Planar | True composition | 31.3 | 28.9 | 39.8 |
| Planar | Mixing model, known scale | 28 (23–33) | 37 (28–48) | 34 (24–45) |
| Planar | Mixing model, free scale | 0 (0–6) | 53 (42–62) | 47 (36–58) |
Table 4:
Recovery rate for simulated spectra from the FE model with spot electrodes and random noise. The recovery rate is the percentage of compositions with all three fractions within 15 percentage points of the truth.
| Material set | Fitted with | Scale factor | 0.1% noise (%) | 1% noise (%) |
|---|---|---|---|---|
| Gelatine | Mixing model | Unknown | 33 | 12 |
| Gelatine | FE model | Unknown | 79 | 30 |
| Gelatine | FE model | Known | 100 | 91 |
| Agar | Mixing model | Unknown | 11 | 4 |
| Tissue | Mixing model | Unknown | 41 | 19 |
| Tissue | FE model | Unknown | 97 | 85 |
| Tissue | FE model | Known | 100 | 100 |
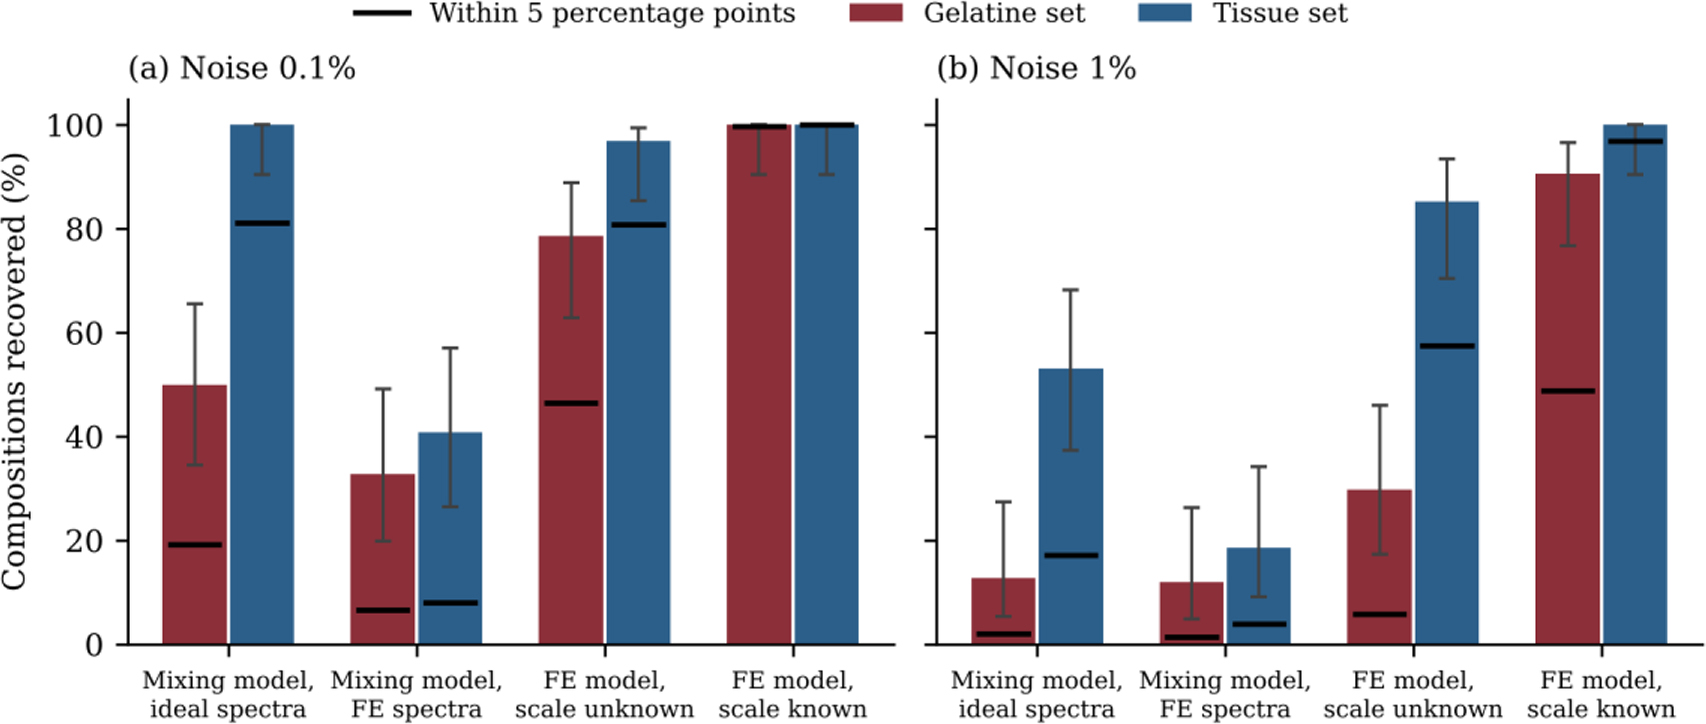
Fig. 10:
Recovery rate for the gelatine and tissue sets at (a) 0.1% noise and (b) 1% noise. The first group fits ideal spectra from the mixing model with the same model, and the other groups fit spectra from the FE model of spot electrodes. Bars show recovery within 15 percentage points with 95% confidence intervals, and black lines show recovery within 5 percentage points.
Table 5:
Recovery rate in percent with errors that are the same at all frequencies. All spectra were fitted with the FE model and had random noise of 0.1%. A magnitude error is absorbed by a free scale factor, and it therefore has no effect when the scale is unknown.
| Added error | Gelatine, known scale | Gelatine, unknown scale | Tissue, known scale | Tissue, unknown scale |
|---|---|---|---|---|
| None | 100 | 79 | 100 | 97 |
| Phase ±0.1° | 100 | 29 | 100 | 98 |
| Phase ±0.3° | 47 | 10 | 100 | 94 |
| Setup error 120 pF and 14 ns | 27 | 0 | 100 | 58 |
| Magnitude 17% | 69 | 79 | 81 | 97 |
Table 6:
Recovery of the tissue set when the true tissue properties differ from those used in the fit. All cases used the FE model, a phase error of ±0.1° and random noise of 0.1%. Typical errors are in percentage points.
| Spread in tissue properties | Known scale, recovered (%) | Known scale, typical error FM / FFM / TBW | Unknown scale, recovered (%) | Unknown scale, typical error FM / FFM / TBW |
|---|---|---|---|---|
| None | 100 | 1 / 2 / 1 | 98 | 5 / 3 / 3 |
| 5% | 99 | 3 / 5 / 4 | 79 | 11 / 8 / 5 |
| 10% | 97 | 3 / 6 / 6 | 74 | 12 / 9 / 7 |
| 20% | 86 | 7 / 7 / 9 | 62 | 15 / 13 / 8 |
Table 7:
Recovery when several realistic errors act together. All cases used the FE model, a phase error of ±0.1° and random noise of 0.1%, and the 17% magnitude error applies only when the scale is known. Typical errors are in percentage points.
| Material set | Scale | Spread in tissue properties | Recovered (%) | Typical error FM / FFM / TBW |
|---|---|---|---|---|
| Gelatine | Known, with 17% magnitude error | Not applicable | 67 | 13 / 9 / 9 |
| Gelatine | Unknown | Not applicable | 29 | 32 / 16 / 17 |
| Tissue | Known, with 17% magnitude error | 10% | 86 | 9 / 6 / 8 |
| Tissue | Unknown | 10% | 74 | 12 / 9 / 7 |
| Tissue | Known, with 17% magnitude error | 20% | 64 | 12 / 9 / 10 |
| Tissue | Unknown | 20% | 62 | 15 / 13 / 8 |
Table 8:
Recovery of the tissue set in percent with the band extended beyond 251 kHz. All cases used the FE model and random noise of 0.1%, unless stated otherwise. The first row gives the error amplification factor of the tissue set over each band.
| Test | 1–251 kHz | 1 kHz–500 kHz | 1 kHz–1 MHz | 1 kHz–2 MHz |
|---|---|---|---|---|
| Error amplification factor | 61 | 53 | 43 | 38 |
| Unknown scale | 97 | 98 | 99 | 98 |
| Unknown scale, 1% noise | 85 | 88 | 88 | 88 |
| Unknown scale, phase ±0.1°, 10% spread | 74 | 71 | 69 | 74 |
| Unknown scale, phase ±0.1°, 20% spread | 62 | 56 | 56 | 51 |
| Known scale, phase ±0.1°, 17% magnitude, 10% spread | 86 | 87 | 87 | 81 |
| Known scale, phase ±0.1°, 17% magnitude, 20% spread | 64 | 62 | 62 | 60 |
| Unknown scale, uncorrected setup error of 120 pF and 14 ns | 58 | 23 | 27 | 47 |
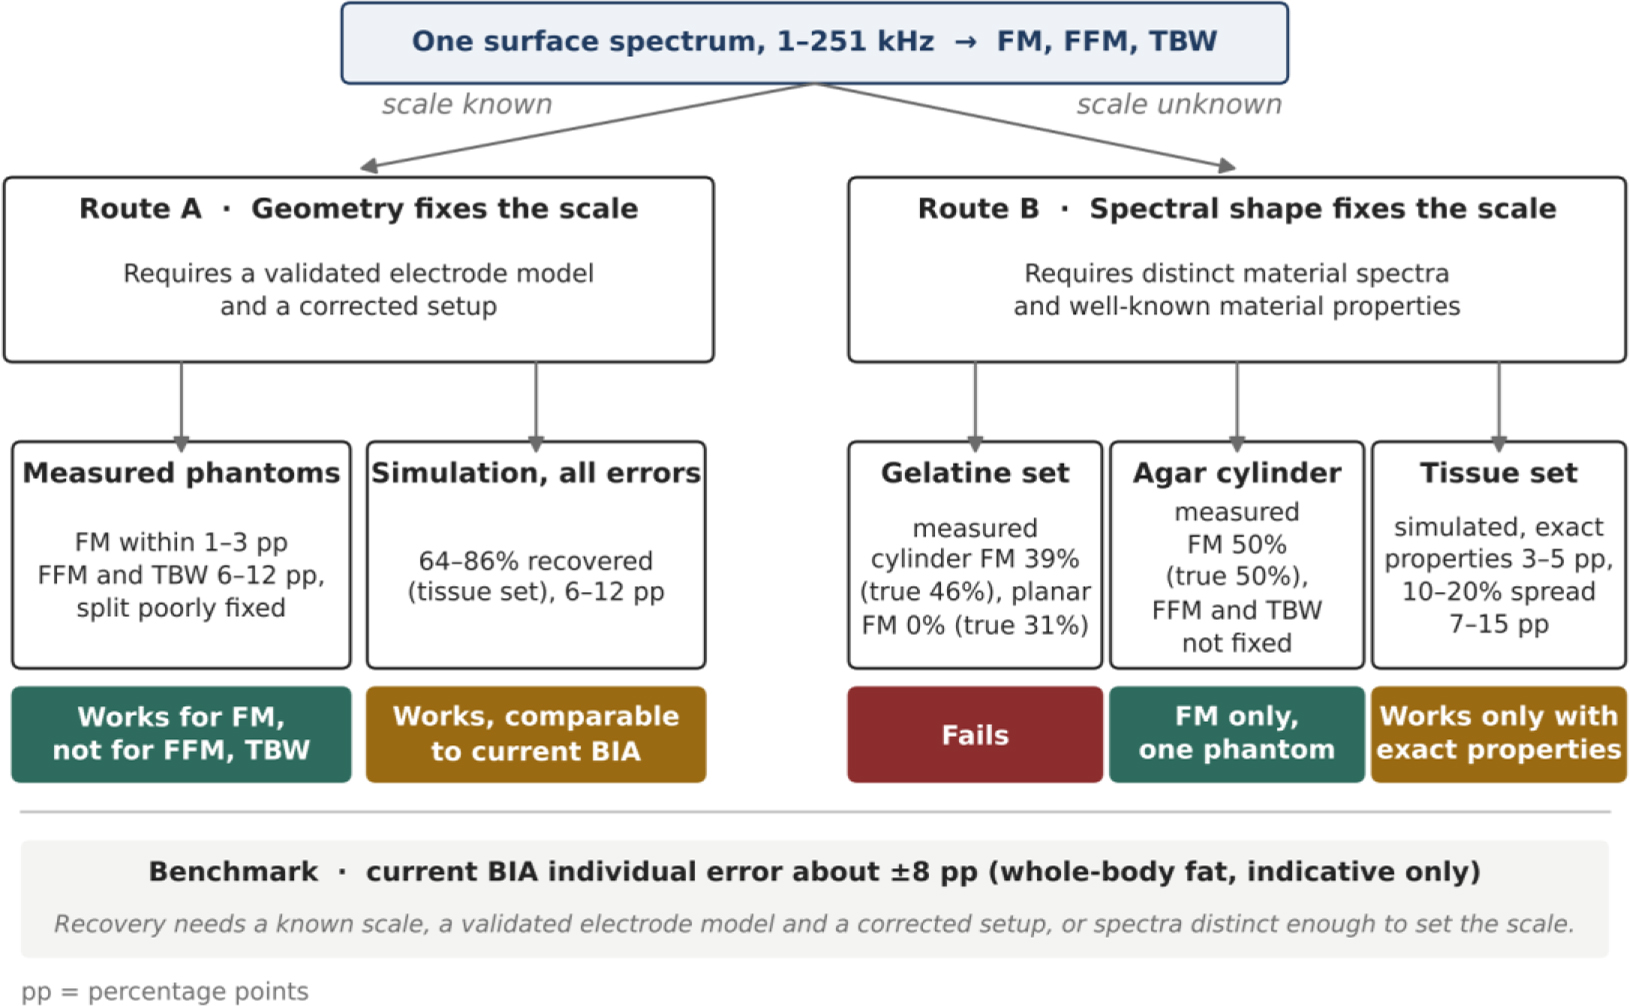
Fig. 11:
Two routes to recovering tissue volumes from one surface spectrum. In route A, the measured geometry fixes the scale. In route B, the shapes of the material spectra fix it instead. Values are taken from Tables 3, 6 and 7, and pp denotes percentage points. The agar result is based on a single phantom, and the benchmark of about ±8 percentage points refers to whole-body fat in people and is only indicative.
Table 9:
Factors that limited recovery in this study and the requirement each places on a future test. Recovery rates are percentages of simulated compositions recovered within 15 percentage points with the FE model, unless stated otherwise.
| Factor | Effect observed | Requirement |
|---|---|---|
| Similar material spectra | With an unknown scale and 1% noise, 30% were recovered for the gelatine set against 85% for the tissue set | Phantom materials with distinct spectral shapes |
| Unknown scale | Of the measured phantoms, only the agar cylinder gave FM, and its FFM and TBW were poorly determined | A measured geometry, or distinct spectra with well-known tissue properties |
| Constant phase error of ±0.3° | For the gelatine set with an unknown scale, recovery fell from 79% to 10% | Setup errors corrected to about 0.1° |
| Uncorrected setup error of 120 pF and 14 ns | For the tissue set with an unknown scale, recovery fell from 97% to 58%, and the gelatine set was not recovered | Setup error measured with precision resistors |
| Magnitude error of 17% from the electrode model | With a known scale, recovery fell from 100% to 69% for the gelatine set and from 100% to 81% for the tissue set | Electrode model validated on the same phantom |
| Spread of 10–20% in tissue properties | For the tissue set with an unknown scale, recovery fell from 98% to between 74% and 62% | Known scale or independent tissue properties |