
Figure 1:
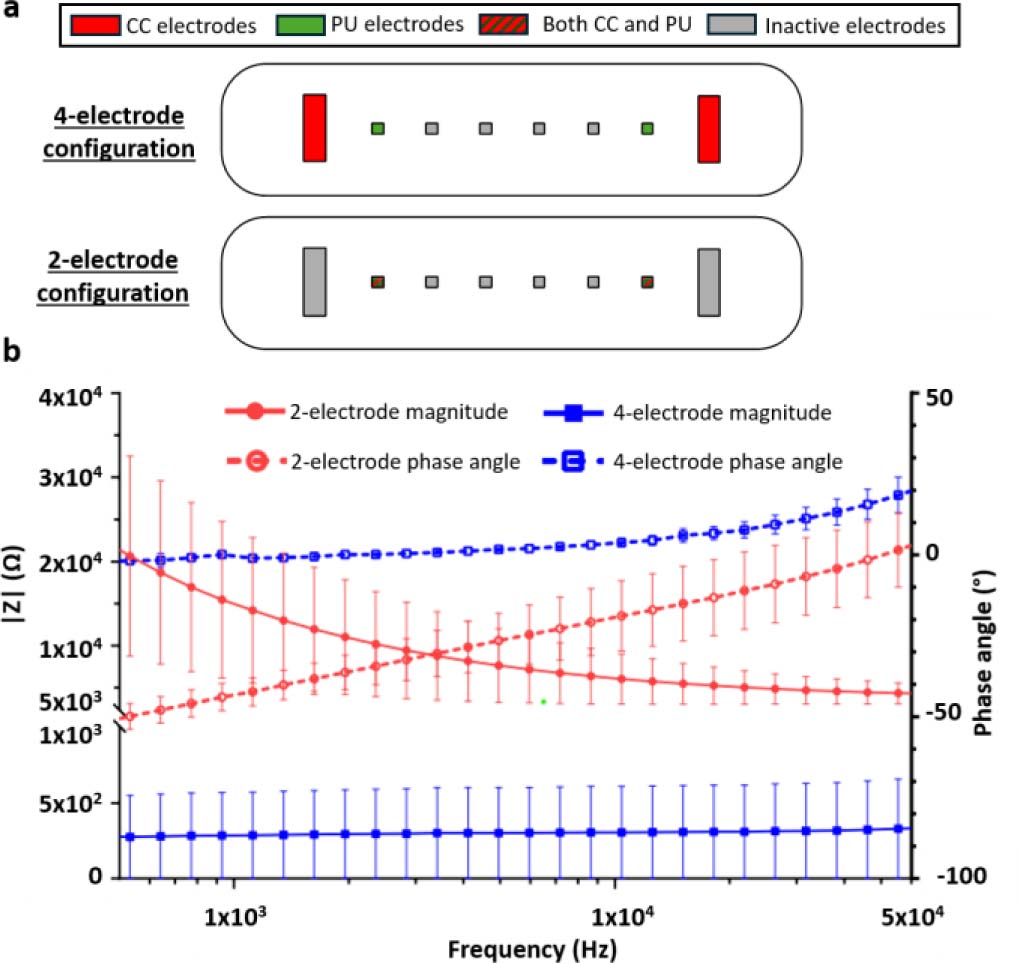
Comparison between two-electrode impedance and four-electrode transfer-impedance measurement configurations. (a) Schematic representation of the coplanar electrode layouts implemented within one tumor-on-chip culture chamber. In the four-electrode configuration, the outer current-carrying (CC) electrodes are used for current injection and the inner potential-sensing (PU) electrodes are used for voltage measurement. In the two-electrode configuration, the same electrode pair is used for both current injection and voltage sensing. Red electrodes indicate CC electrodes, green electrodes indicate PU electrodes, red/green hatched electrodes indicate electrodes used as both CC and PU electrodes, and grey electrodes indicate inactive electrodes. (b) Impedance magnitude and phase spectra measured in 1X phosphate-buffered saline (PBS) using the two-electrode impedance and four-electrode transfer-impedance configurations. The two-electrode configuration exhibits pronounced low-frequency dispersion due to electrode/electrolyte polarization, whereas the four-electrode configuration strongly reduces this contribution and provides a quasi-frequency-independent impedance plateau above approximately 2 kHz. In the four-electrode configuration, phase values remain within ±10° above approximately 2 kHz. The small positive phase observed at higher frequencies is consistent with tetrapolar transfer-impedance measurements and should not be interpreted as an inductive response of the electrolyte. Data are shown as mean ± SD from three channels measured on each of two independent devices (N = 2, n = 6).
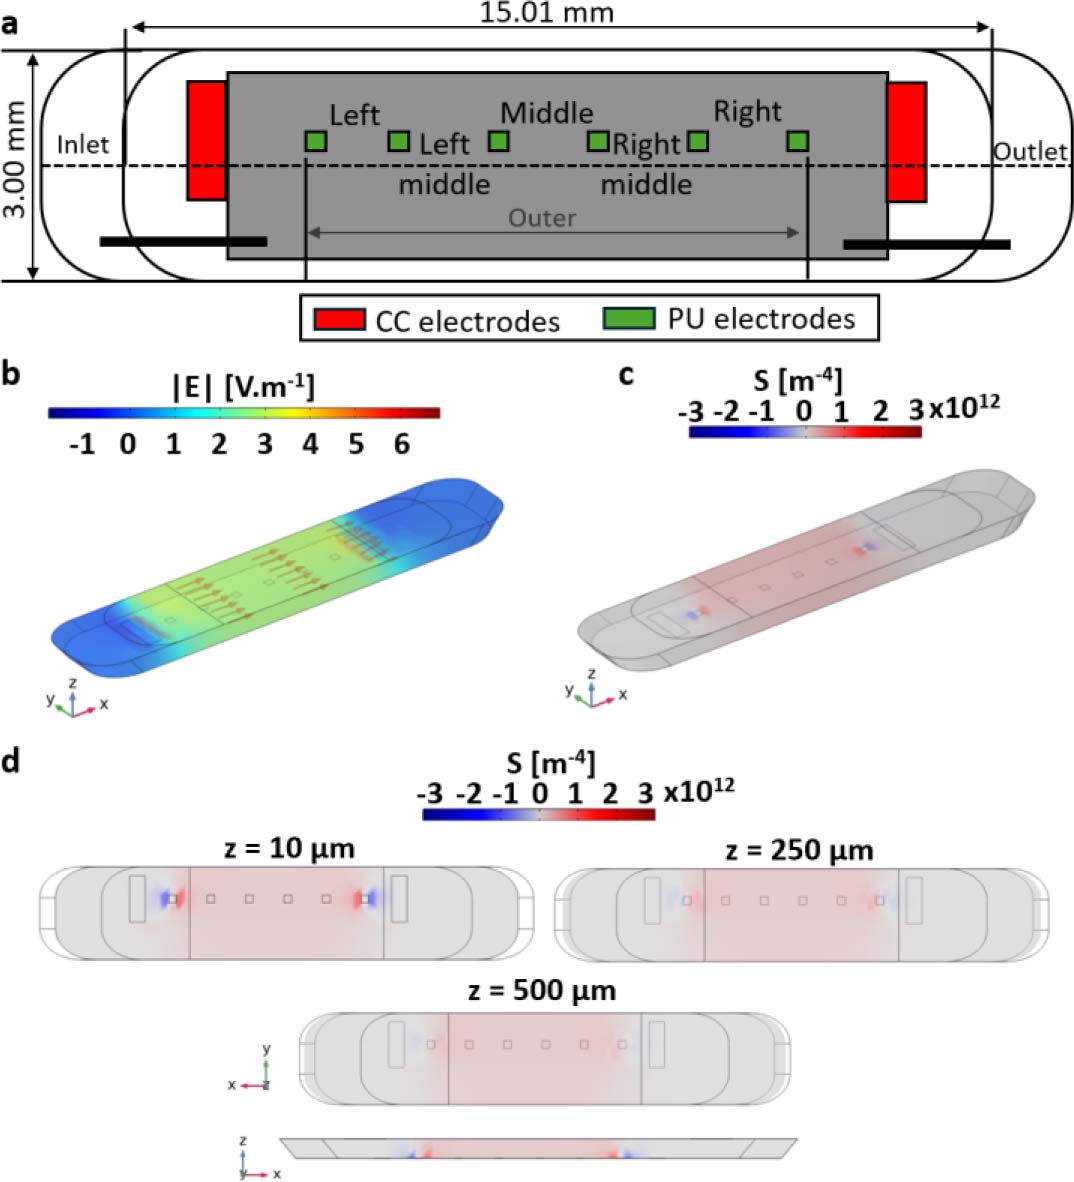
Figure 2:
Sensitivity-field analysis of the four-electrode transfer-impedance measurement in a three-dimensional culture chamber. (a) Electrode geometry used in the numerical model. Red electrodes indicate current-carrying (CC) electrodes and green electrodes indicate potential-sensing (PU) electrodes. The layout comprises eight electrodes: two rectangular CC electrodes (1.50 × 0.50 mm) and six square PU electrodes (0.25 × 0.25 mm). All dimensions are given in mm. (b) Simulated electric-field magnitude distribution within the culture chamber. (c) Normalized sensitivity-field distribution highlighting the dominant contribution of the central chamber volume. (d) Sensitivity-field maps [m−4] in the xy plane at three vertical positions (z = 10, 250, and 500 μm), together with a representation along the z direction, illustrating the progressive decrease in sensitivity with increasing distance from the coplanar electrode plane and the reduced sensitivity to structures located in the upper part of the 3D culture volume.
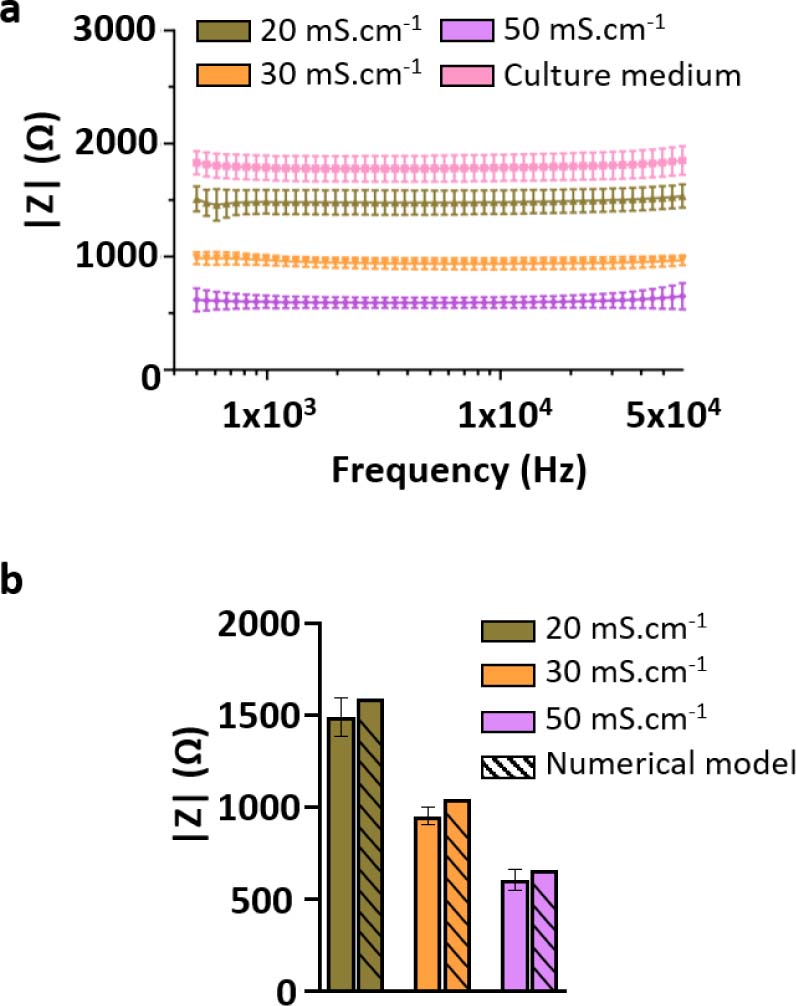
Figure 3:
Electrical calibration and validation of the bioimpedance measurement system using reference liquids. (a) Impedance spectra measured for electrical conductivity standard solutions (20, 30, and 50 mS·cm−1) and culture medium (1X DMEM) at room temperature (22.3 °C), using the selected four-electrode configuration. The spectra exhibit distinct and non-overlapping impedance magnitudes across the investigated frequency range (500 Hz – 60 kHz), with impedance inversely proportional to solution conductivity. (b) Comparison between experimentally measured impedance values and numerical predictions obtained from three-dimensional COMSOL simulations for the same conductivity standards. Experimental values correspond to the frequency-averaged impedance magnitude, |Zmean|, computed over 500 Hz – 60 kHz, while numerical values were extracted from the simulated voltage difference between sensing electrodes. The relative deviation between experimental and numerical values remains below 10%, supporting the quantitative reliability of the impedance measurement system. Data are presented as mean ± SD from three independent devices and eight measured channels per device (N = 3, n = 24).
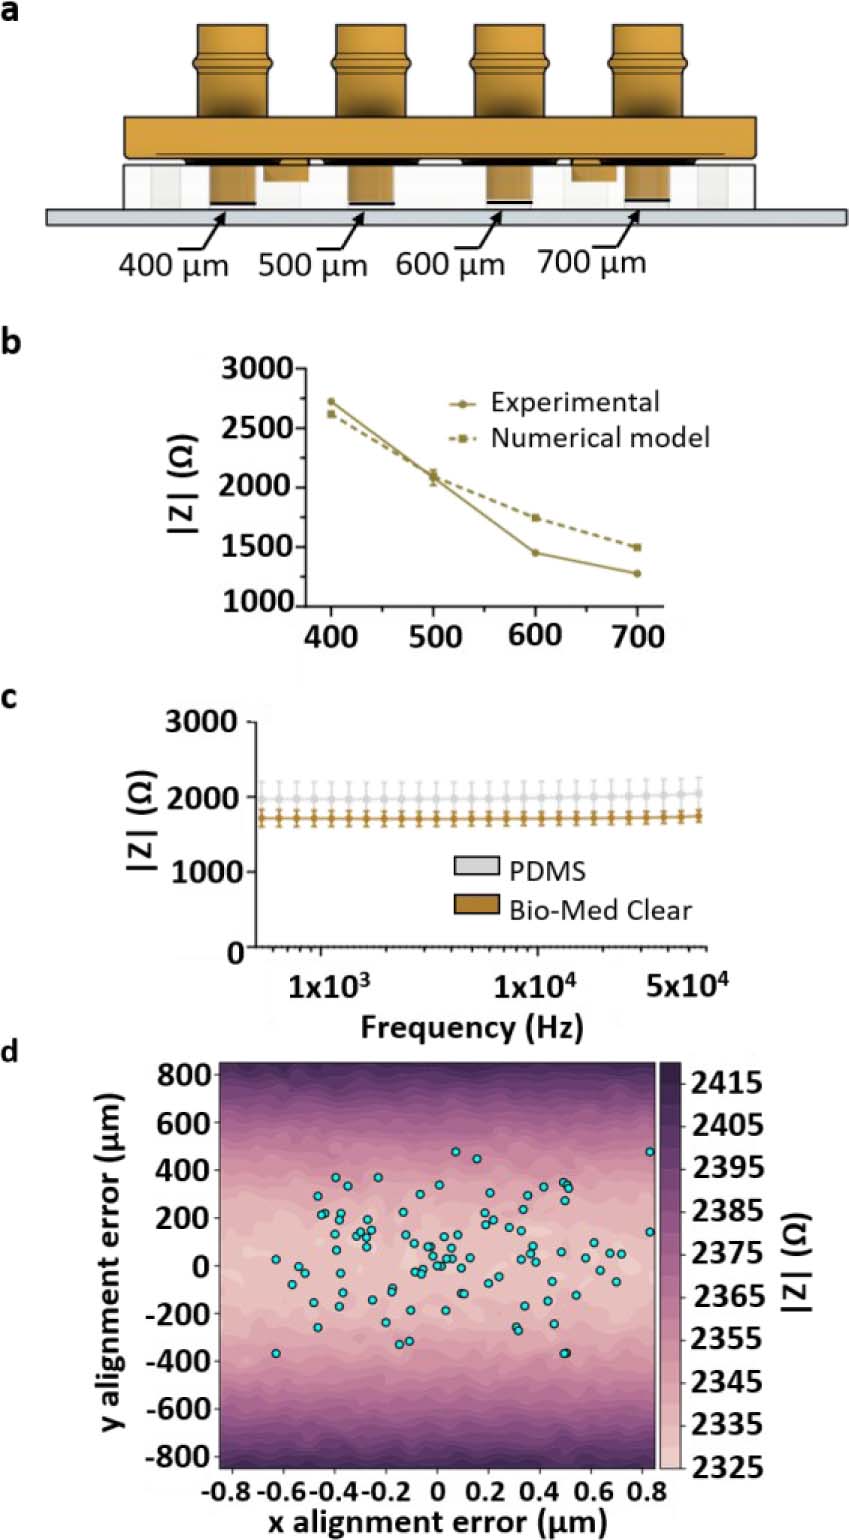
Figure 4:
Influence of geometrical parameters on impedance measurements. (a) Schematic representation of the variable-height chamber configuration. Rigid closing caps were used to define four culture chamber heights within the same microfluidic system: 400, 500, 600, and 700 μm. (b) Experimental and numerical impedance magnitudes measured at 10 kHz as a function of culture chamber height. Increasing chamber height resulted in a systematic decrease in |Z|, in agreement with COMSOL predictions. Data are presented as mean ± SD from two independent devices and four measured chambers/channels (N = 2, n = 4). (c) Impedance magnitude spectra measured in 1X PBS using either a PDMS cap or a rigid 3D-printed Bio-Med Clear cap at room temperature. The two cap materials produced similar mean impedance spectra, indicating that cap material had only a minor influence on the average measured signal compared with chamber height. However, the rigid 3D-printed cap reduced measurement variability, consistent with improved mechanical control of chamber height compared with the softer PDMS cap. (d) Influence of lateral misalignment between the PDMS microfluidic layer and the electrode substrate on impedance magnitude. The color map represents simulated impedance magnitude as a function of x- and y-offsets. Dots indicate experimentally measured alignment offsets. Alignment offsets were measured from eight independent microfluidic devices and 64 culture chambers/channels (N = 8, n = 64).
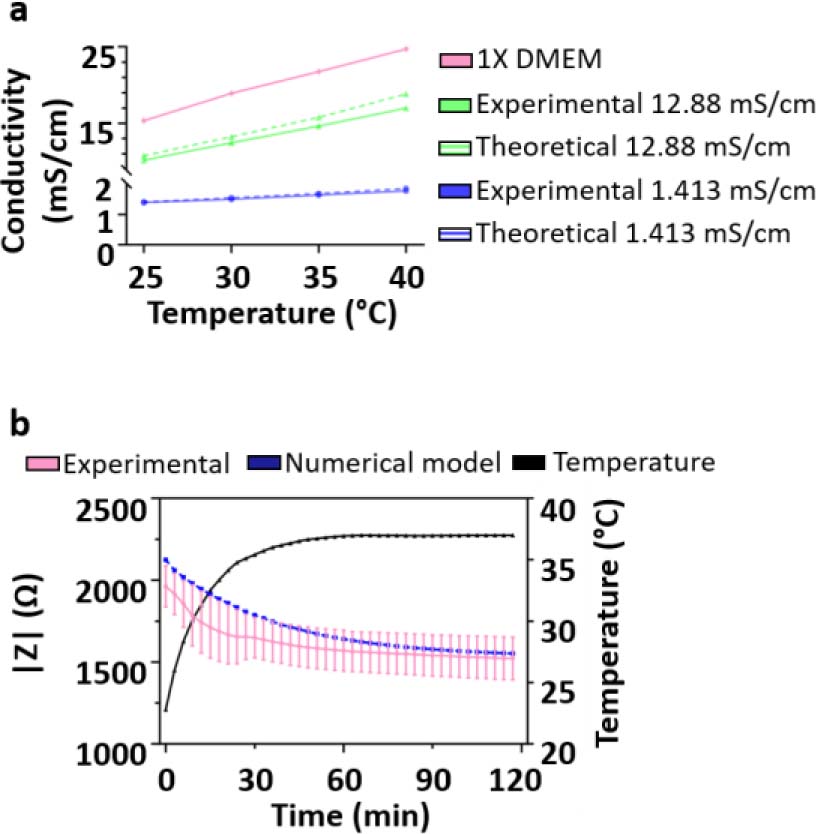
Figure 5:
Temperature-induced drift of impedance measurements and stabilization time. (a) Electrical conductivity of the culture medium as a function of temperature, showing an approximately linear increase over the investigated range. Dotted lines represent the theoretical change in electrical conductivity values as given by the manufacturer. (b) Time-resolved impedance magnitude measured at 10 kHz following placement of the device in a 37 °C incubator. Experimental data are compared with numerical modelling incorporating temperature-dependent conductivity, illustrating the transient thermal equilibration and subsequent stabilization of the impedance signal. Data are presented as mean ± SD from two independent devices and four measured channels per device (N = 2, n = 8).
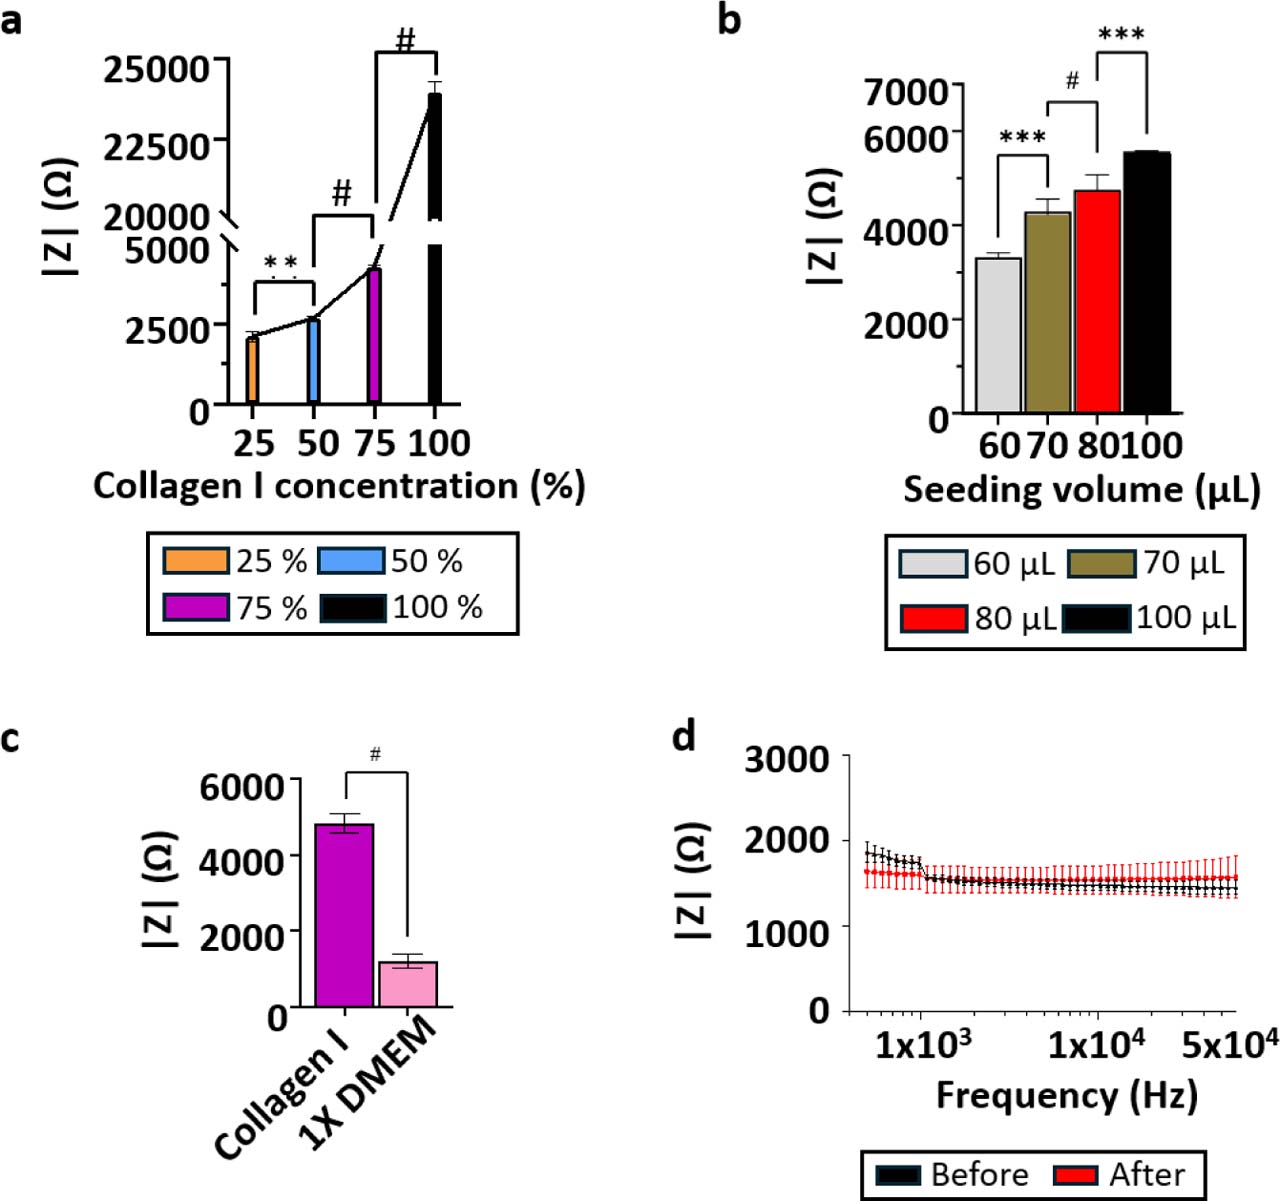
Figure 6:
Electrical characterization of acellular collagen I hydrogels. (a) Relationship between collagen I concentration and impedance magnitude measured at 10 kHz at constant loaded volume. Collagen I/1X DMEM mixtures contained 25%, 50%, 75%, and 100% (v/v) collagen I stock solution, corresponding to final collagen I concentrations of 0.93, 1.86, 2.79, and 3.72 mg·mL−1, respectively. Data are presented as mean ± SD from three independent devices and six measured chambers/channels (N = 3, n = 6). (b) Relationship between loaded collagen I hydrogel volume and impedance magnitude measured at 10 kHz in a fixed chamber geometry, highlighting the influence of gel loading and compression on the measured signal. Data are presented as mean ± SD from three independent devices and six measured chambers/channels (N = 3, n = 6). (c) Comparison of impedance magnitude between culture medium and collagen I hydrogel, illustrating the higher impedance associated with the collagen matrix. Data are presented as mean ± SD from three independent devices and twelve measured chambers/channels (N = 3, n = 12). (d) Impedance measurements of a 20 mS·cm−1 conductivity standard before and after collagen loading and electrode cleaning, demonstrating measurement robustness and low signal variability. Data are presented as mean ± SD from three independent devices and twelve measured chambers/channels (N = 3, n = 12).
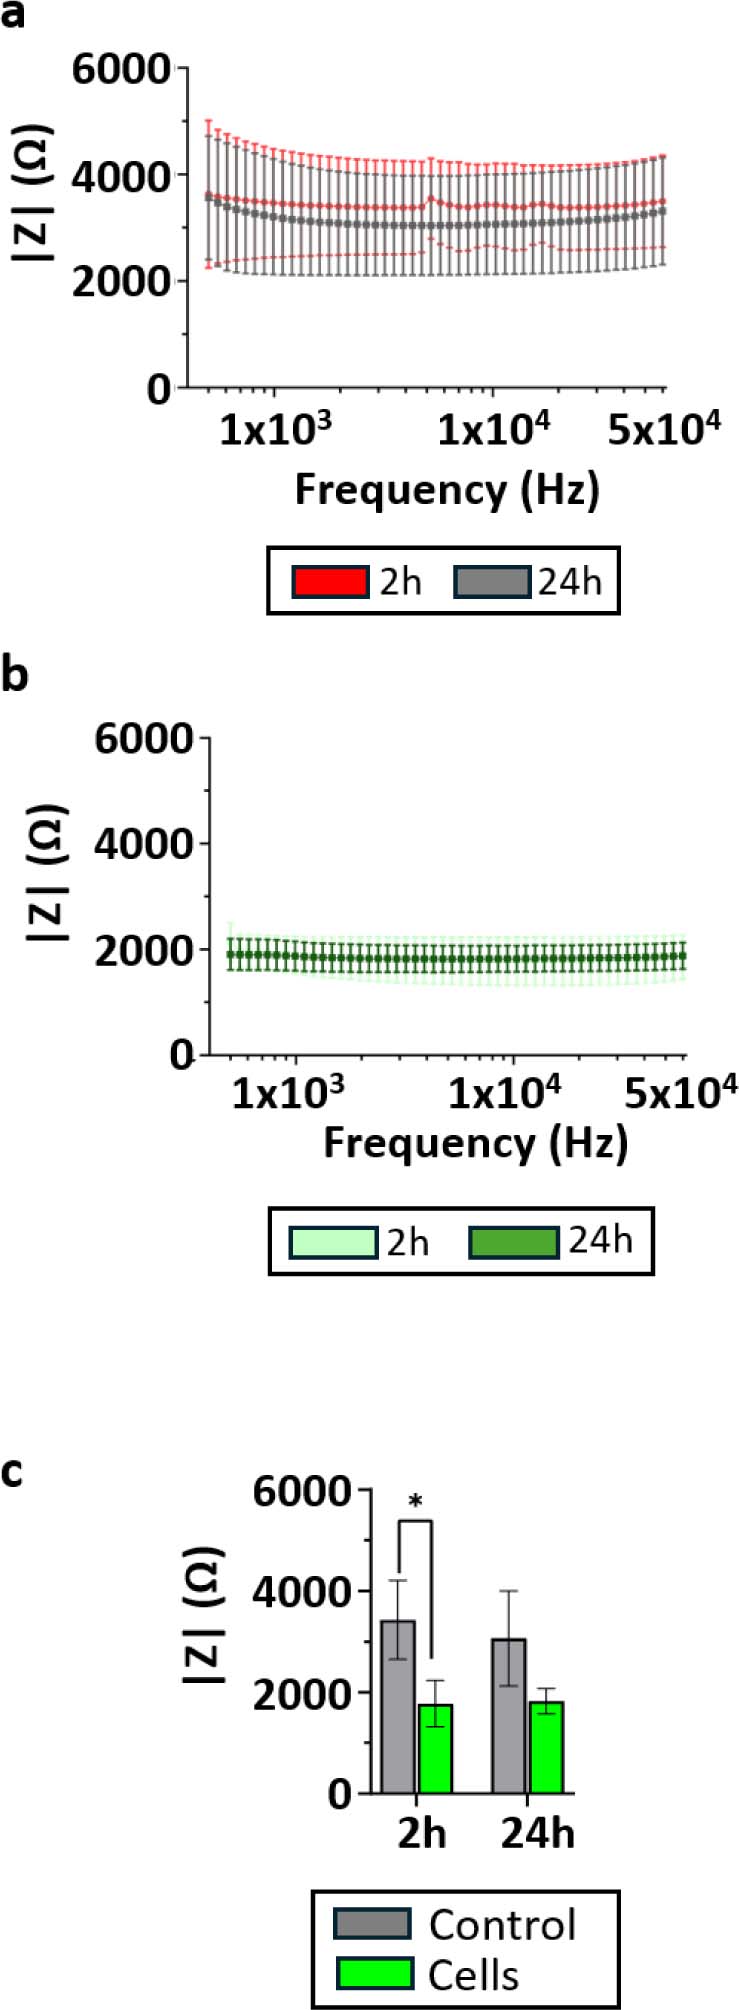
Figure 7:
Detection of cells embedded in 3D collagen I hydrogels by bioimpedance measurements. (a) Impedance magnitude spectra measured for acellular collagen I hydrogels at 2 h and 24 h after gel polymerization. (b) Impedance magnitude spectra measured for HPAC-eGFP cell-laden collagen I hydrogels at 2 h and 24 h after gel polymerization. (c) Impedance magnitude extracted at 10 kHz for acellular and cell-laden collagen I hydrogels, showing a clear separation between the two conditions at both time points. Data are presented as mean ± SD from three independent devices and six measured chambers/channels (N = 3, n = 6). Comparisons between 2 and 24 h within each culture condition were performed using paired two-tailed t-tests. Comparisons between acellular and cell-laden hydrogels at each time point were performed using unpaired two-tailed t-tests. p < 0.05.
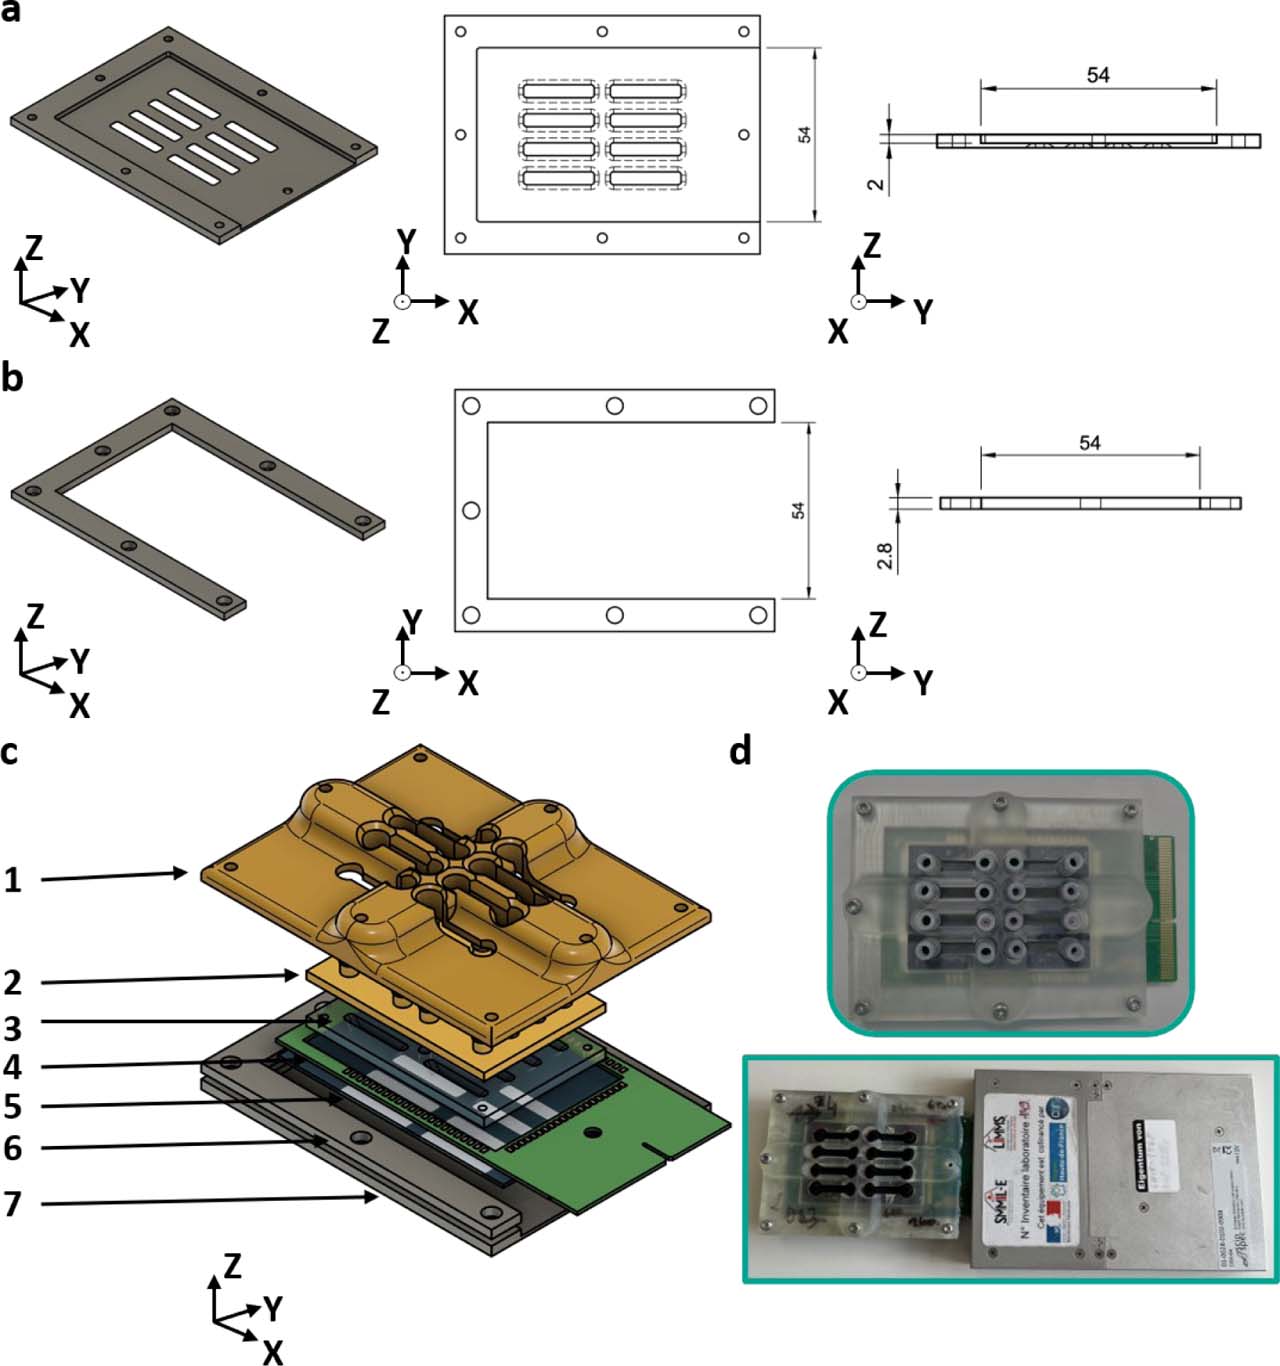
Supplementary Figure S1.
Closing system to accommodate the PCB. Both the (a) bottom aluminum closing plate and (b) aluminum wedge include openings that allow the PCB to protrude from the closing system. (c) Exploded view of the microfluidic chip: 1: 3D-printed reinforced top closing plate 2: 3D-printed cap 3: PDMS bottom 4: PCB 5: glass substrate with electrode pattern 6: aluminum wedge 7: aluminum bottom closing plate. (d) Closed microfluidic chip with protruding PCB and connection to the impedance meter.
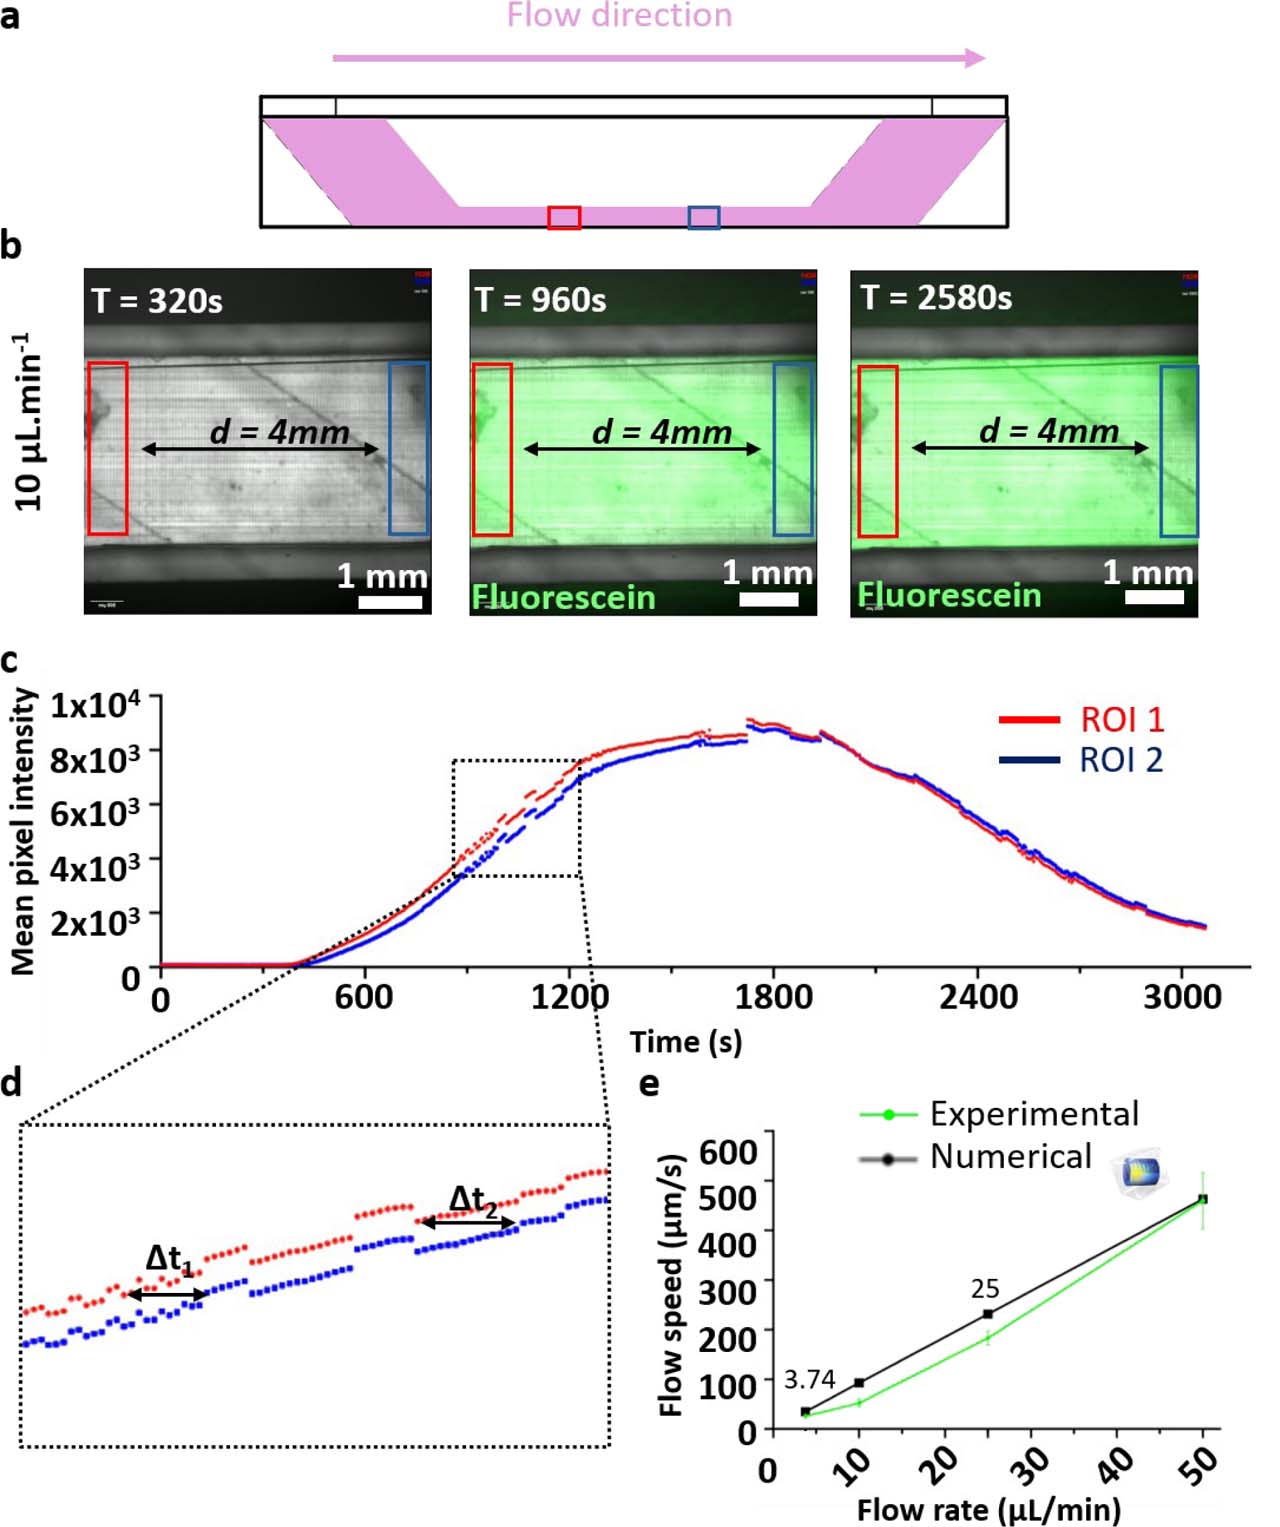
Supplementary Figure S2.
Verification of flow rates in the microfluidic circuit. (a) Schematic representation of the culture chamber showing the flow direction and the positions of the two regions of interest (ROIs), separated by 4 mm. (b) Representative fluorescence images acquired during the passage of a fluorescein bolus at an imposed flow rate of 10 μL·min−1. (c) Fluorescence intensity time traces extracted from the two ROIs. (d) Magnified view of the rising phase of the fluorescence signals, showing the time delays (Δt1 and Δt2) used to estimate the mean flow velocity. (e) Comparison between experimentally measured flow velocities and numerical predictions as a function of the imposed pump flow rate. Error bars denote standard deviation (n = 3).
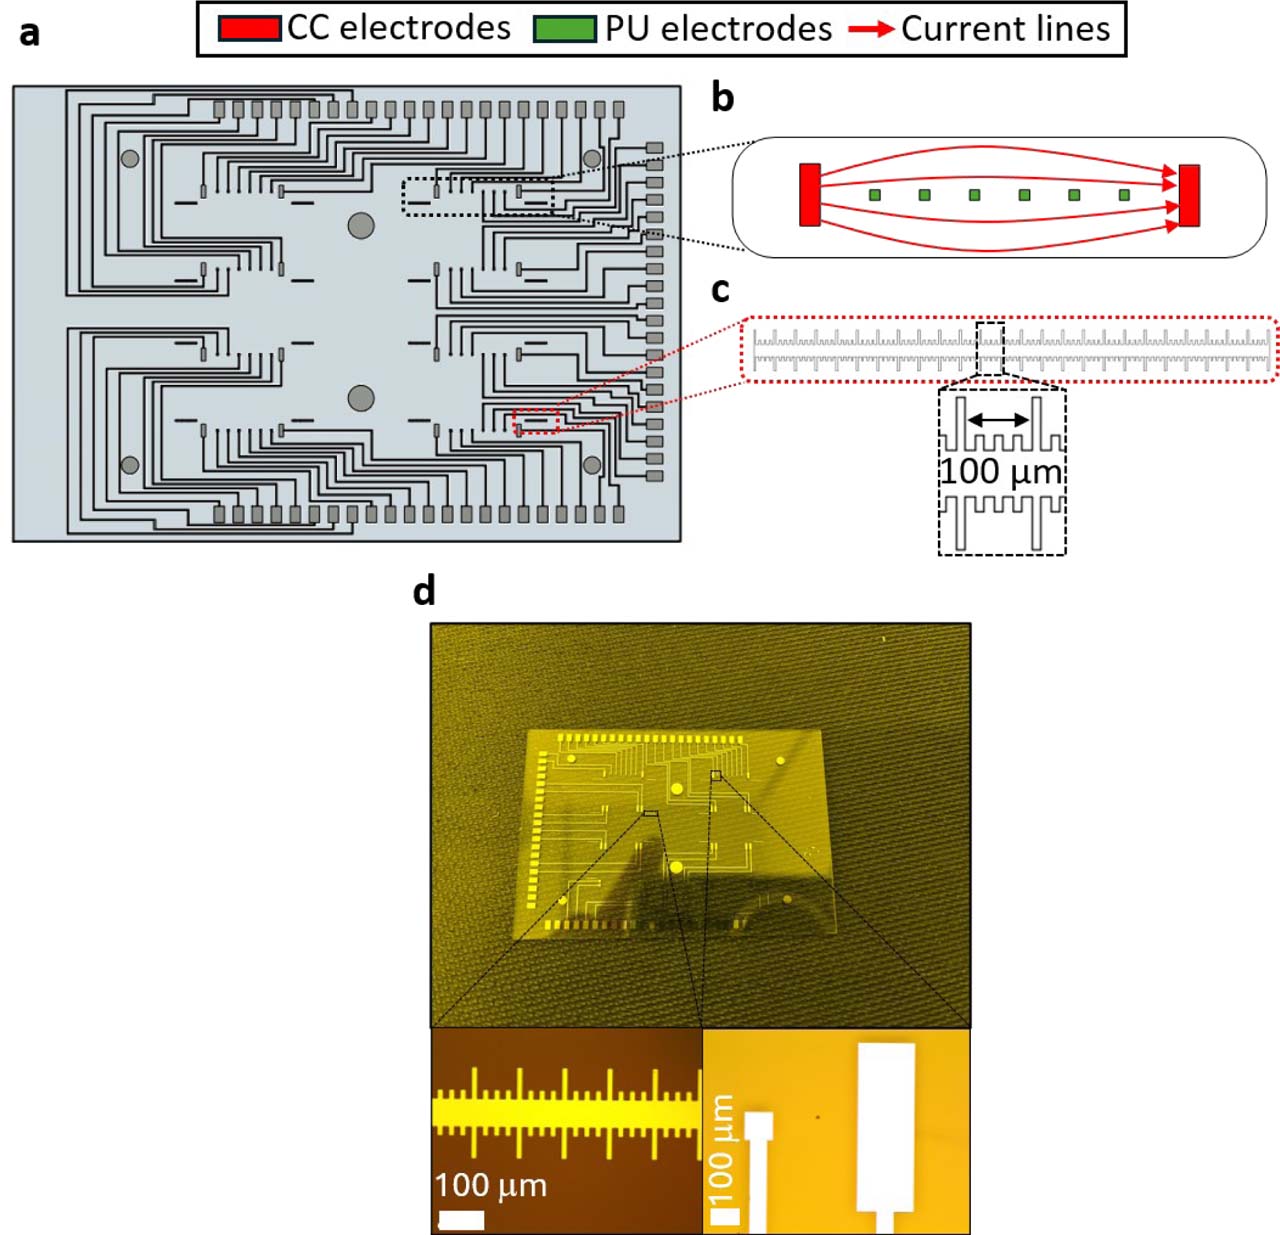
Supplementary Figure S3.
Microelectrode biosensor design. (a) Layout of the complete microelectrode array, comprising 64 individually addressable electrodes. (b) Magnified view of one culture chamber region, showing the eight electrodes allocated to each chamber to allow flexible two- and four-electrode impedance measurement configurations. (c) Integrated alignment ruler included in the electrode design to assess the positioning of the PDMS bottom layer relative to the electrode array. (d) Fabricated Ti/Pt electrodes and alignment rulers obtained by bilayer lift-off lithography.
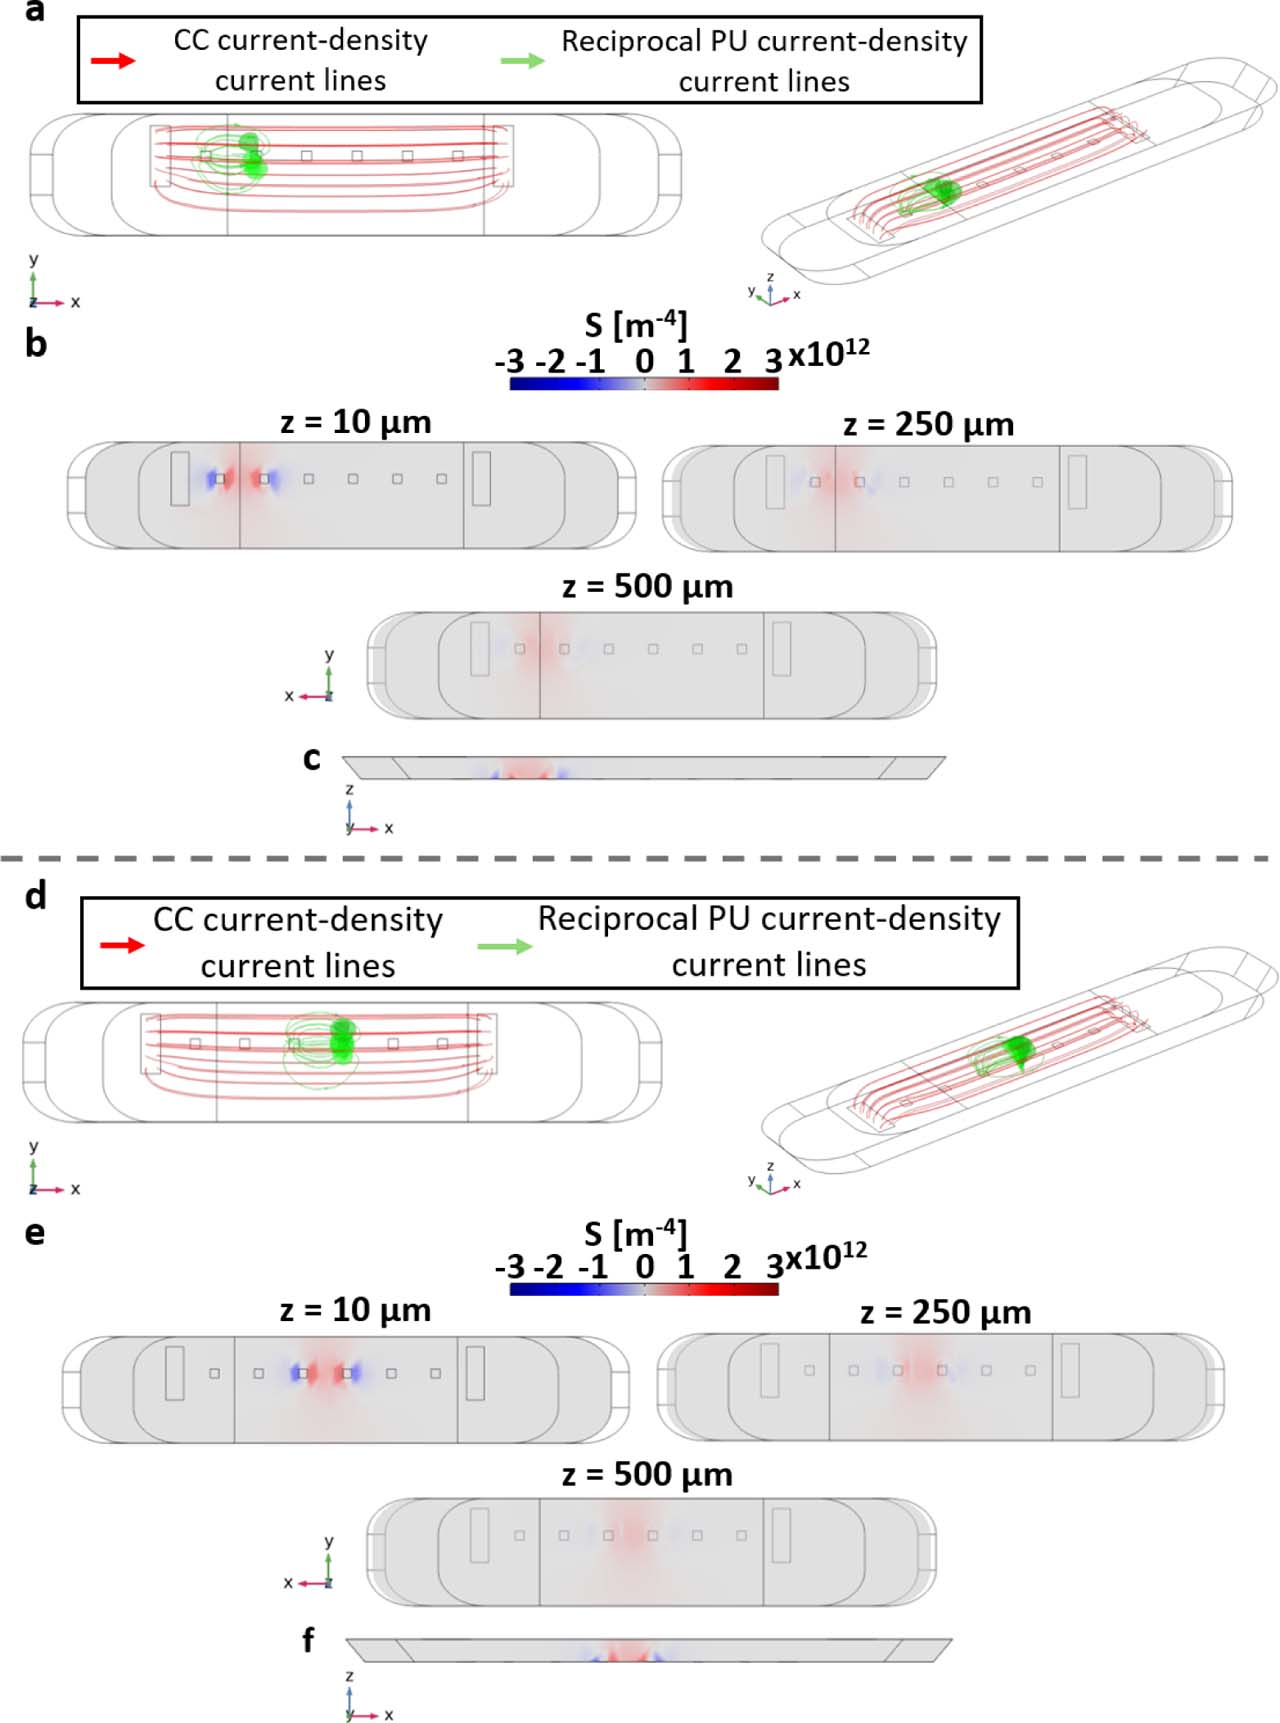
Supplementary Figure S4.
Complementary sensitivity-field analysis for alternative potential-sensing electrode pairs in the 3D culture chamber. (a–c) Sensitivity-field simulation performed using the leftmost potential-sensing electrode pair. (d–f) Sensitivity-field simulation performed using the middle potential-sensing electrode pair. (a,d) Current-density streamlines shown in top and three-dimensional views. Red streamlines correspond to the current-injection field generated by the current-carrying (CC) electrodes, whereas green streamlines correspond to the reciprocal field associated with the selected potential-sensing (PU) electrode pair. (b,e) Sensitivity-field heatmaps in the xy plane at three z-positions within the chamber: 10, 250, and 500 μm above the electrode plane. (c,f) Cross-sectional sensitivity-field maps in the vertical direction, illustrating the decrease in sensitivity with increasing distance from the coplanar electrode plane.
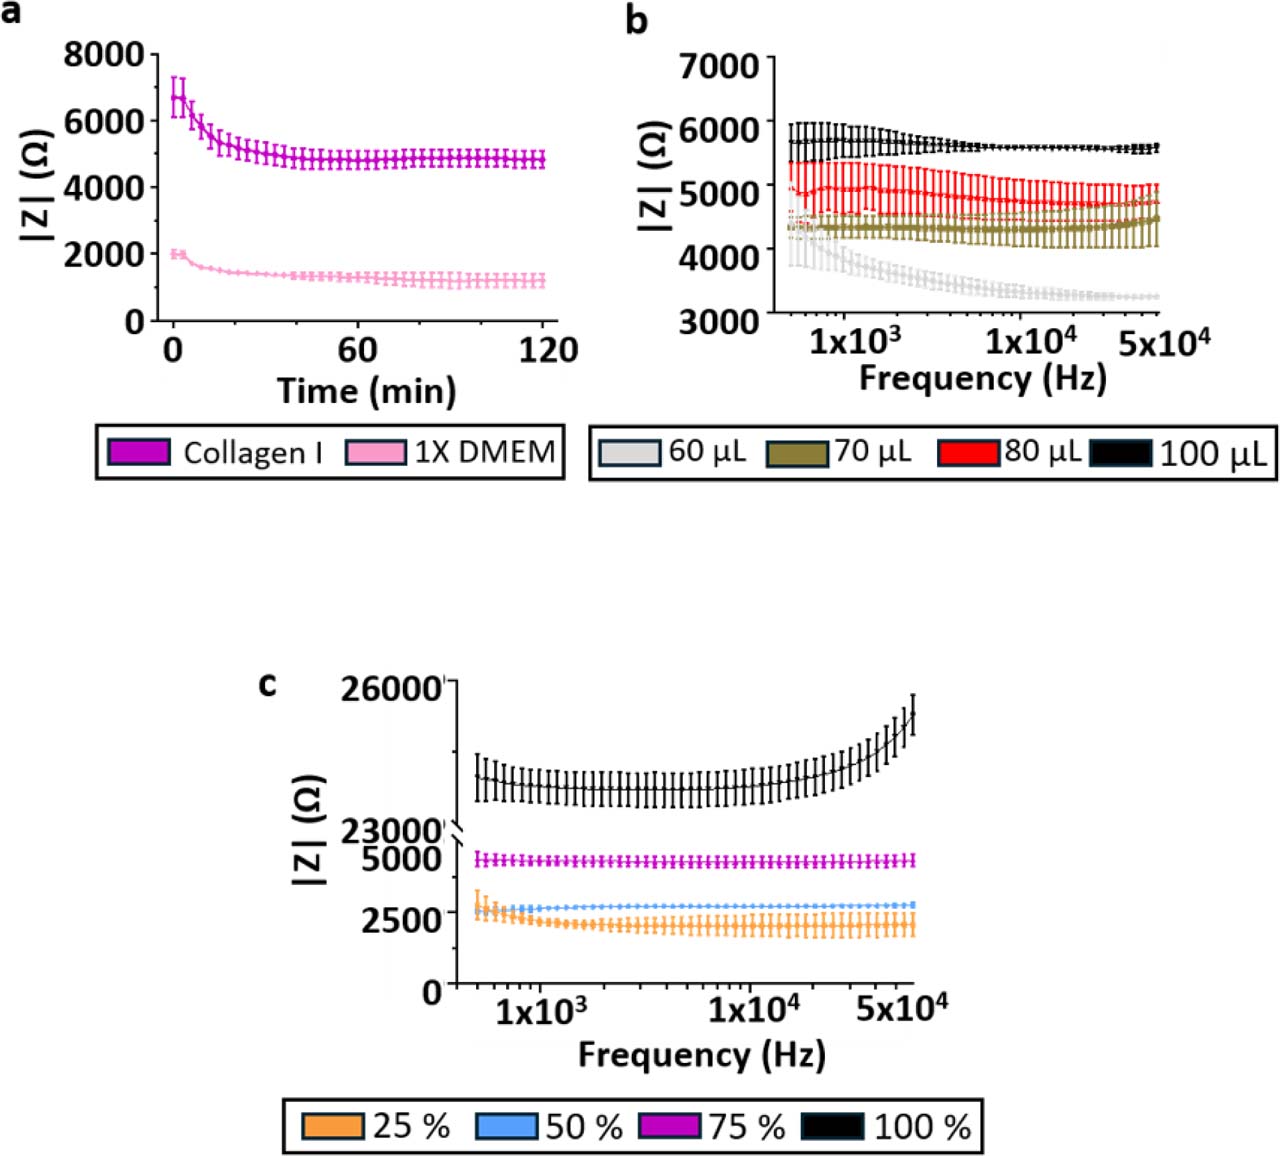
Supplementary Figure S5.
Supplementary impedance measurements of collagen I hydrogels. Additional measurements supporting the electrical characterization of collagen I hydrogels presented in Figure 6. (a) Time−resolved impedance magnitude measured for 1X DMEM culture medium and collagen I hydrogel, illustrating the stabilization of the electrical signal after loading (N = 3, n = 12). (b) Frequency-resolved impedance magnitude spectra measured under different collagen I loading volumes, showing the effect of hydrogel loading on the measured impedance (N = 3, n = 6). (c) Frequency-resolved impedance magnitude spectra measured for increasing collagen I concentrations, confirming the concentration-dependent increase in impedance and the predominantly resistive behavior of collagen I hydrogels over the investigated frequency range (N = 3, n = 6). Data are presented as mean ± standard deviation.
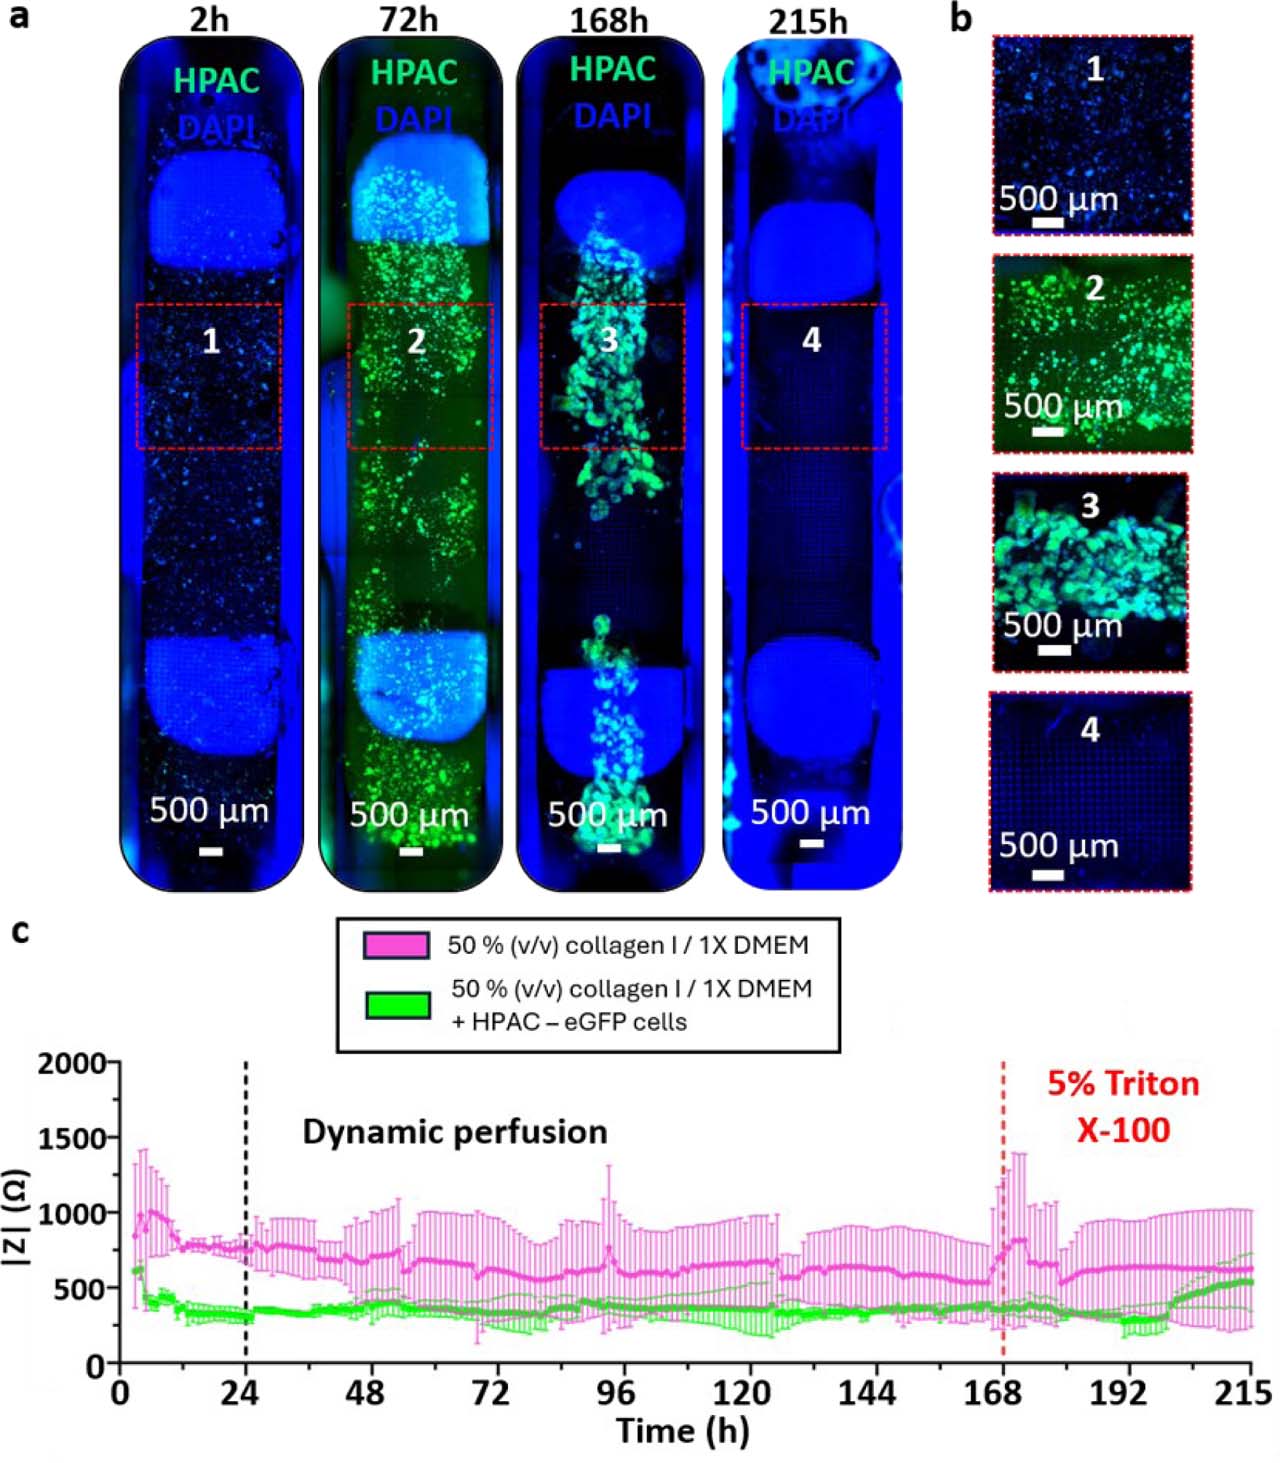
Supplementary Figure S6.
Time-resolved impedance measurements during perfused 3D collagen I culture. (a) Full channel imaging of HPAC-eGFP cells (green) grown in a 3D collagen I/1X DMEM for seven days and exposed to 5% (v/v) Triton X-100 for two days at z = 400 μm. Nuclei were stained with DAPI (blue). (b) Channel zooms reveal cell growth in HPAC-eGFP spheroids as well as the 3D nature of the culture for the whole duration of the culture. (c) Impedance magnitude measured at 10 kHz using the outer potential-sensing electrode pair during continuous perfusion of 3D collagen I hydrogels containing HPAC-eGFP cells. A persistent difference in impedance magnitude was observed between cell-laden and acellular collagen hydrogels. Following thermal equilibration, impedance values remained relatively stable during the proliferation phase, with no reproducible temporal variation that could be unambiguously attributed to gradual cellular growth. In contrast, perfusion with 5% (v/v) Triton X-100 induced an increase in impedance toward the acellular collagen I control level, consistent with a strong endpoint perturbation of the cellular compartment. Data correspond to one representative device (N = 1, n = 2); error bars denote standard deviation.