
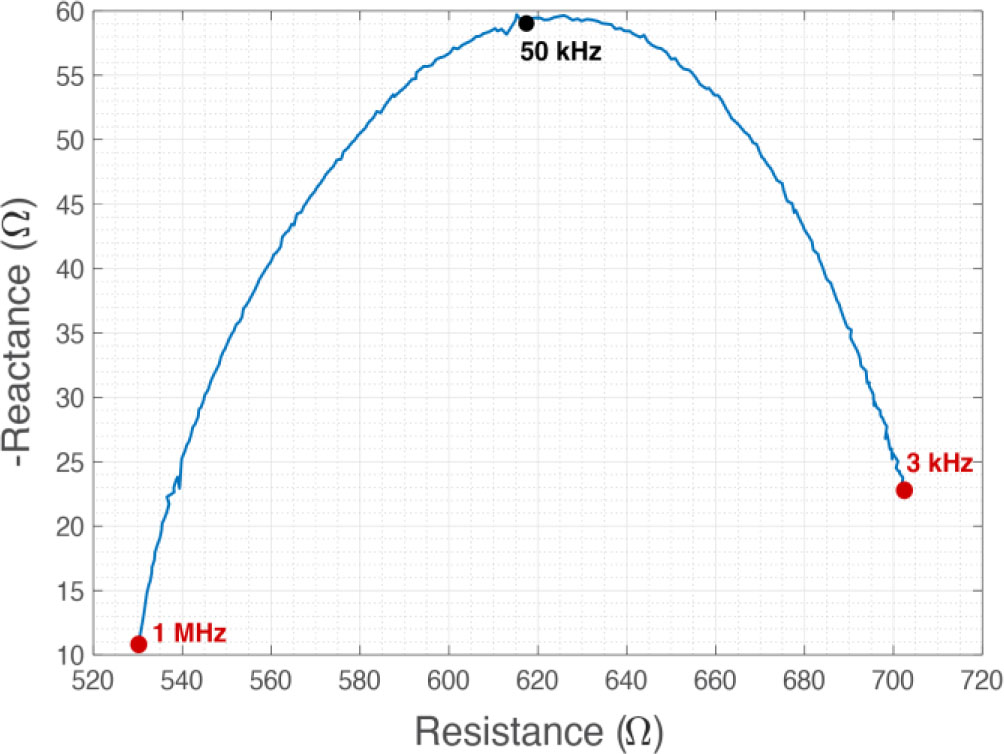
Figure 1.
Sample hand-to-foot multi-frequency bioimpedance collected from a healthy adult. Red markers highlight the low (3 kHz) and high (1 MHz) frequency datapoints. The black marker highlights 50 kHz data, which is the specific frequency analyzed in this study.
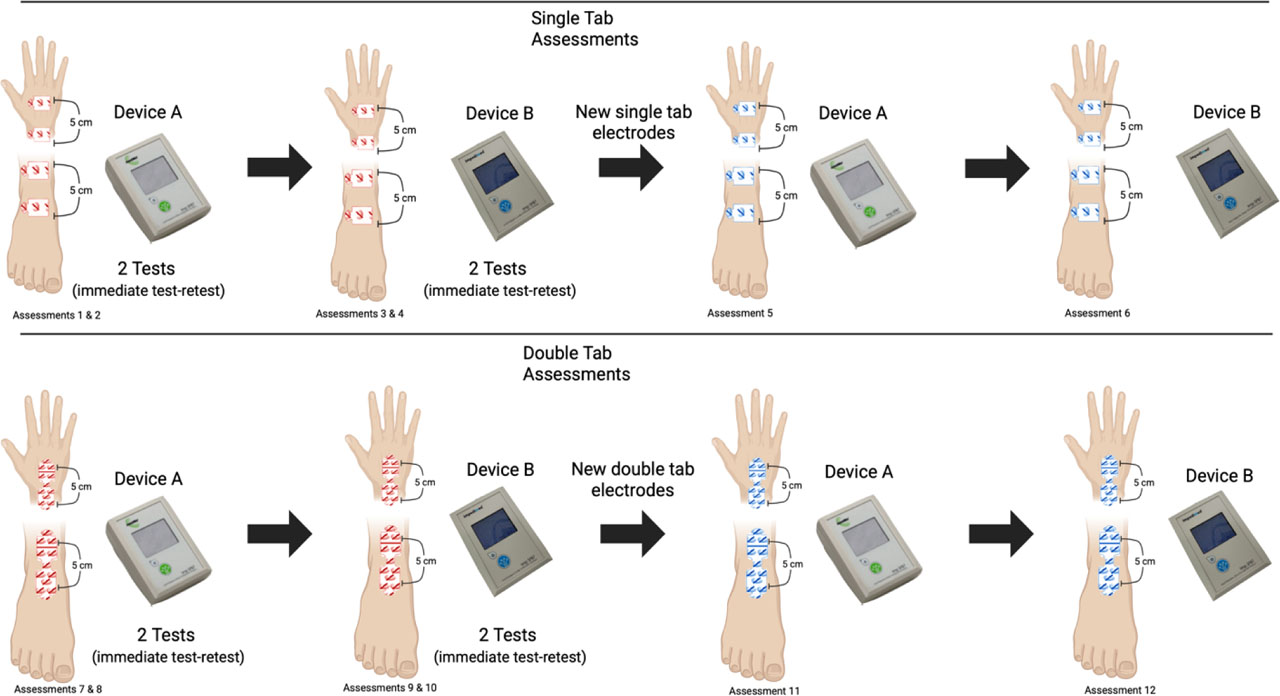
Figure 2.
Study design of the twelve assessments utilizing single- and double-tab electrodes and the two different devices (i.e., device A and device B).
Table 1.
A summary of the twelve comparisons utilizing single-tab (ST) and double-tab (DT) electrodes and the two different ImpediMed SFB7 analyzers (i.e., device A and device B). The colors in the table correspond to those displayed in Figures 3 – 8.
| Trials | Electrode Type(s) | Description |
| 1 v 2 | ST | Test-retest with device A; intra-analyzer error |
| 1 v 3 | ST | Comparing devices A and B; inter-analyzer error |
| 3 v 4 | ST | Test-retest with device B; intra-analyzer error |
| 1 v 5 | ST | Comparing different sets of ST electrodes with device A; error from switching electrode sets |
| 3 v 6 | ST | Comparing different sets of ST electrodes with device B; error from switching electrode sets |
| 7 v 8 | DT | Test-retest with device A; intra-analyzer error |
| 7 v 9 | DT | Comparing devices A and B; inter-analyzer error |
| 9 v 10 | DT | Test-retest with device B; intra-analyzer error |
| 7 v 11 | DT | Comparing different sets of DT electrodes with device A; error from switching electrode sets |
| 9 v 12 | DT | Comparing different sets of DT electrodes with device B; error from switching electrode sets |
| 1 v 7 | ST & DT | Comparison of ST and DT electrodes for device A; error from switching electrode set/type |
| 3 v 9 | ST & DT | Comparison of ST and DT electrodes for device B; error from switching electrode set/type |
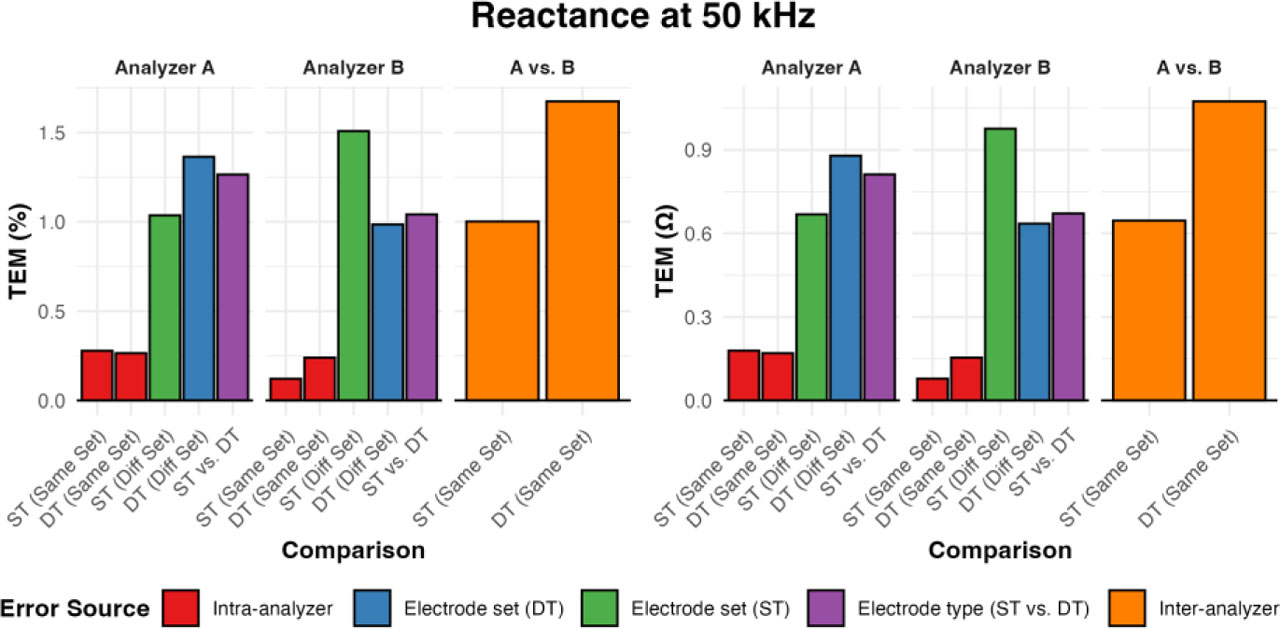
Figure 3.
The technical error of the measurement (TEM) for reactance (Xc50) expressed in absolute (Ω) and relative (%) terms for each assessment, intra-analyzer in red (1 v. 2, 3 v. 4, 7 v. 8, 9 v. 10), different set of double-tab (DT) electrodes in blue (7 v. 11 and 9 v. 12), different set of single-tab (ST) electrodes in green (1 v. 5 and 3 v. 6), comparison of the different electrode types single vs double-tab electrodes in purple (1 v. 7 and 3 v. 9), and inter-analyzer in orange (7 v. 9 and 1 v. 3).
Table 2.
The absolute and relative technical error of the measurement for the raw bioelectrical impedance variables – Reactance (Xc50), Resistance (R50), Phase Angle (φ). See Figure 2 for assessment definitions.
| Assessment Comparison | Reactance (Xc50) | Resistance (R50) | Phase Angle (φ) | |||
|---|---|---|---|---|---|---|
| Sample Mean ± SD 64.3 ± 8.6 Ω | Sample Mean ± SD 557.4 ± 100.6 Ω | Sample Mean ± SD 6.7 ± 1.0◦ | ||||
| Abs. TEM (Ω) | Rel. TEM (%) | Abs. TEM (Ω) | Rel. TEM (%) | Abs. TEM (◦) | Rel TEM (%) | |
| 1 v 2 | 0.18 | 0.28 | 0.30 | 0.05 | 0.02 | 0.27 |
| 1 v 3 | 0.65 | 1.00 | 1.37 | 0.25 | 0.05 | 0.8 |
| 3 v 4 | 0.08 | 0.12 | 0.26 | 0.05 | 0.01 | 0.11 |
| 1 v 5 | 0.67 | 1.04 | 6.59 | 1.19 | 0.06 | 0.95 |
| 3 v 6 | 0.98 | 1.51 | 6.37 | 1.15 | 0.09 | 1.31 |
| 7 v 8 | 0.17 | 0.27 | 0.31 | 0.06 | 0.02 | 0.24 |
| 7 v 9 | 1.07 | 1.68 | 1.19 | 0.21 | 0.09 | 1.38 |
| 9 v 10 | 0.15 | 0.24 | 0.62 | 0.11 | 0.02 | 0.24 |
| 7 v 11 | 0.89 | 1.36 | 6.37 | 1.13 | 0.09 | 1.33 |
| 9 v 12 | 0.63 | 0.98 | 6.34 | 1.13 | 0.08 | 1.13 |
| 1 v 7 | 0.81 | 1.27 | 7.80 | 1.40 | 0.11 | 1.64 |
| 3 v 9 | 0.67 | 1.04 | 7.92 | 1.42 | 0.10 | 1.45 |
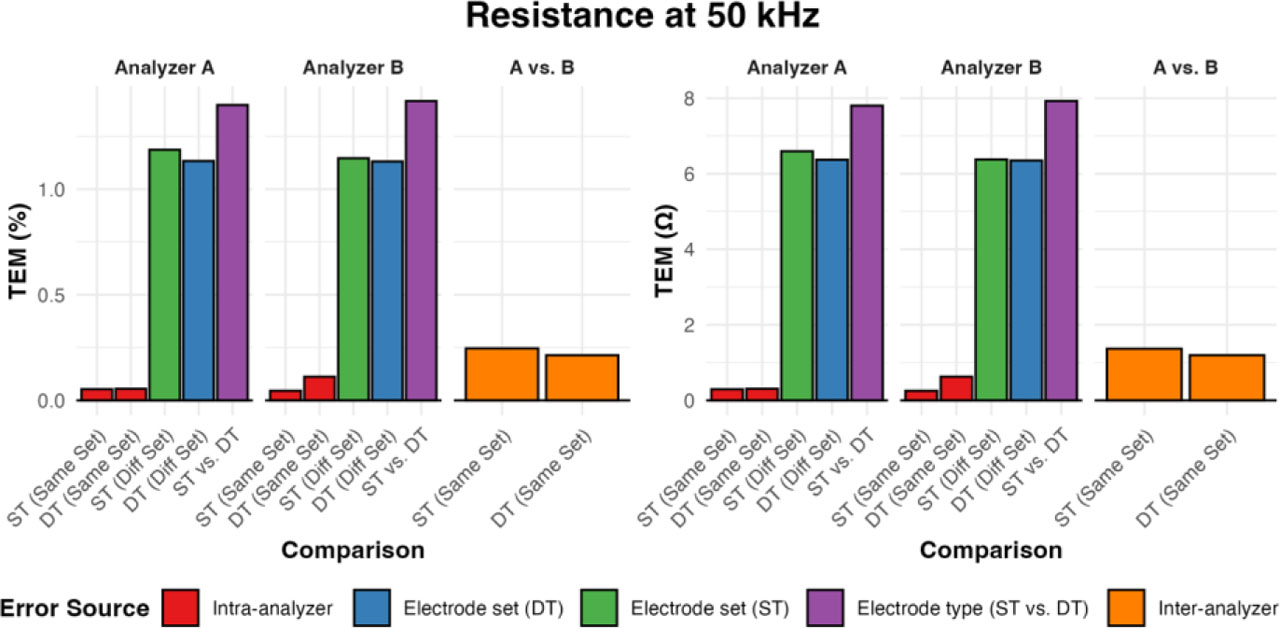
Figure 4.
The technical error of the measurement (TEM) for resistance (R50) expressed in absolute (Ω) and relative (%) terms for each assessment, intra-analyzer in red (1 v. 2, 3 v. 4, 7 v. 8, 9 v. 10), different set of double-tab (DT) electrodes in blue (7 v. 11 and 9 v. 12), different set of single-tab (ST) electrodes in green (1 v. 5 and 3 v. 6), comparison of the different electrode types single vs double-tab electrodes in purple (1 v. 7 and 3 v. 9), and inter-analyzer in orange (7 v. 9 and 1 v. 3).
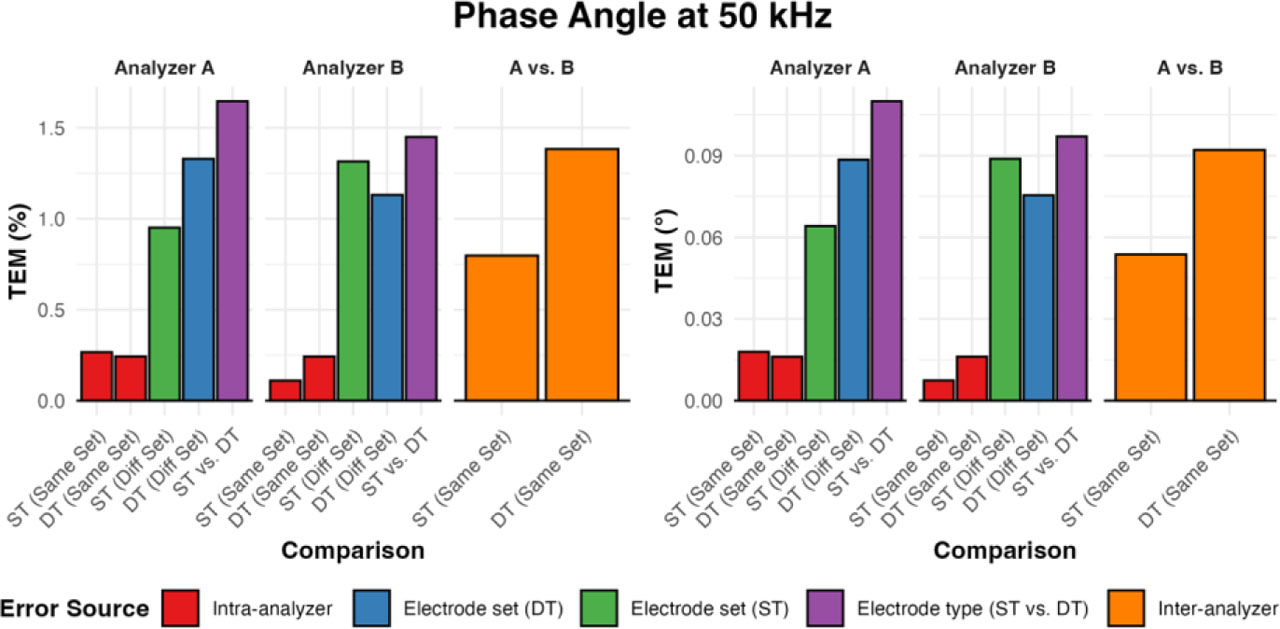
Figure 5.
The technical error of the measurement (TEM) for phase angle (φ) expressed in absolute (°) and relative (%) terms for each assessment, intra-analyzer in red (1 v. 2, 3 v. 4, 7 v. 8, 9 v. 10), different set of double-tab (DT) electrodes in blue (7 v. 11 and 9 v. 12), different set of single-tab (ST) electrodes in green (1 v. 5 and 3 v. 6), comparison of the different electrode types single vs double-tab electrodes in purple (1 v. 7 and 3 v. 9), and inter-analyzer in orange (7 v. 9 and 1 v. 3).
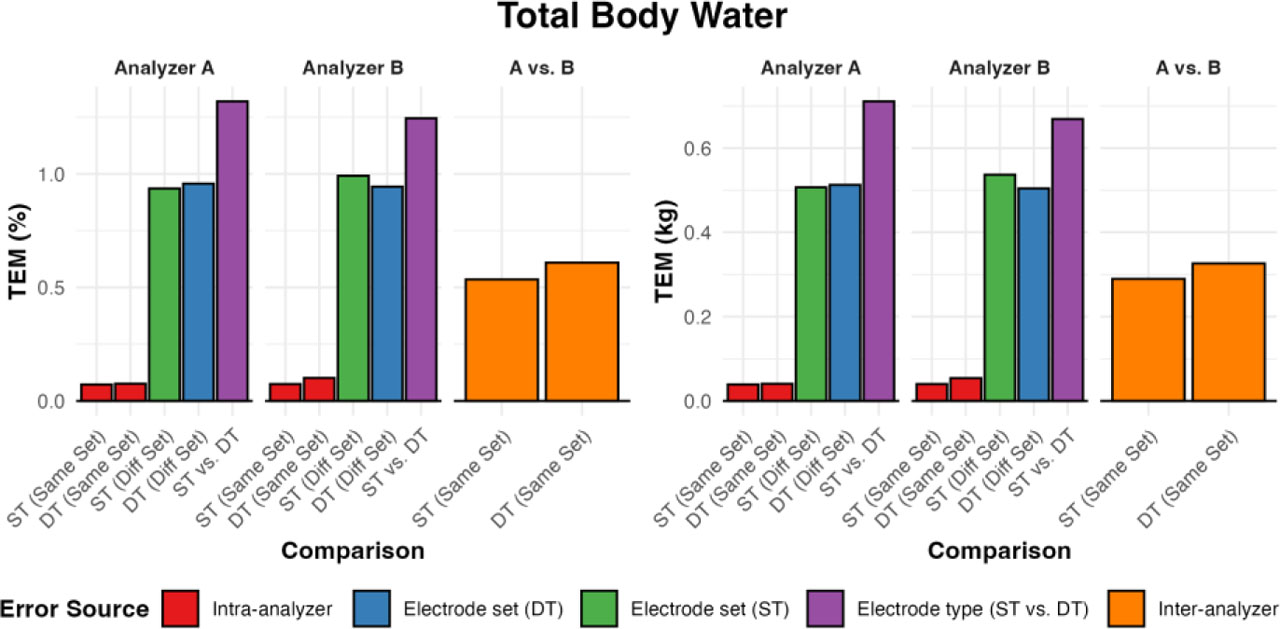
Figure 6.
The technical error of the measurement (TEM) for total boy water (TBW) expressed in absolute (kg) and relative (%) terms for each assessment, intra-analyzer in red (1 v. 2, 3 v. 4, 7 v. 8, 9 v. 10), different set of double-tab (DT) electrodes in blue (7 v. 11 and 9 v. 12), different set of single-tab (ST) electrodes in green (1 v. 5 and 3 v. 6), comparison of the different electrode types single vs double-tab electrodes in purple (1 v. 7 and 3 v. 9), and inter-analyzer in orange (7 v. 9 and 1 v. 3).
Table 3.
The absolute and relative technical error of the measurement for each of the body composition variables – total body water (TBW), fat-free mass (FFM), and fat mass (FM). See Figure 2 for assessment definitions.
| Assessment Comparison | Total Body Water (TBW) | Fat Free Mass (FFM) | Fat Mass (FM) | |||
|---|---|---|---|---|---|---|
| Sample Mean ± SD 53.9 ± 6.3 kg | Sample Mean ± SD 73.6 ± 8.6 kg | Sample Mean ± SD 26.4 ± 8.6 kg | ||||
| Abs. TEM (kg) | Rel. TEM (%) | Abs. TEM (kg) | Rel. TEM (%) | Abs. TEM (kg) | Rel. TEM (%) | |
| 1 v 2 | 0.03 | 0.07 | 0.05 | 0.07 | 0.05 | 0.21 |
| 1 v 3 | 0.19 | 0.50 | 0.40 | 0.54 | 0.40 | 1.52 |
| 3 v 4 | 0.03 | 0.08 | 0.05 | 0.07 | 0.05 | 0.21 |
| 1 v 5 | 0.38 | 0.96 | 0.69 | 0.94 | 0.69 | 2.66 |
| 3 v 6 | 0.38 | 0.98 | 0.73 | 0.99 | 0.73 | 2.81 |
| 7 v 8 | 0.03 | 0.07 | 0.06 | 0.08 | 0.06 | 0.21 |
| 7 v 9 | 0.21 | 0.54 | 0.45 | 0.61 | 0.45 | 1.66 |
| 9 v 10 | 0.04 | 0.10 | 0.07 | 0.10 | 0.07 | 0.27 |
| 7 v 11 | 0.37 | 0.96 | 0.70 | 0.96 | 0.70 | 2.61 |
| 9 v 12 | 0.38 | 0.99 | 0.69 | 0.94 | 0.69 | 2.55 |
| 1 v 7 | 0.53 | 1.37 | 0.97 | 1.32 | 0.97 | 3.68 |
| 3 v 9 | 0.51 | 1.32 | 0.91 | 1.24 | 0.91 | 3.44 |
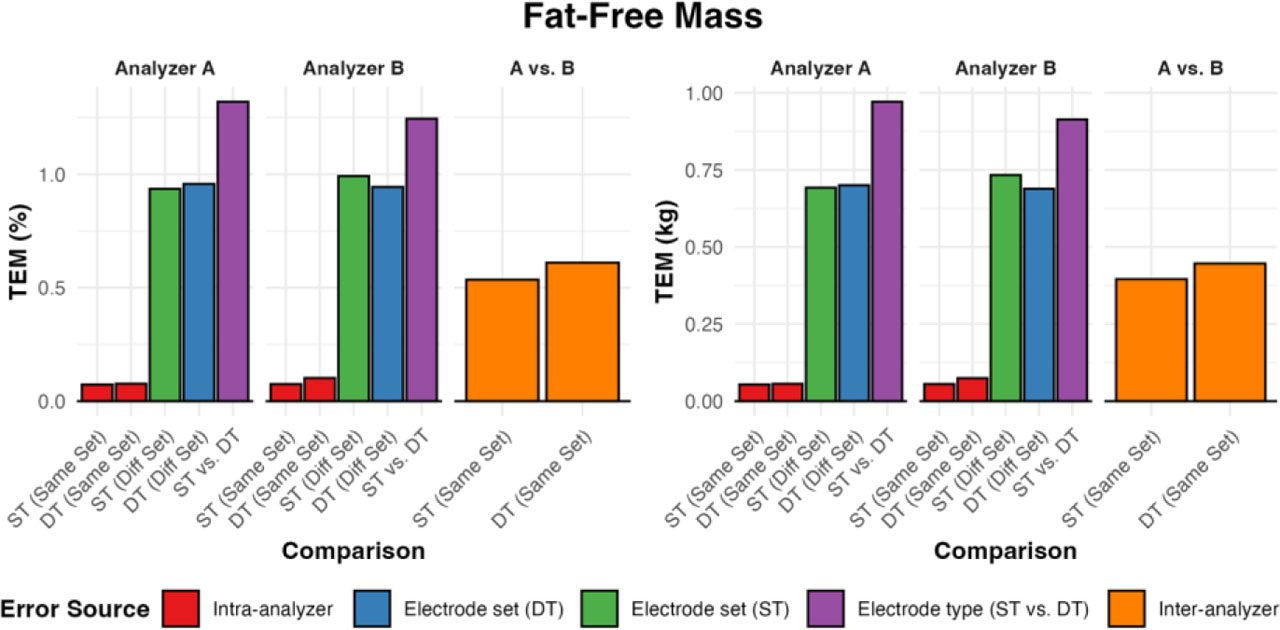
Figure 7.
The technical error of the measurement (TEM) for fat-free mass (FFM) expressed in absolute (kg) and relative (%) terms for each assessment, intra-analyzer in red (1 v. 2, 3 v. 4, 7 v. 8, 9 v. 10), different set of double-tab (DT) electrodes in blue (7 v. 11 and 9 v. 12), different set of single-tab (ST) electrodes in green (1 v. 5 and 3 v. 6), comparison of the different electrode types single vs double-tab electrodes in purple (1 v. 7 and 3 v. 9), and inter-analyzer in orange (7 v. 9 and 1 v. 3).
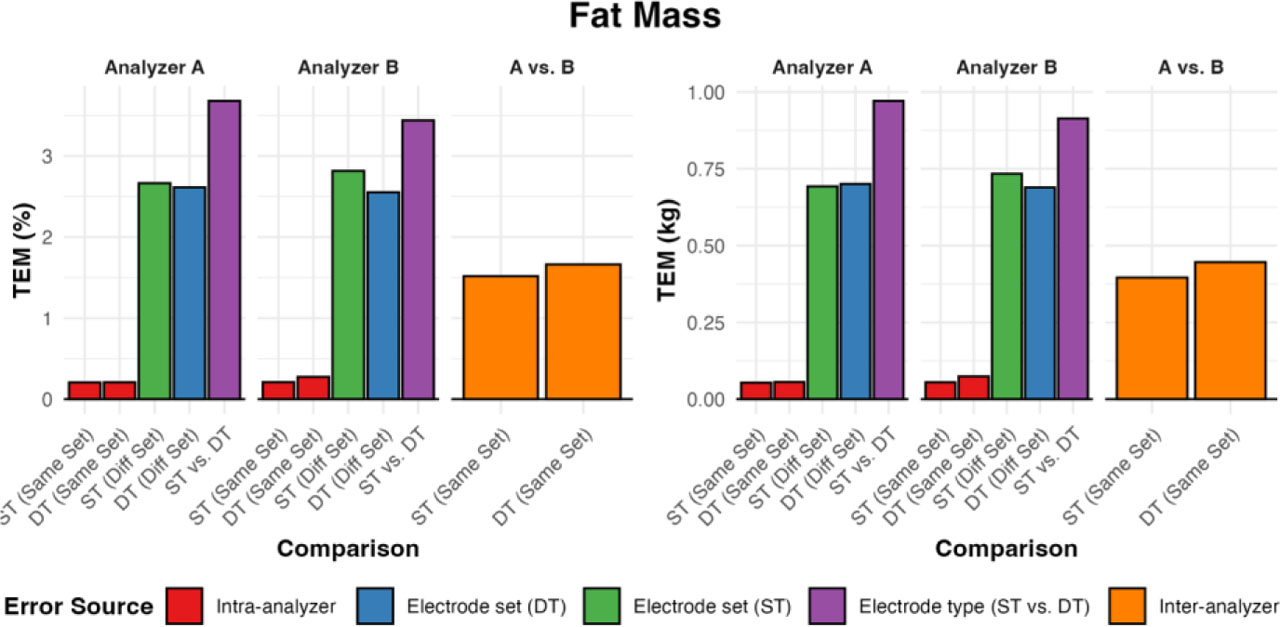
Figure 8.
The technical error of the measurement (TEM) for fat mass (FM) expressed in absolute (kg) and relative (%) terms for each assessment, intra-analyzer in red (1 v. 2, 3 v. 4, 7 v. 8, 9 v. 10), different set of double-tab (DT) electrodes in blue (7 v. 11 and 9 v. 12), different set of single-tab (ST) electrodes in green (1 v. 5 and 3 v. 6), comparison of the different electrode types single vs double-tab electrodes in purple (1 v. 7 and 3 v. 9), and inter-analyzer in orange (7 v. 9 and 1 v. 3).