
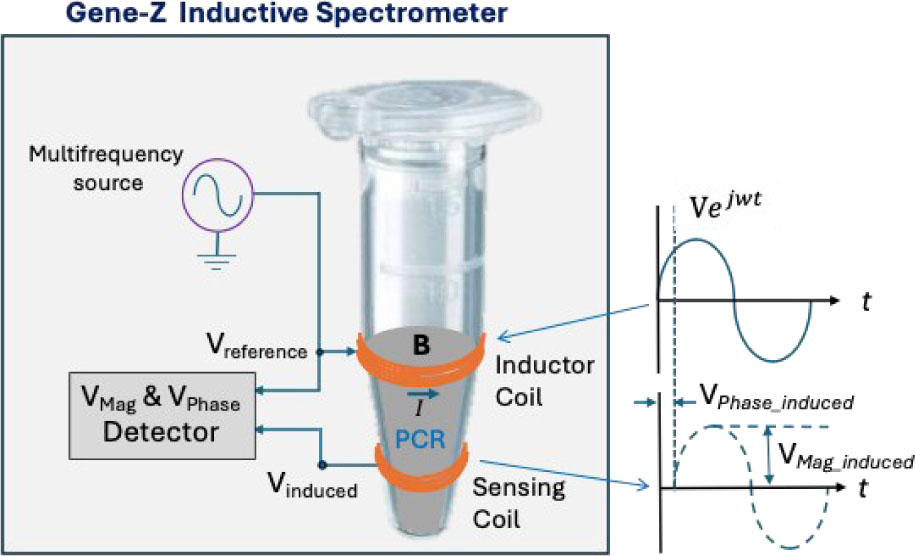
Fig. 1:
Schematic representation of the Gene-Z Inductive Spectrometer. The basic elements of the non-contact and label-free DNA biosensor design include a multifrequency voltage-controlled current source and a voltage magnitude (VMag) and phase angle (VPhase) detector between two signals (reference vs. induced).
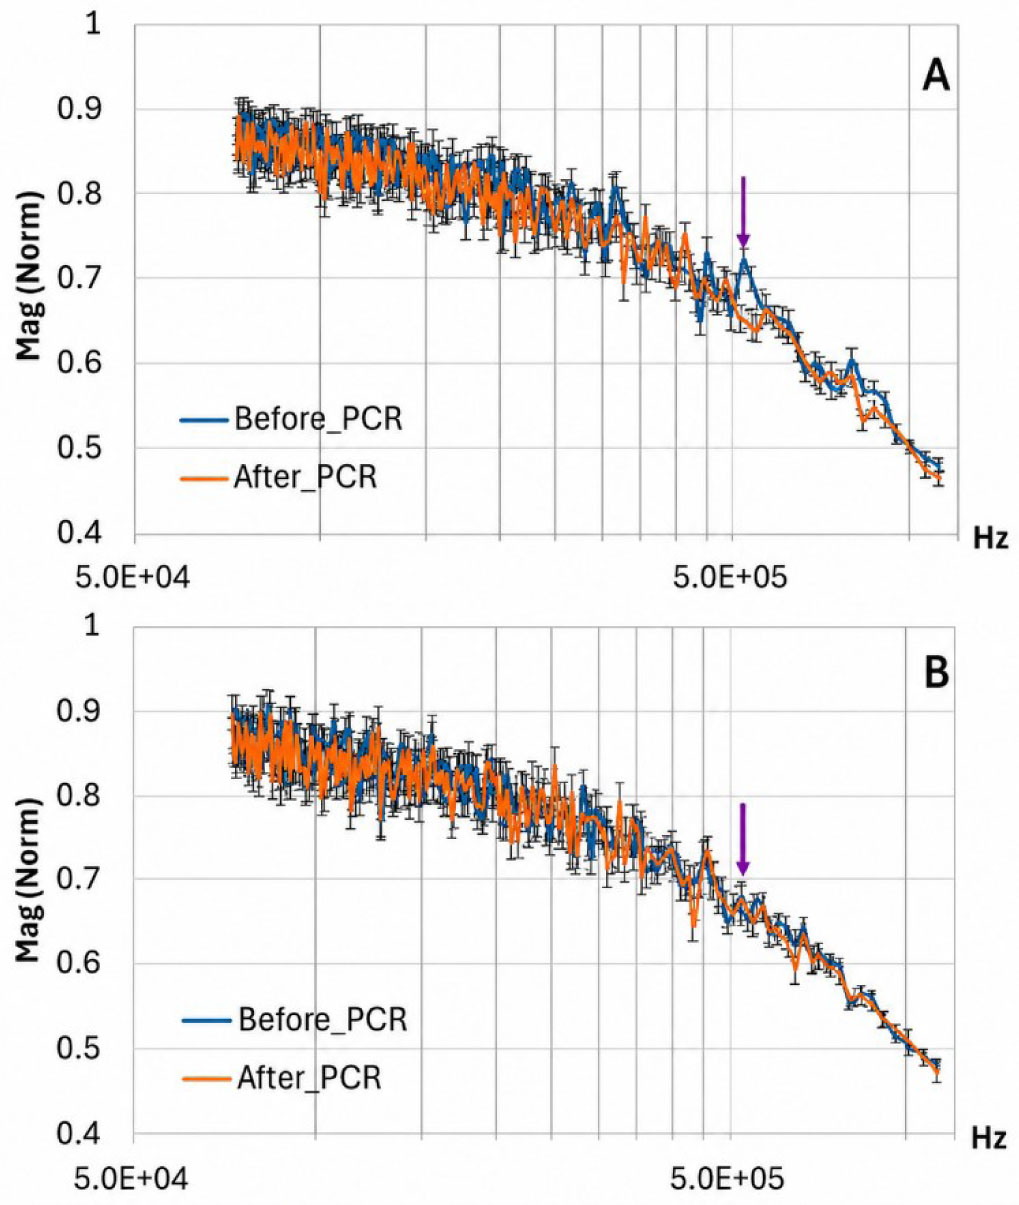
Fig. 2:
Spectra of MIS magnitude before and after PCR in A) positive gene amplification and B) blank controls. Data are presented as a pool of the average value of the six samples analyzed (six biological replicates × five technical repeats measurements each), thus every spectrum is a total of 30 measurements per point (at each frequency). Bars represent the standard error, and arrows show the differential pattern in the range of 500 to 650 kHz.
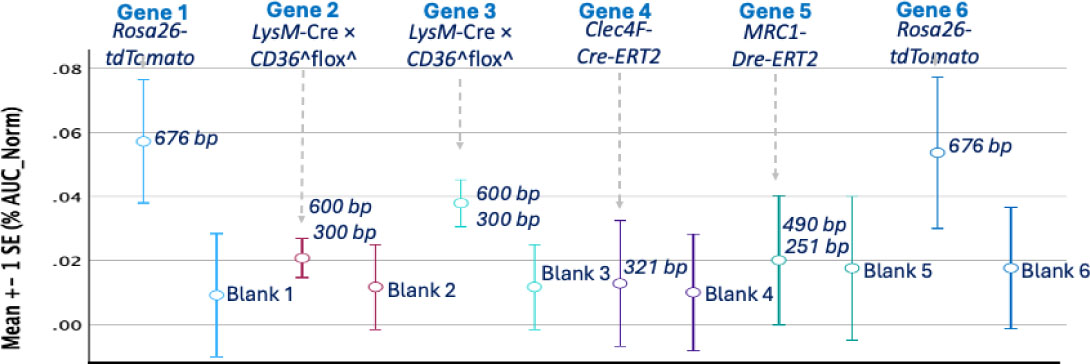
Fig. 3:
Individual %AUC change as parameter comparison. Differences after PCR with respect to basal condition (before PCR) for positive genes and corresponding blanks are showed. Molecular size data estimated by electrophoresis are shown for every amplicon’s presence in contrast with control blanks. A paired comparison for every independent biological sample (n = 6) showed a statistically significant difference before and after PCR (Wilcoxon signed-rank test, Z = −2.201, p = 0.028, effect size r = 0.90). (95% bootstrap BCa confidence interval: −5100.3 to −1428.7 units).
Table 1.
Gene samples: expected and observed molecular sizes by electrophoresis.
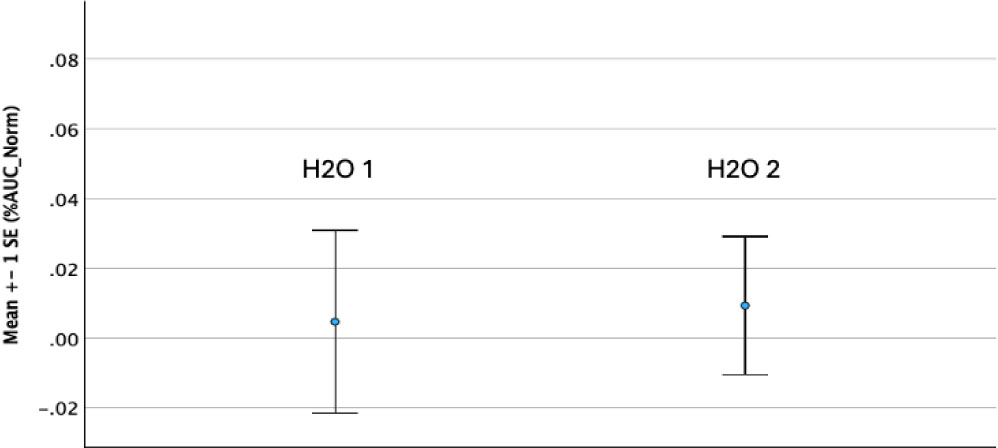
Fig. 4:
Individual %AUC change as parameter comparison. Differences after temperature cycles as PCR reaction simulation with respect to basal condition (before PCR) for two distilled water (H2O) samples.