
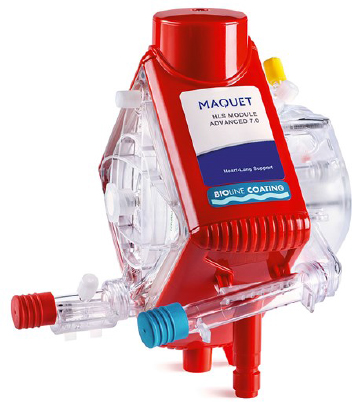
Figure 1:
’HLS Module Advanced’ oxygenator by Maquet Cardiopulmonary GmbH (Rastatt, Germany).
Table 1:
Overview of the FEM model component properties.
| Part | Conductivity | Characteristics |
|---|---|---|
| BG | 6.62 × 10⁻¹ S·m−1 | 9 × 9 × 5 cm |
| Clot | 6.62 × 10⁻² S·m−1 | Spherical targets |
| SG | 1 ×10⁻⁶ S·m−1 | Rod diameter 0.4 cm |
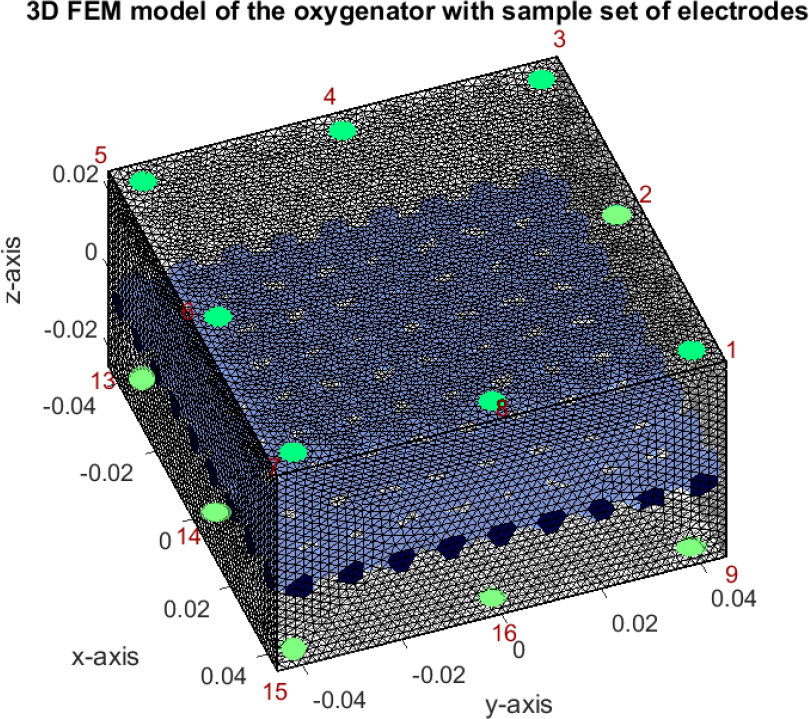
Figure 2:
The generated FEM model of the oxygenator with a sample electrode array (depicted in green) and separation grid (depicted in blue). Red is used to number visualized electrodes.
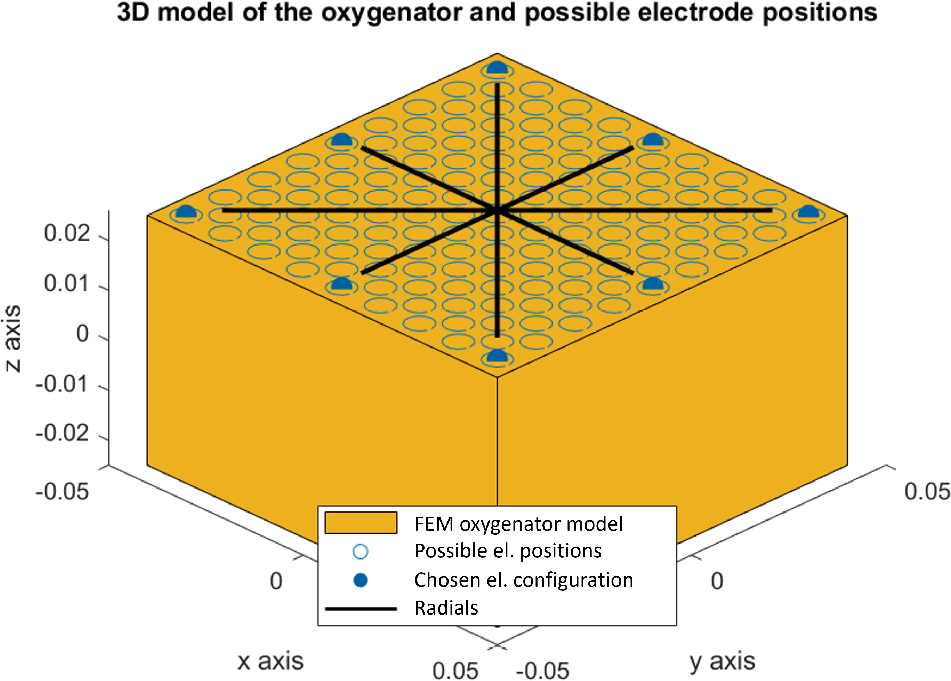
Figure 3:
A sample generated electrode array with highlighted radials.
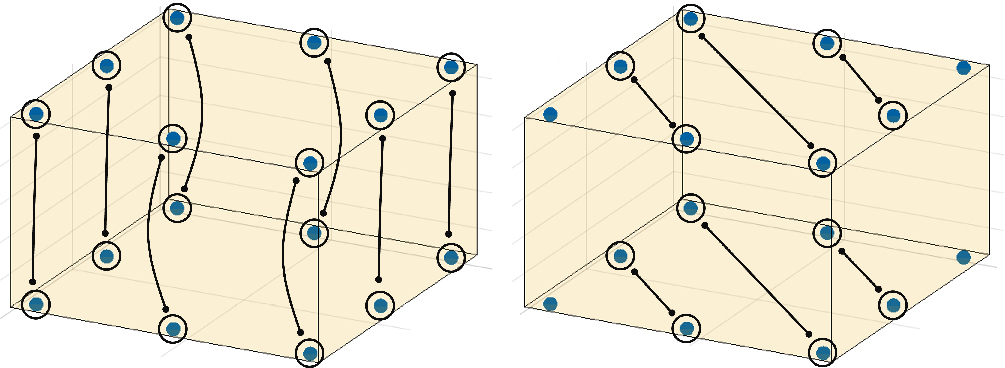
Figure 4:
Examples of electrode pairs for inter-plane and intra-plane sensing.
Table 2:
Overview of measurement-selection methods and counts.
| Maximization | Number of measurements |
|---|---|
| Parallelotope volume | 144 |
| L1-norm | 32 |
| L2-norm | 32 |
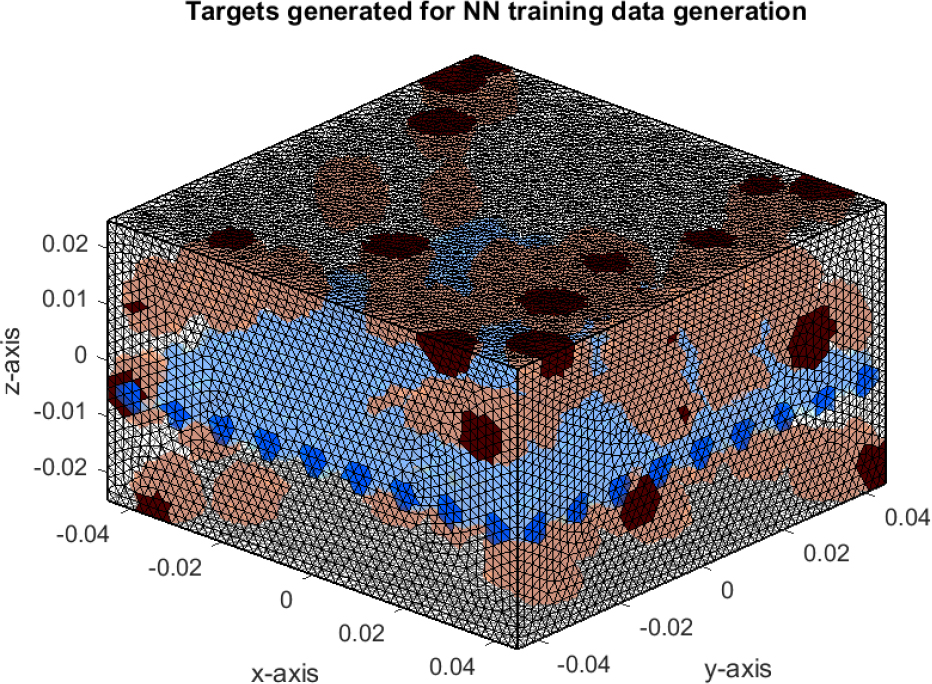
Figure 5:
Targets for NN training data generation in red and separation grid in blue.
Table 3:
Overview of layers for an electrode position optimization NN.
| # | Layer type | Layer information |
| 1 | input layer | 3-element vector |
| 2 | FC layer | 254 neurons |
| 3 | ReLU layer | activation layer |
| 4 | FC layer | 203 neurons |
| 5 | ReLU layer | activation layer |
| 6 | FC layer | 48 neurons |
| 7 | regression layer | determine positions |
Table 4:
Overview of layers for a thrombus detection NN.
| # | Layer type | Layer information |
|---|---|---|
| 1 | input layer | 208-element vector |
| 2 | FC layer | 200 neurons |
| 3 | ReLU layer | activation layer |
| 4 | FC layer | 100 neurons |
| 5 | ReLU layer | activation layer |
| 6 | FC layer | 2 neurons |
| 7 | softmax layer | to probabilities |
| 8 | classification layer | more probable class |
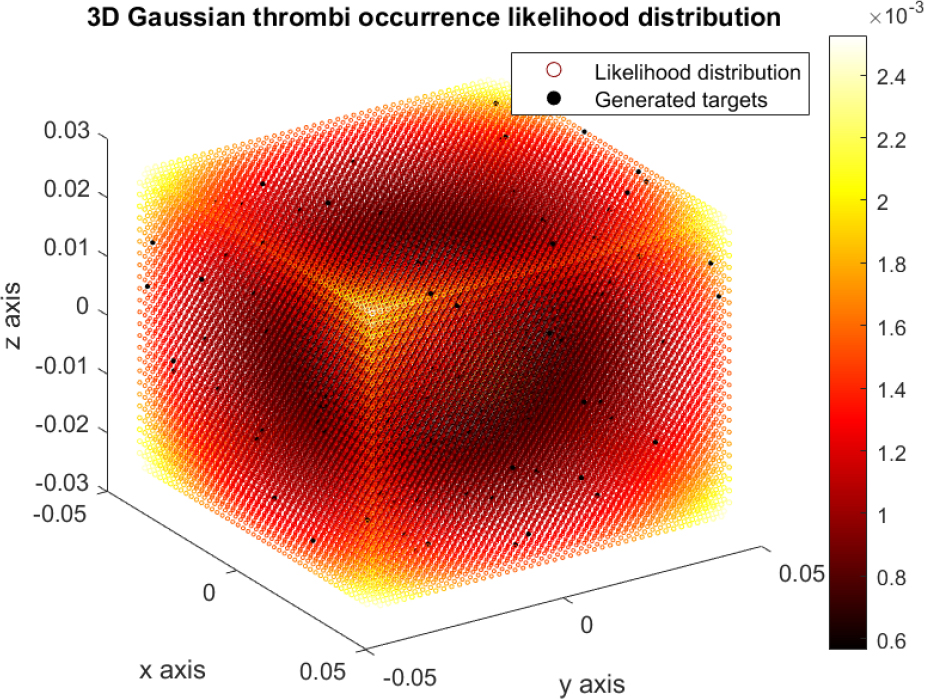
Figure 6:
3D thrombus occurrence likelihood distribution with a sample set of generated thrombi.
Table 5:
Figures of merit chosen for position optimization NN training.
| Feature | Explanation |
|---|---|
| J homogeneity | |
| J condition number | |
| ∆Vr measurement homogeneity |
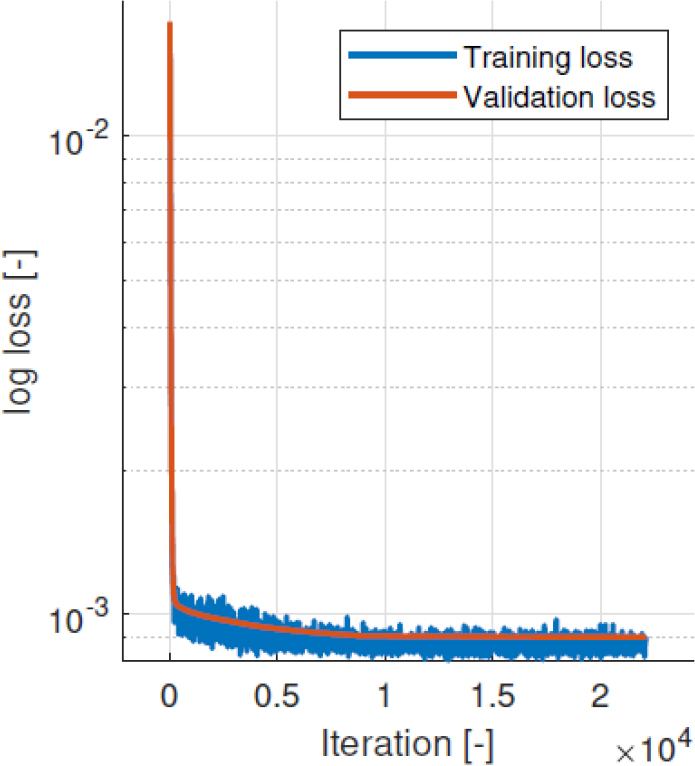
Figure 7:
Time course of loss for electrode array optimization NN training.
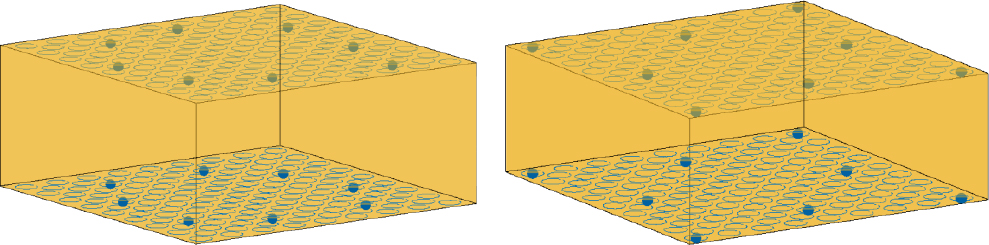
Figure 8:
Electrode array for optimal feature values (left) and adjusted electrode array (right).
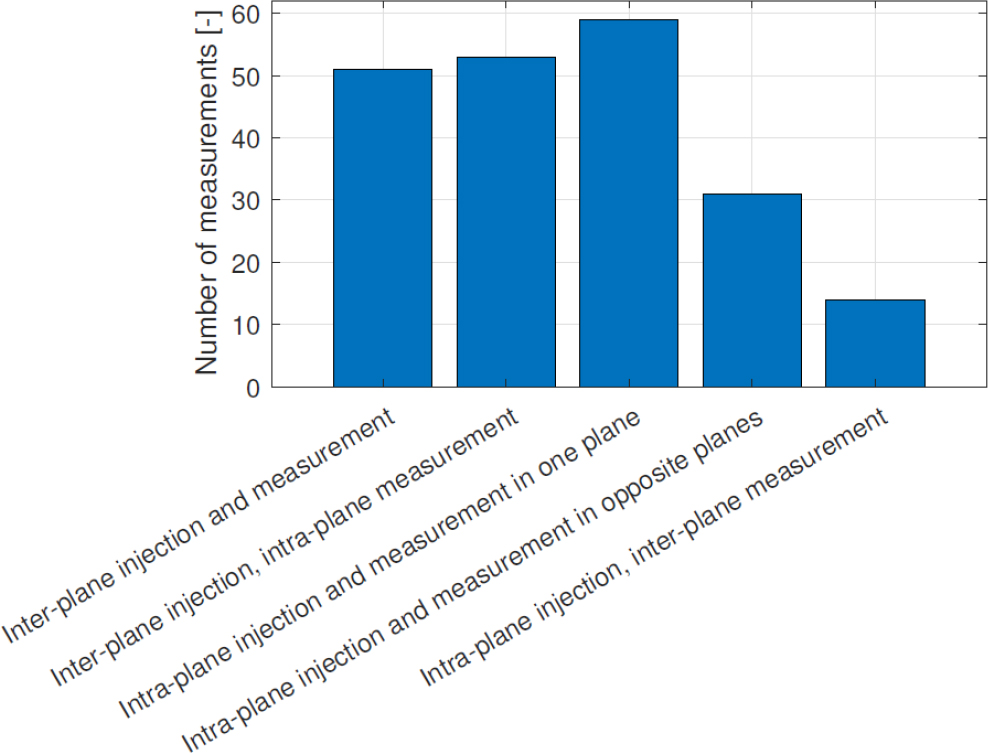
Figure 9:
Information about spatial arrangement of used pairs of the adjusted electrode array.
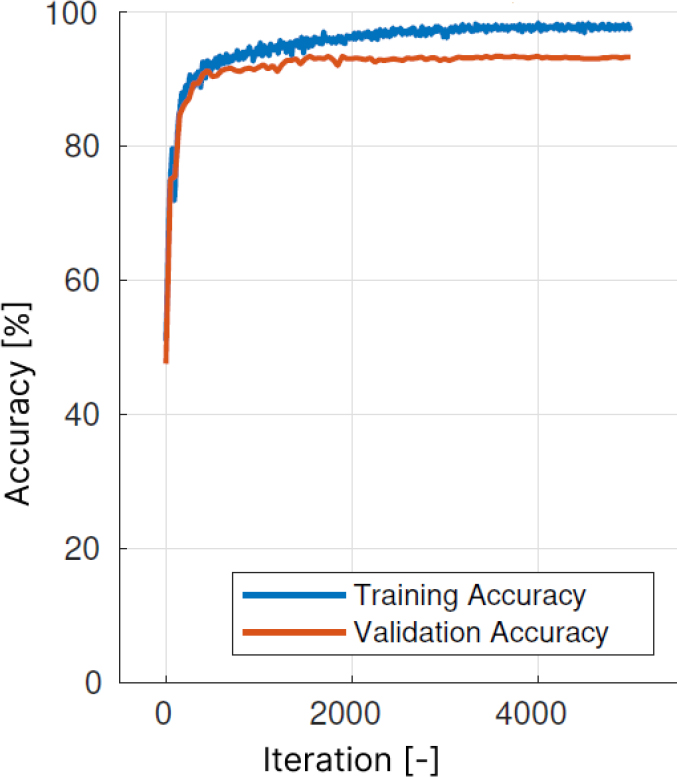
Figure 10:
Time course of accuracy for thrombus detection NN training.
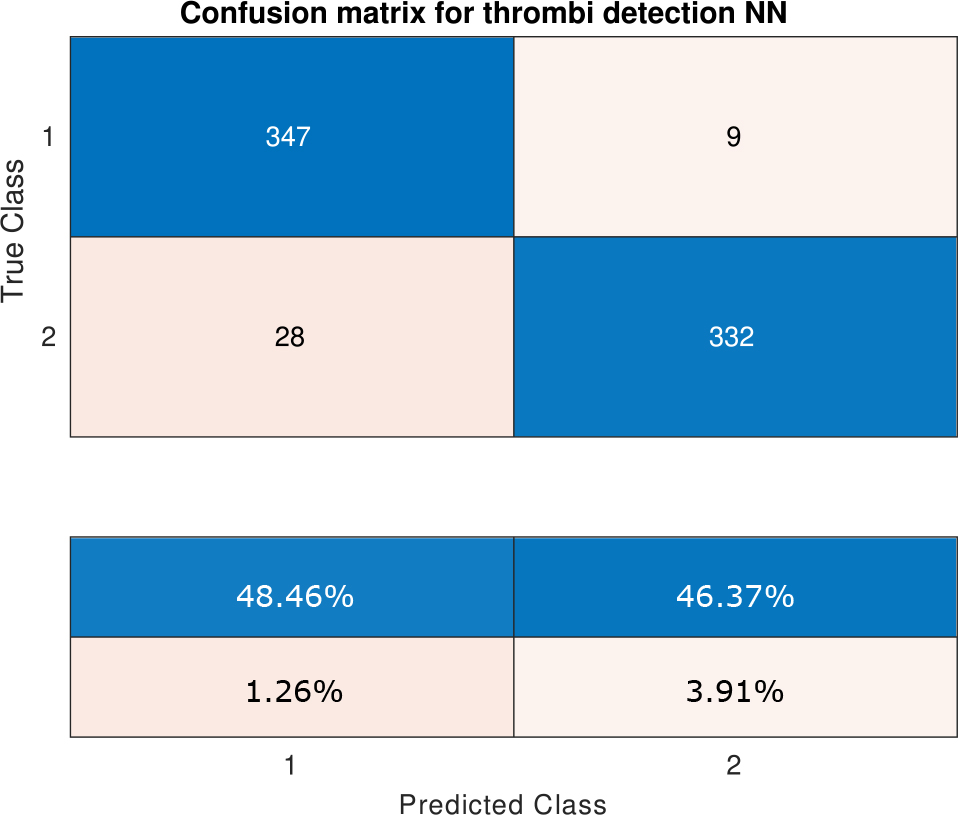
Figure 11:
Confusion matrix for the thrombus-detection NN. Class #1 corresponds to thrombi not present and class #2 corresponds to thrombi present.