
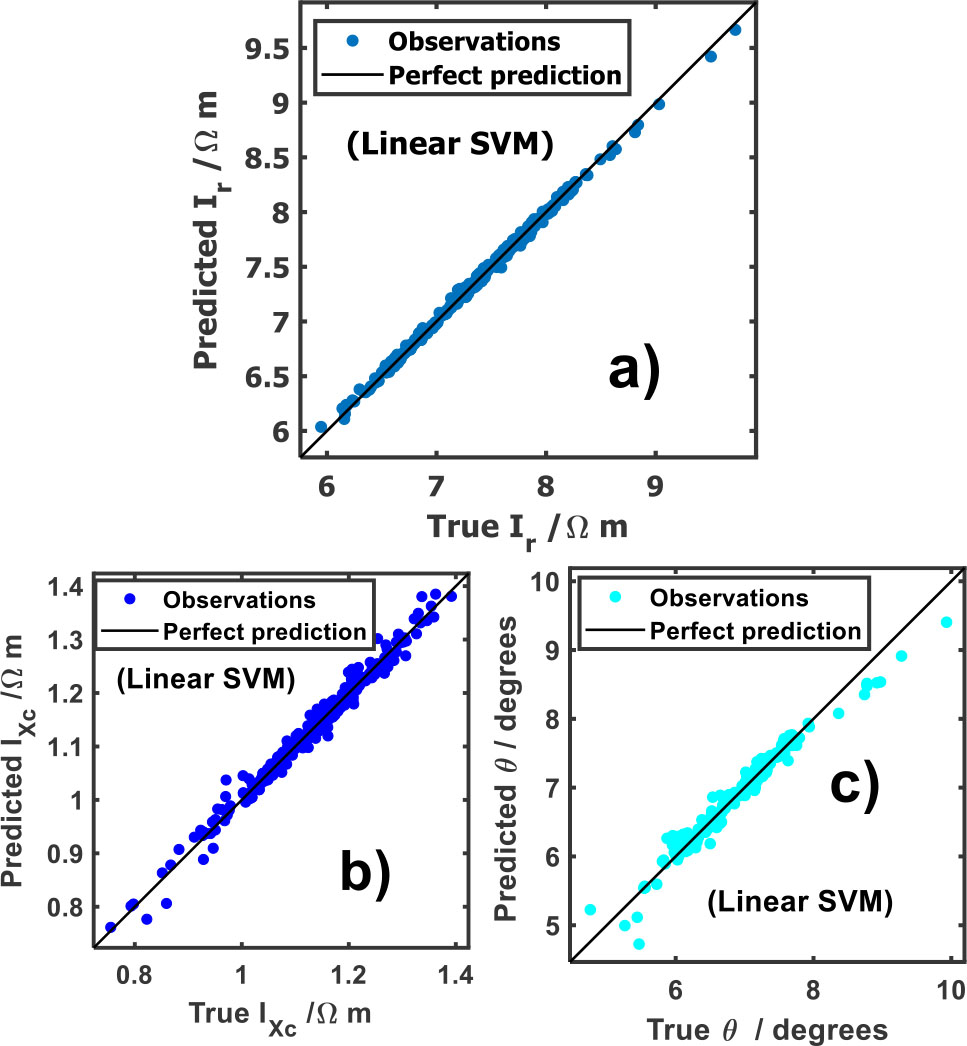
Fig.1:
Predicted vs observable plot of: a) specific resistance index (Ir), b) specific reactance index (IXc) and c) phase angle (θ).
Table 1:
Accuracy parameters of specific resistance-reactance indexes (Ir, IXc) and phase angle (θ) responses.
| Response | Model | RMSE | R2 | MSE | MAE |
|---|---|---|---|---|---|
| Ir(Ωm) | Linear SVM | 0.0320 (Ωm) | 1.00 | 0.0010 (Ωm) | 0.0240 (Ωm) |
| IXc (Ωm) | Linear SVM | 0.0150 (Ωm) | 0.98 | 0.0002 (Ω2m2) | 0.1064 (Ωm) |
| θ (º) | Linear SVM | 0.0973 (º) | 0.98 | 0.0095 (°2) | 0.0609 (º) |
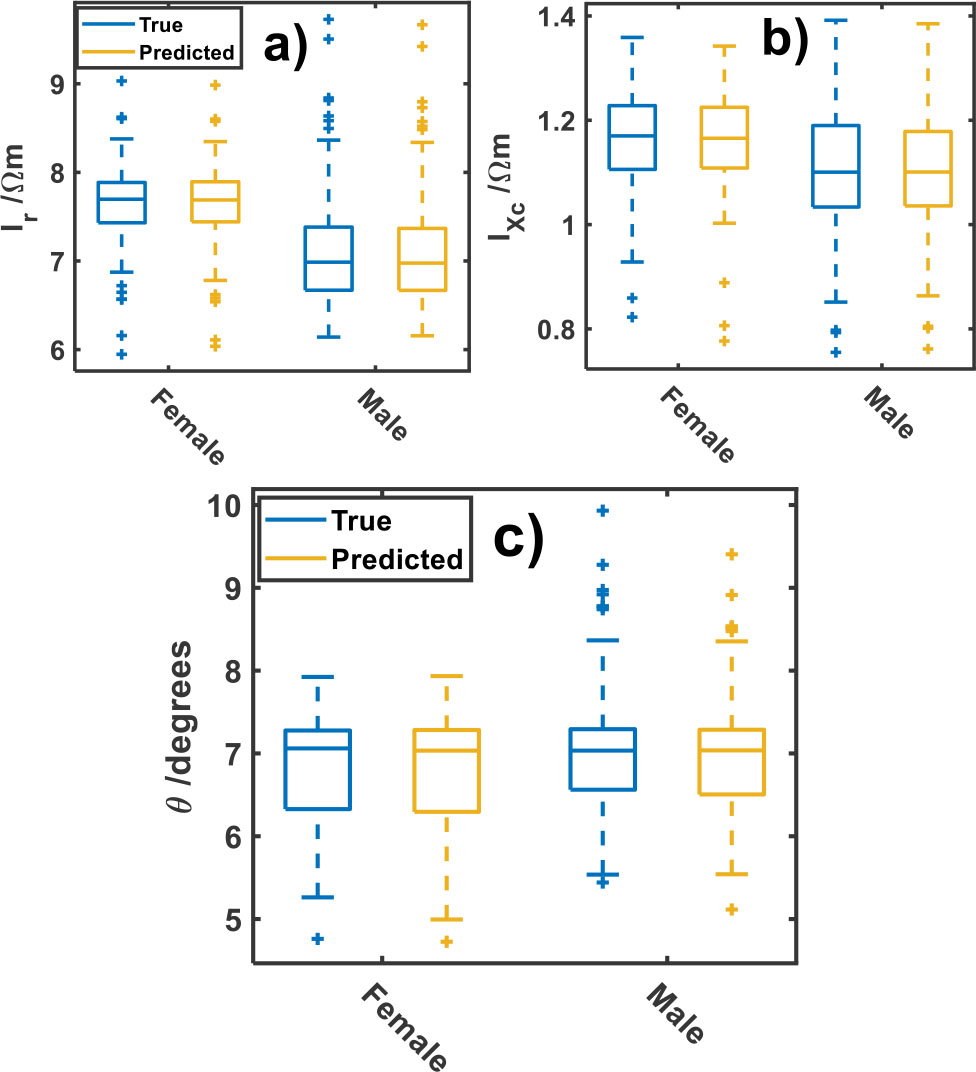
Fig.2:
True and predicted responses versus sex of a) specific resistance index (Ir), b) specific reactance index (IXc) and c) phase angle (θ).
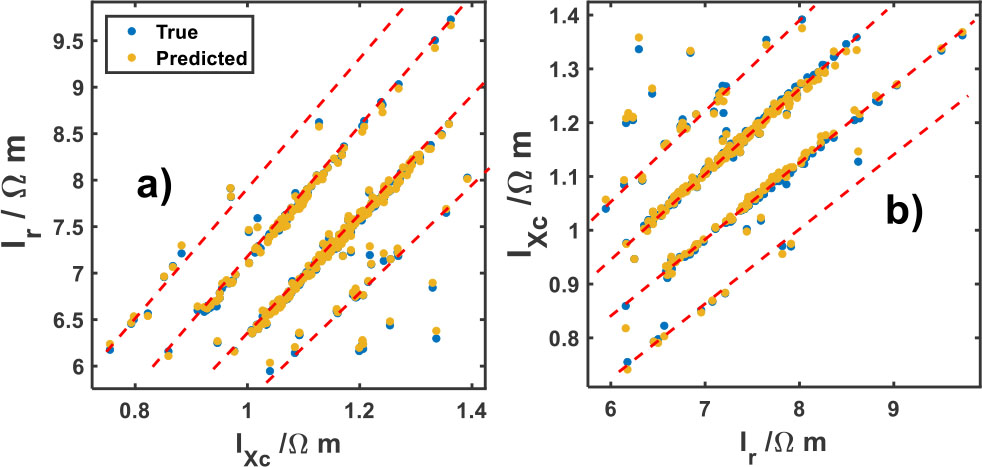
Fig.3:
True and predicted: a) Ir versus IXc and b) IXc versus Ir bioelectrical parameters. Red lines represent a tendency between these parameters.
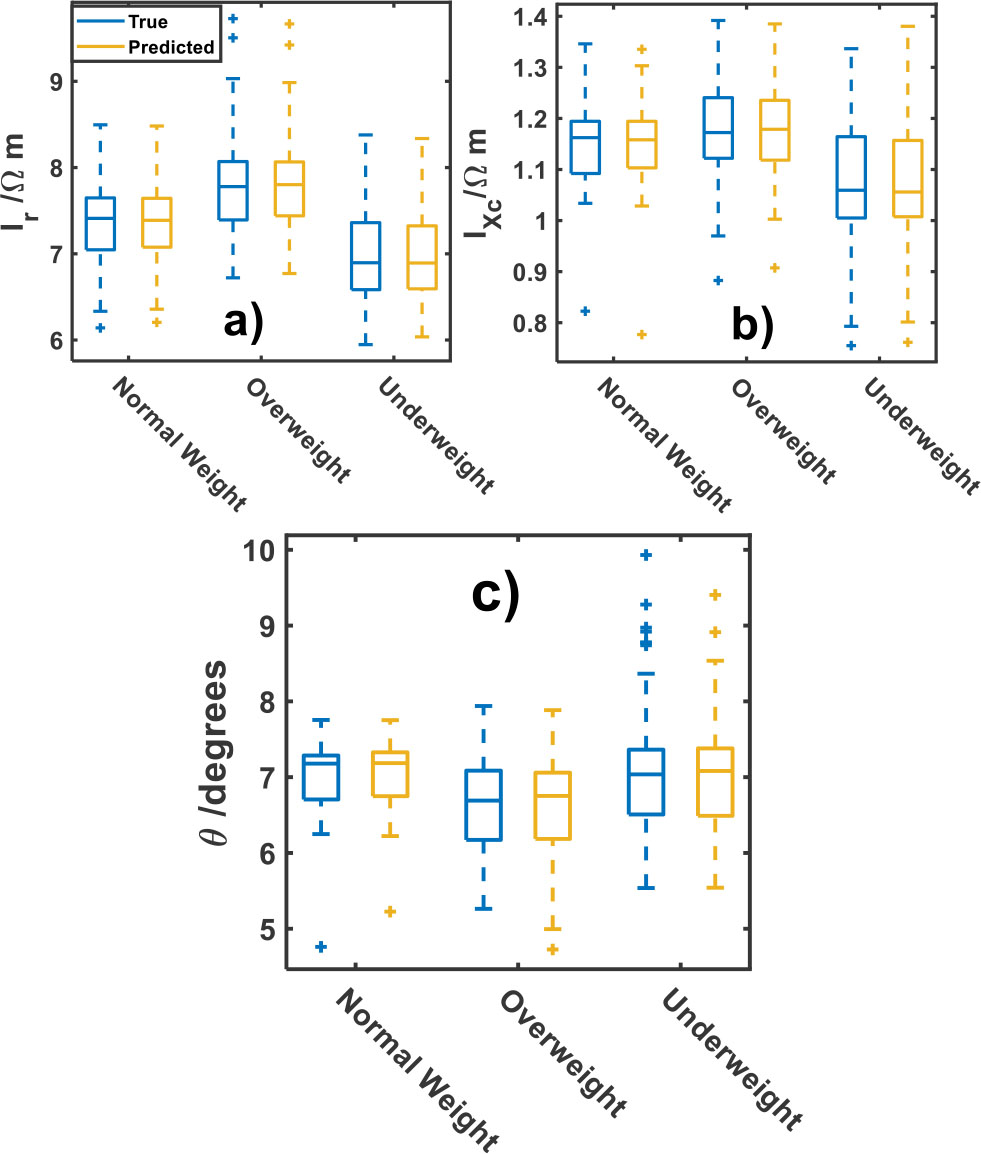
Fig.4:
Response bioelectrical parameters of: a) Ir b) IXc and c) phase angle (θ) by weight status classes.