
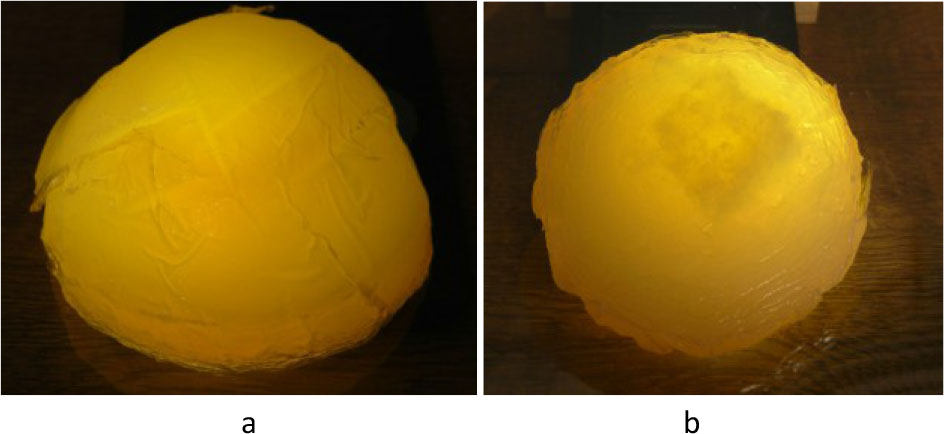
Fig.1
Phantoms with backlight (the light passing through the object): (a) homogenous and (b) with internal heterogeneity.
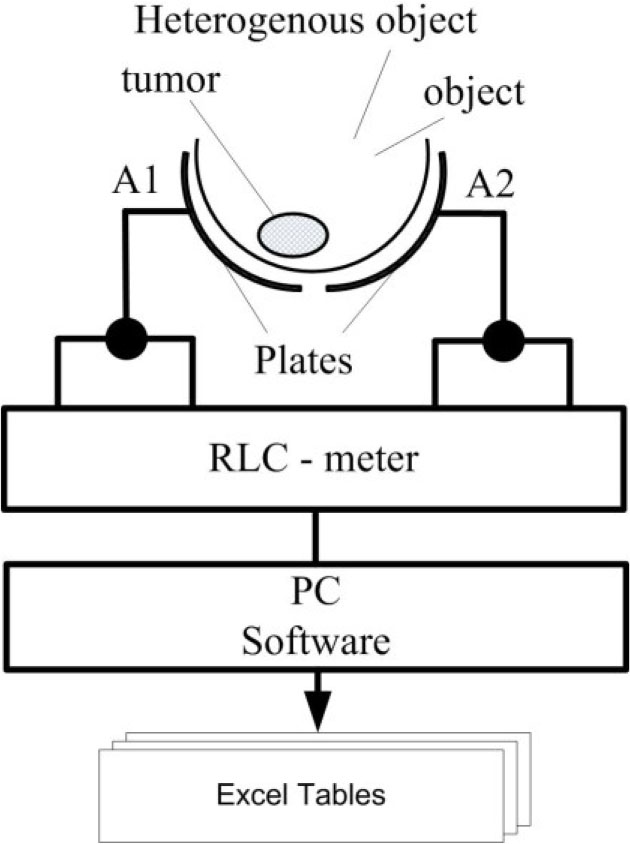
Fig.2
Experimental setup scheme.
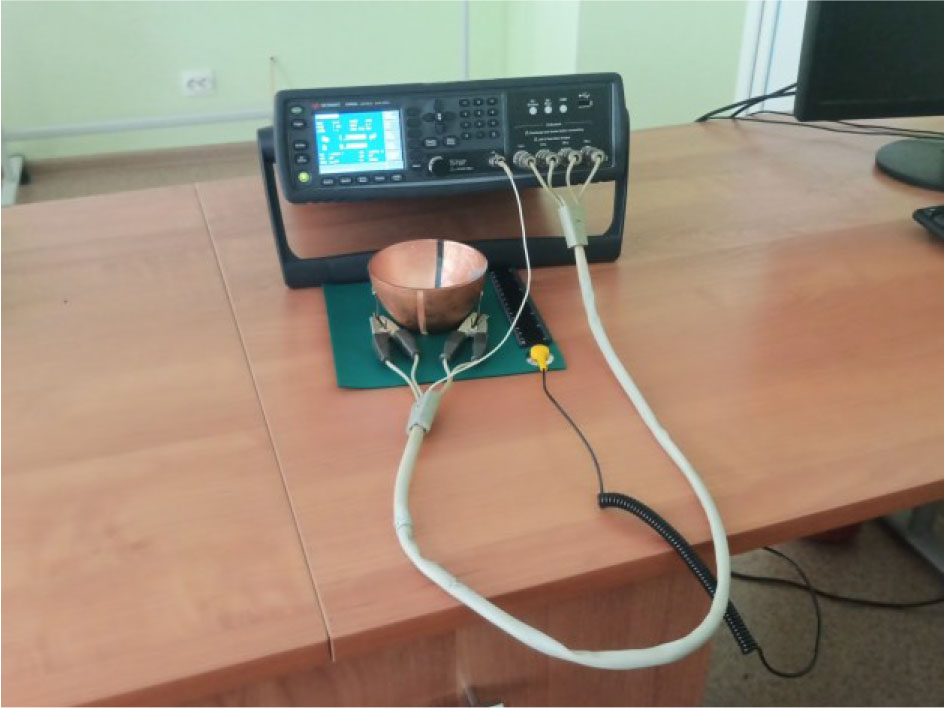
Fig.3
Experimental setup.
Table 1.
Experimental results.
| Frequency | 20 Hz | 10 kHz | 50 kHz | 100 kHz | 200 kHz | 500 kHz | 1 MHz | 1.5 MHz | 20 MHz |
|---|---|---|---|---|---|---|---|---|---|
| Homogenous phantom, GΩ | |||||||||
| R | 7.982 | 4.844 | 3.865 | 3.439 | 3.040 | 2.548 | 2.198 | 1.986 | 1.831 |
| X | −8.091 | −5.877 | −5.207 | −4.912 | −4.616 | −4.224 | −3.927 | −3.755 | −3.634 |
| Heterogenous phantom, GΩ | |||||||||
| R | 8.060 | 4.843 | 4.049 | 3.657 | 3.242 | 2.682 | 2.275 | 2.059 | 1.887 |
| X | −7.768 | −5.917 | −5.257 | −4.967 | −4.673 | −4.281 | −3.984 | −3.810 | −3.689 |
| Differences, GΩ | |||||||||
| R | 0.078 | 0.001 | 0.185 | 0.218 | 0.202 | 0.138 | 0.077 | 0.073 | 0.055 |
| X | 0.322 | 0.040 | 0.049 | 0.055 | 0.057 | 0.058 | 0.057 | 0.055 | 0.055 |
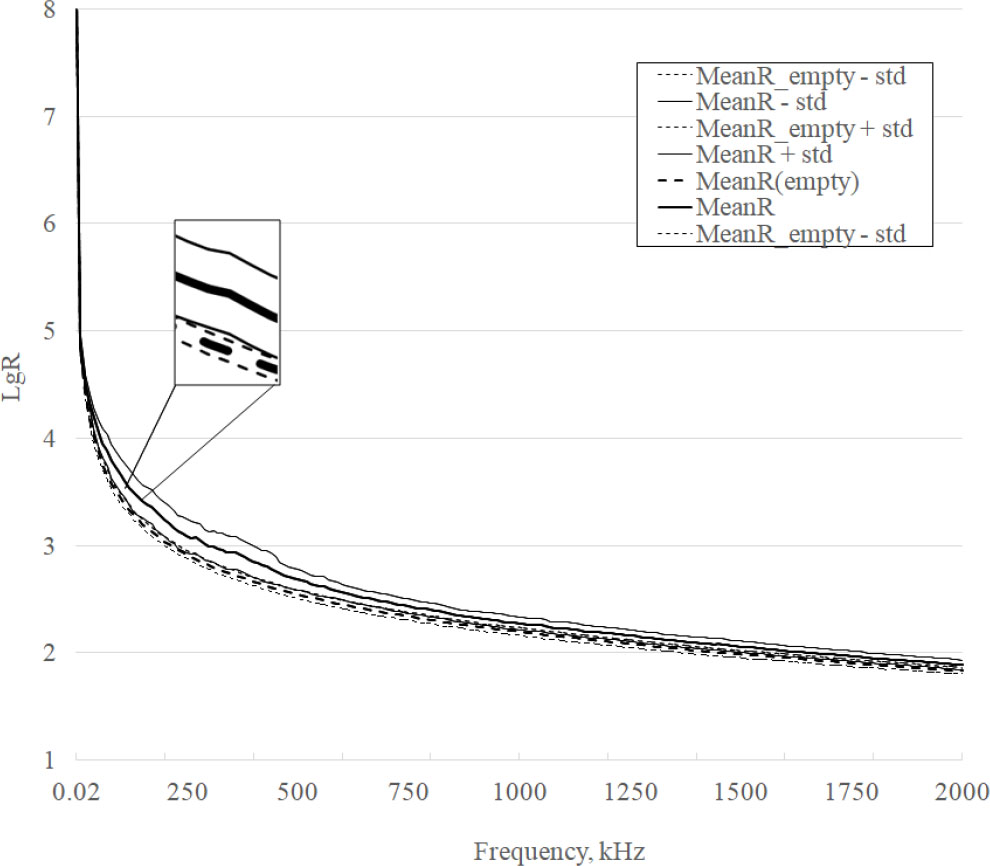
Fig.4
R curves for homogenous and heterogeneous phantoms.
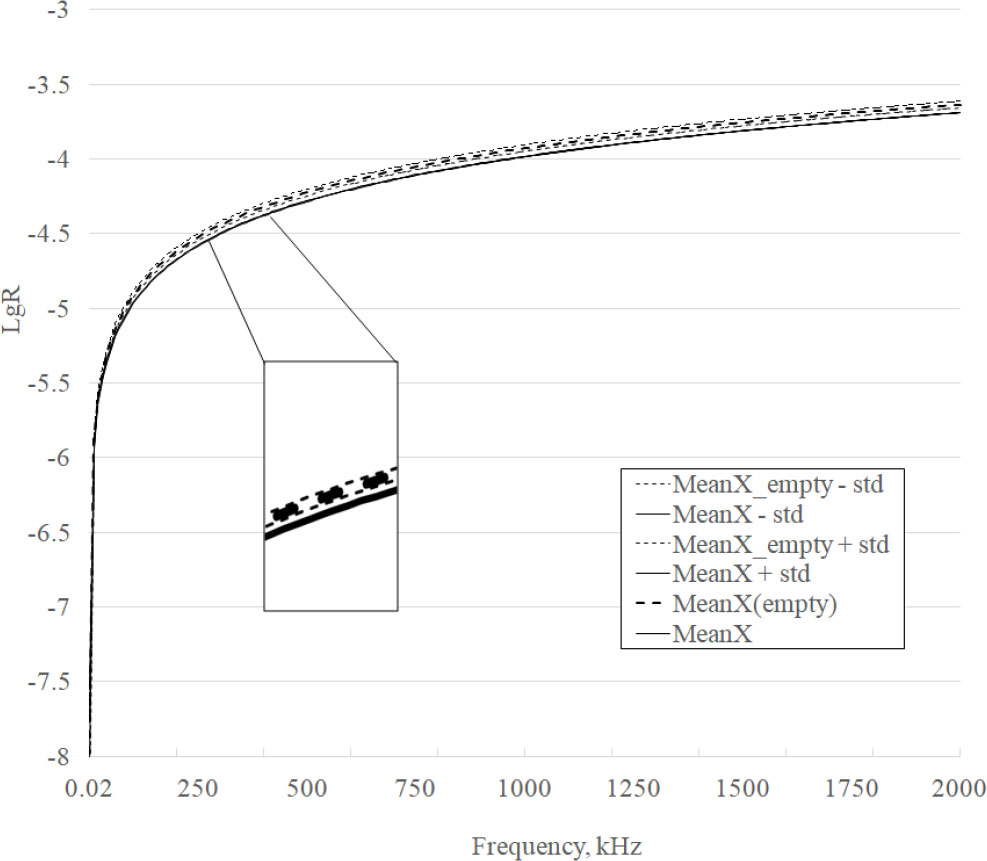
Fig.5
X curves for homogenous and heterogeneous phantoms.
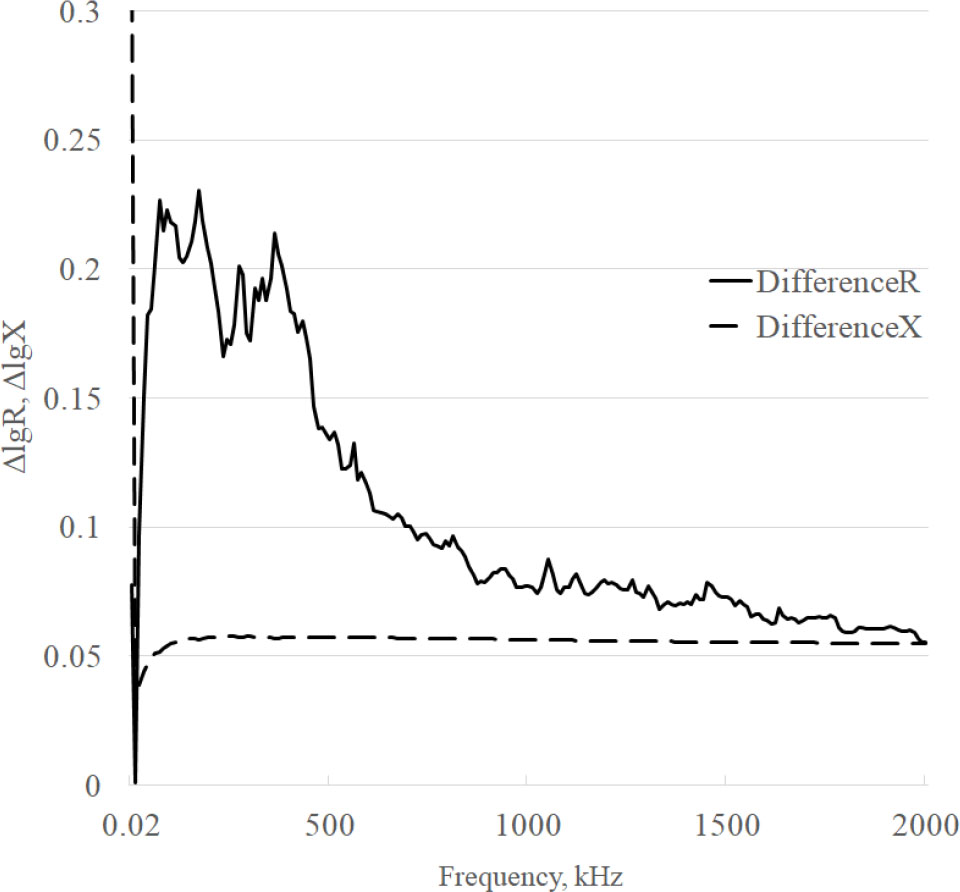
Fig.6
Difference curves.