
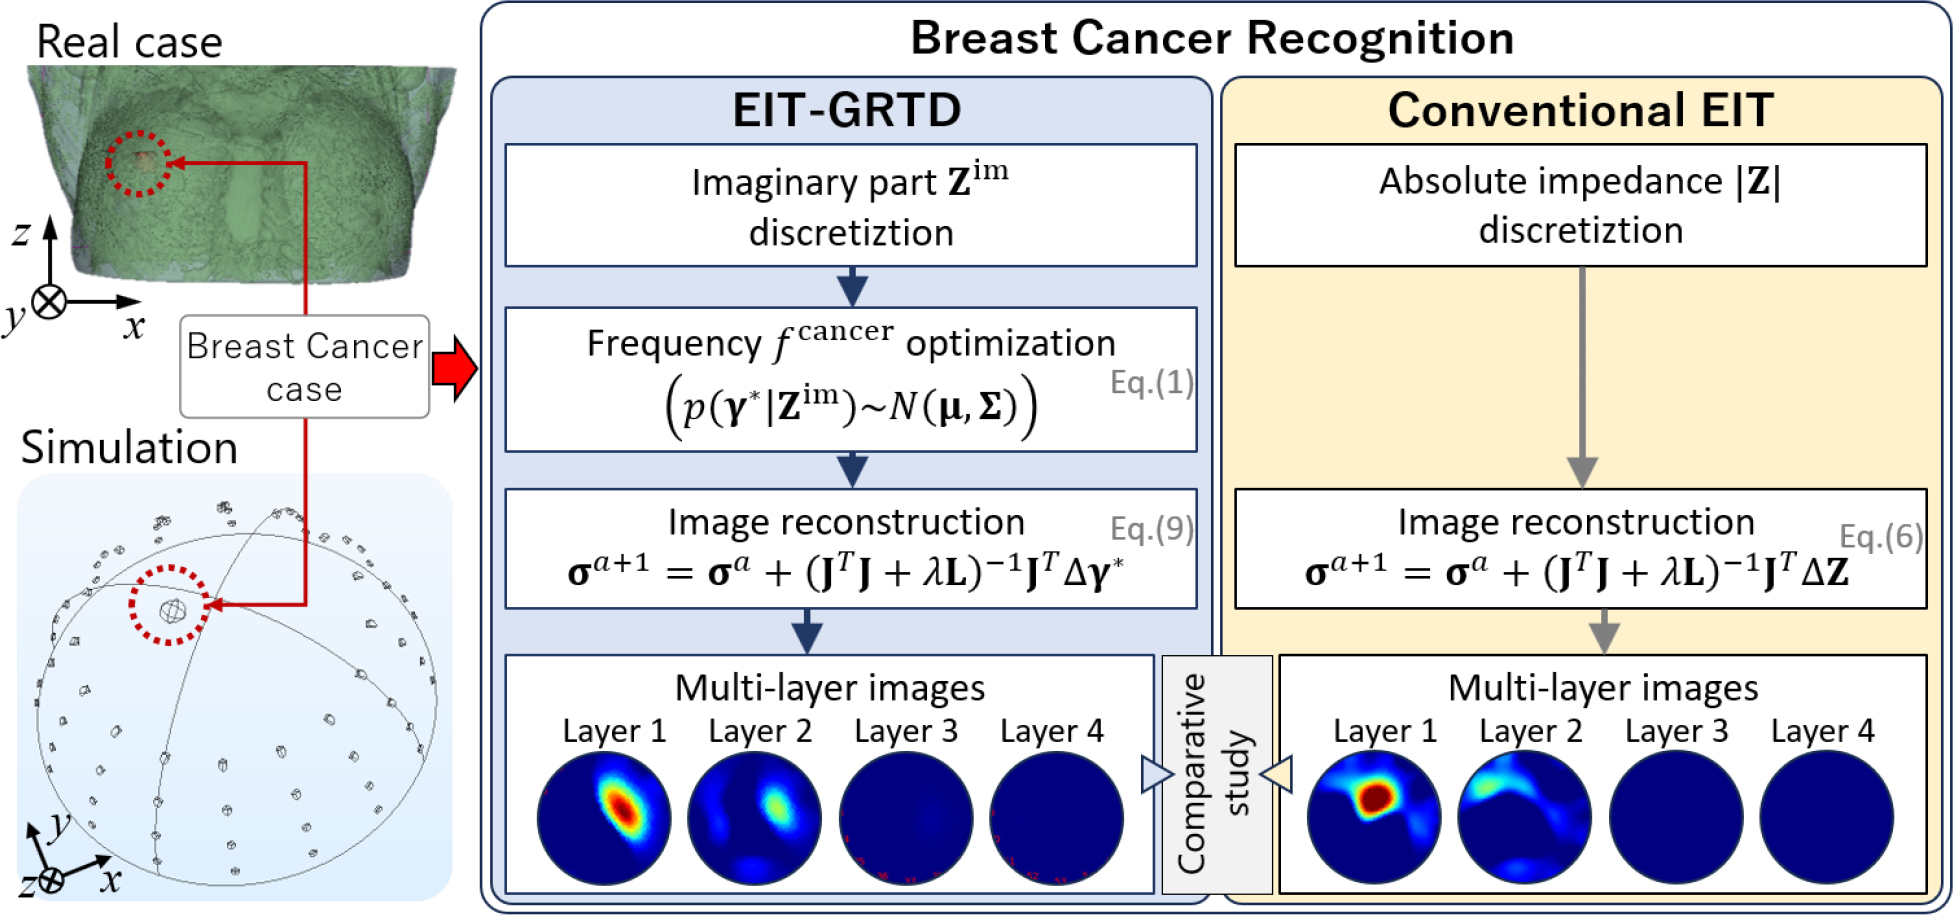
Fig. 1:
Overview of breast cancer recognition by EIT-GRTD versus conventional EIT
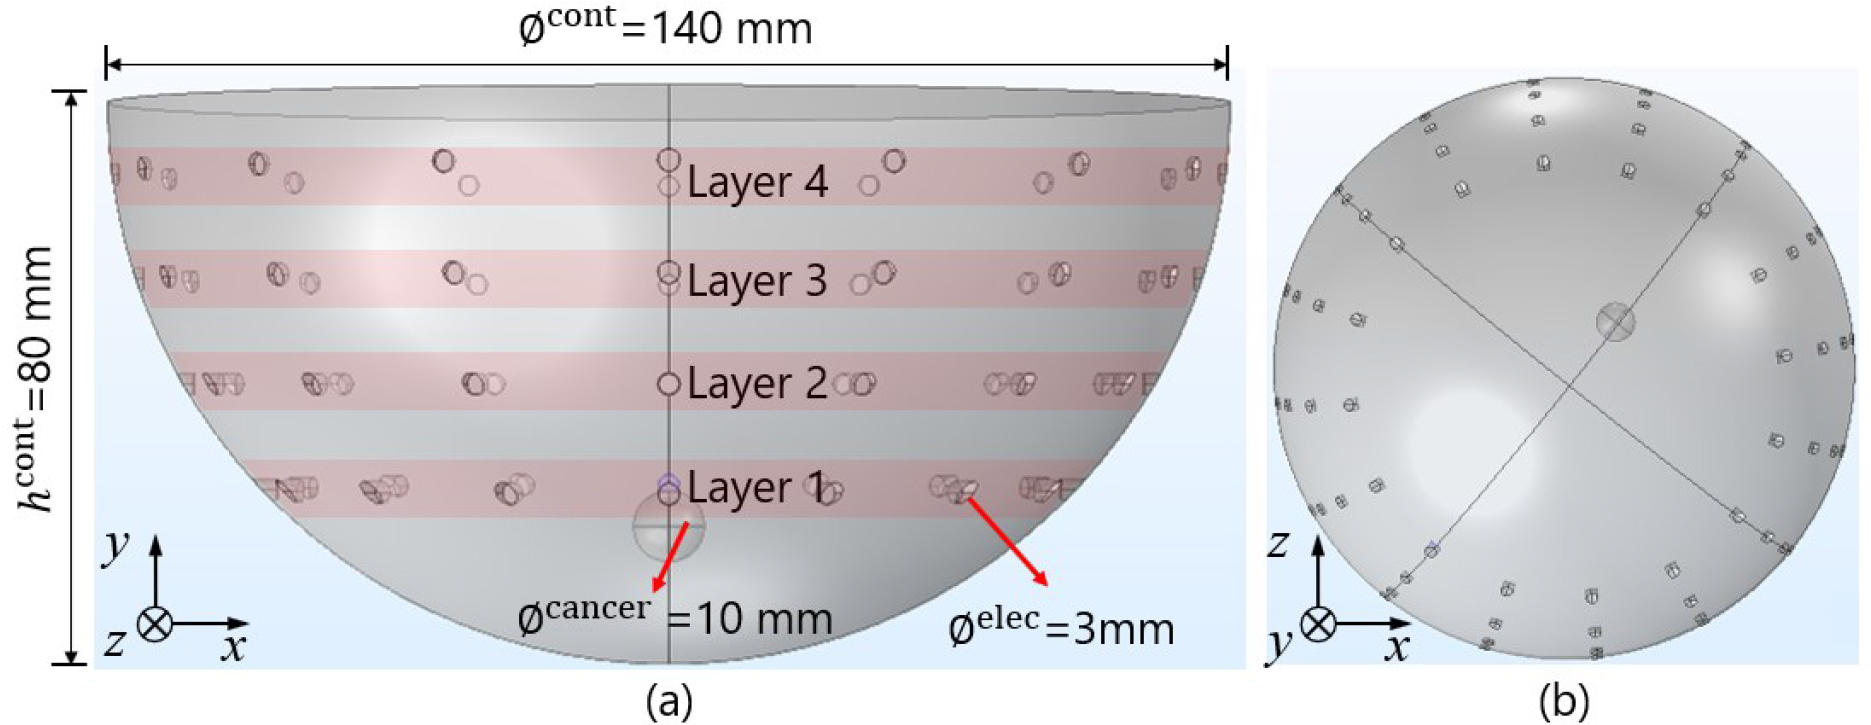
Fig. 2:
Simulation setup of breast cancer recognition in the case of (a) z-axis view, and (b) y-axis view
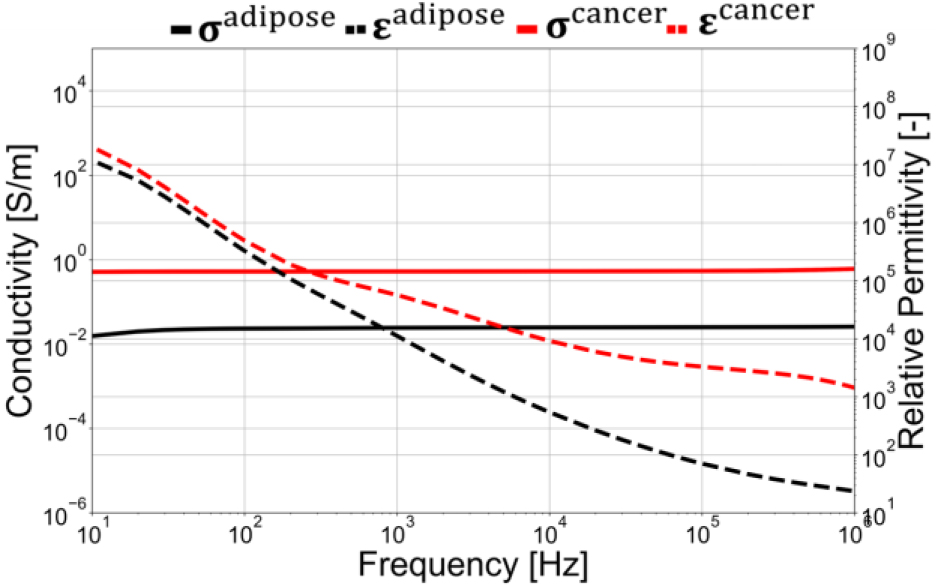
Fig. 3:
Electrical properties utilized in the simulation [24].
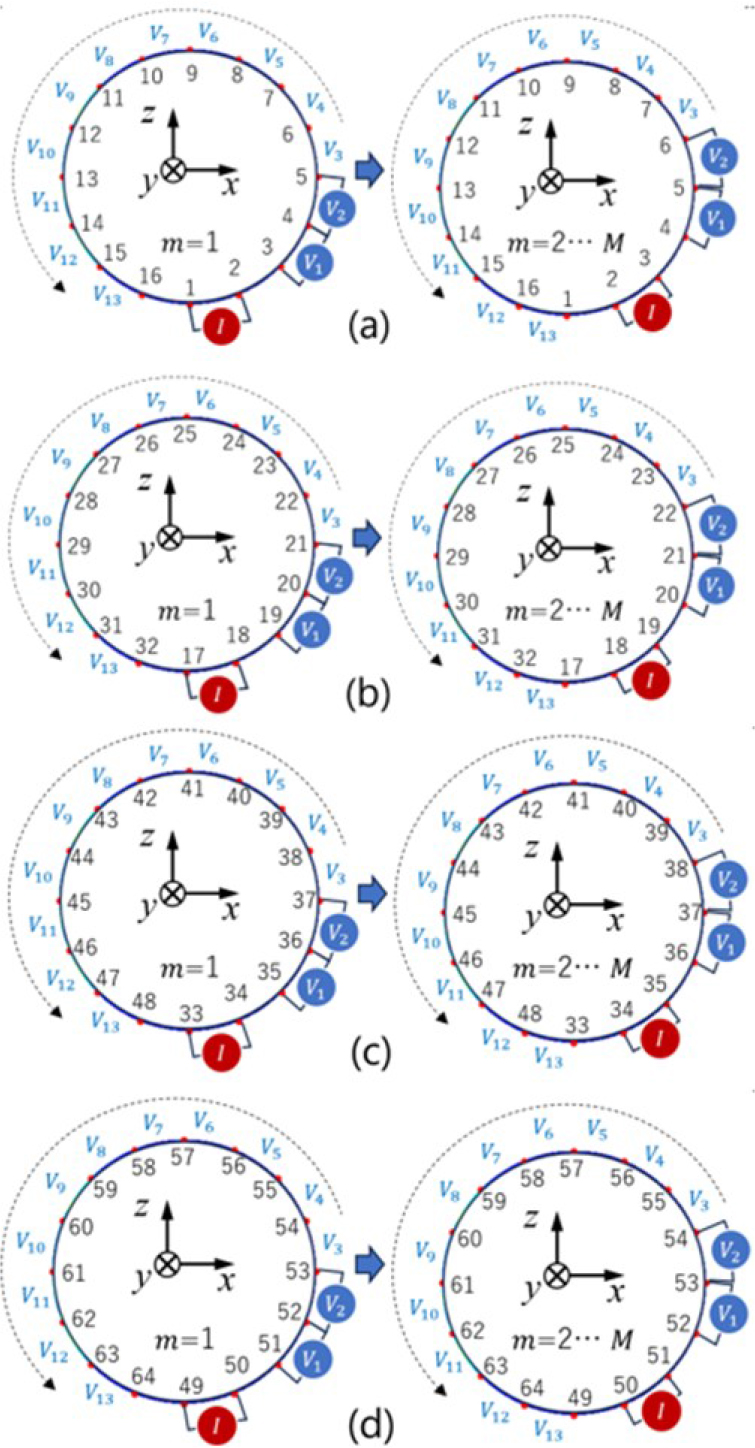
Fig. 4:
Adjacent pattern in simulation [25]
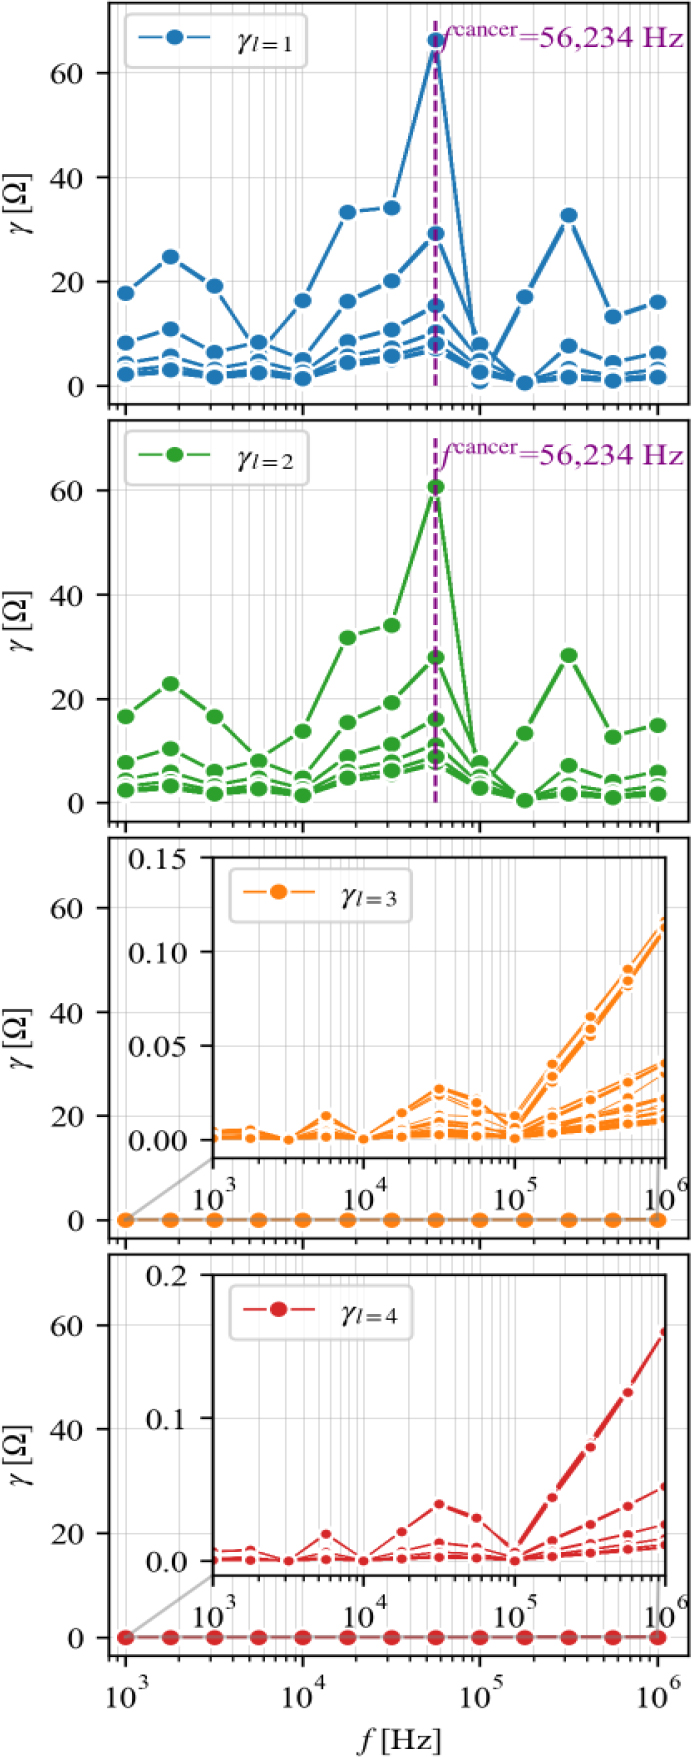
Fig. 5:
The determination of the frequency for cancer detection fcancer in the simulation study
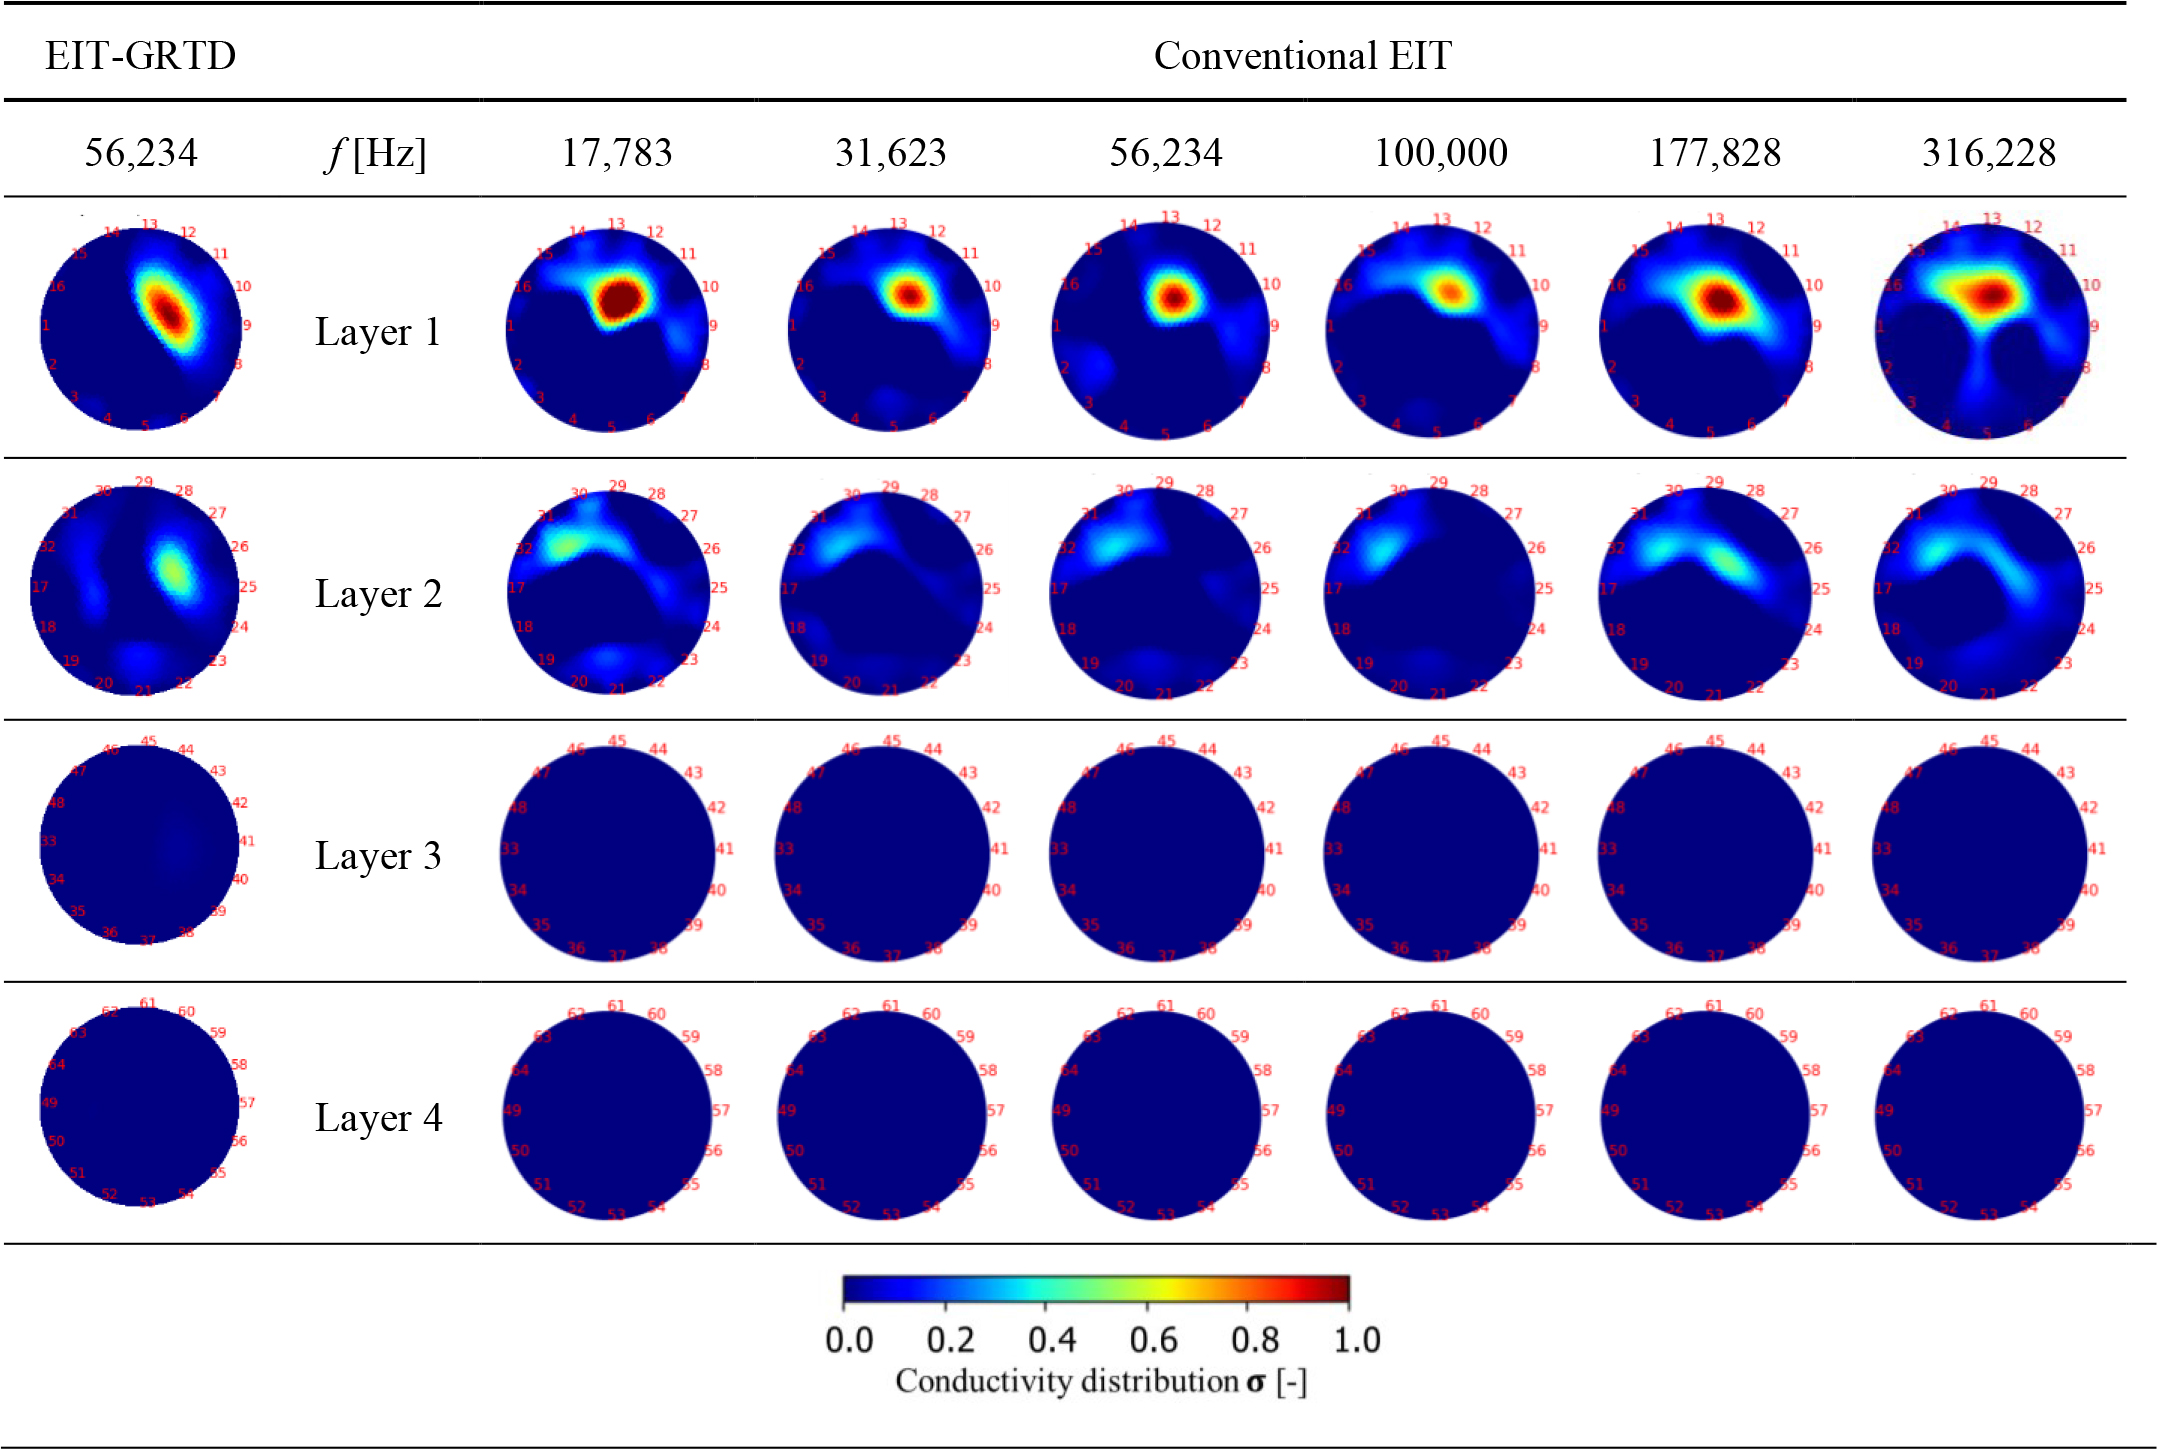
Fig. 6:
Image reconstruction result by time constant enhancement breast imaging at fcancer = 56,234 Hz and conventional EIT
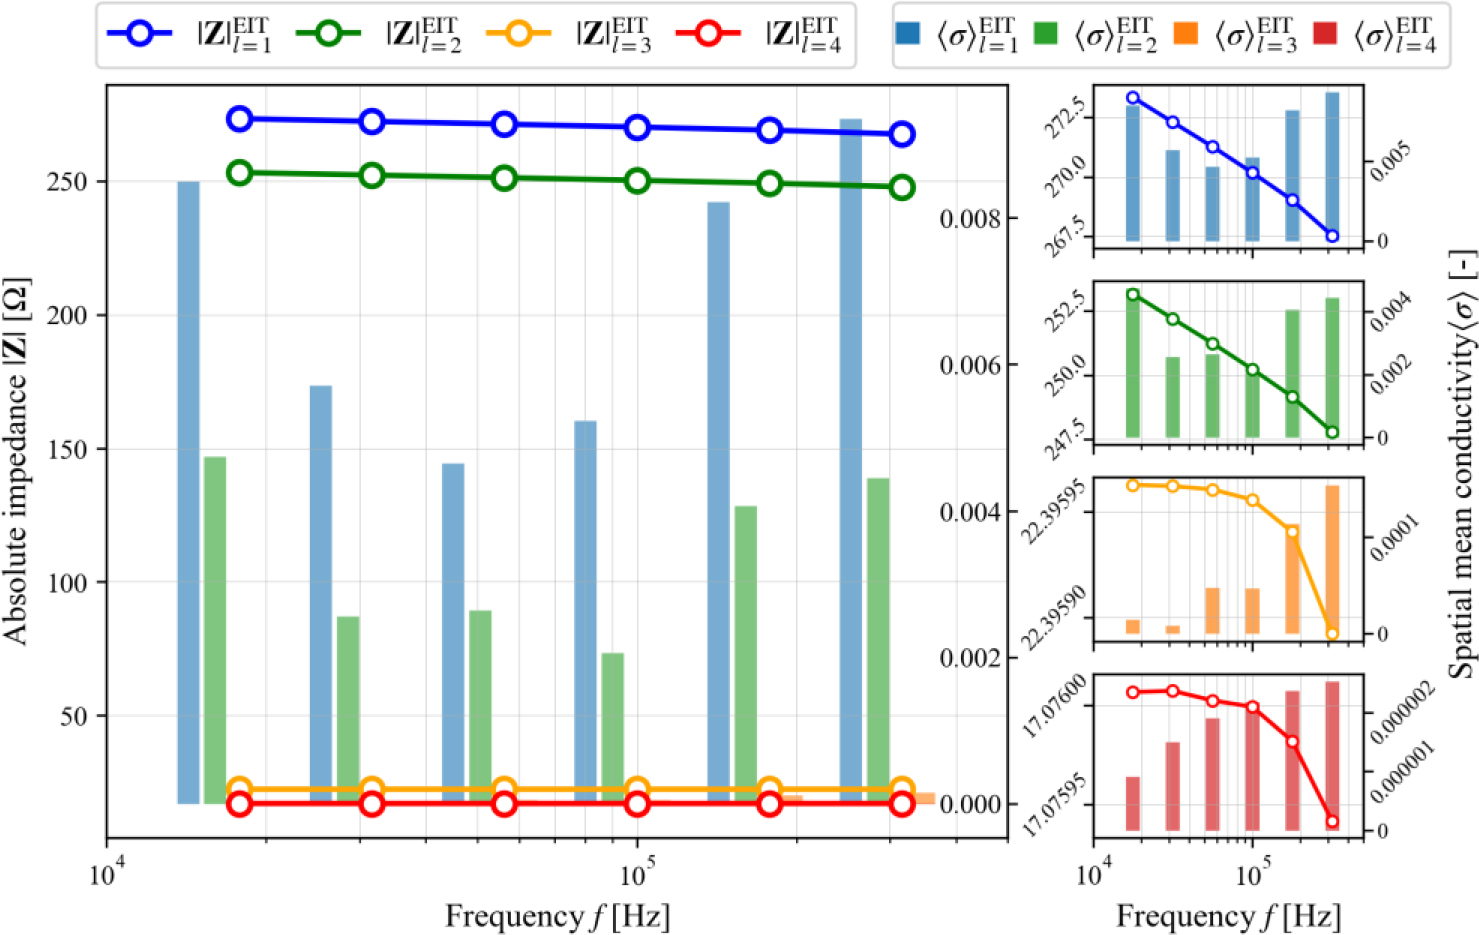
Fig. 7:
Absolute impedance |Z| and spatial mean conductivity 〈σ〉 plot in all layers