
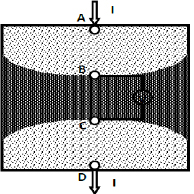
Figure 1:
Tetra-polar impedance measurement scheme [3].
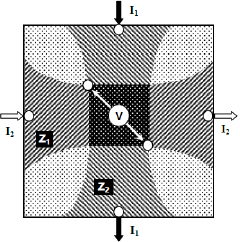
Figure 2:
Basic concept of FIM-6 [3].
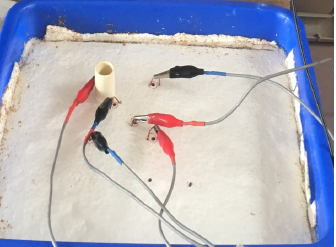
Figure 3:
Photograph of the phantom used in the study. Tap water of about 1cm height covers the base made with a cork sheet (foam plastic). The plastic pipe shown is an insulating object which was placed at different points to measure the sensitivity of the system.
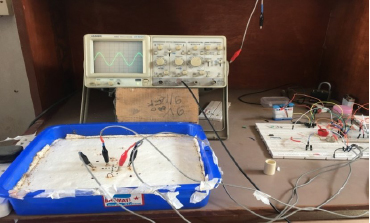
Figure 4:
A laboratory set up for Phantom study.
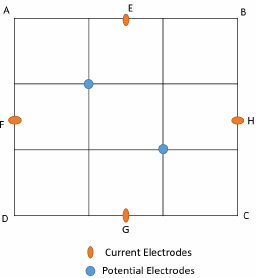
Figure 5:
Placement of electrodes for FIM-6 phantom study.
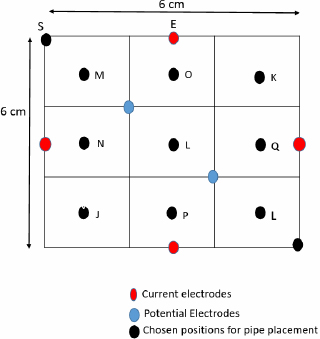
Figure 6:
Positions for object placement for TPIM and FIM-6 phantom study.
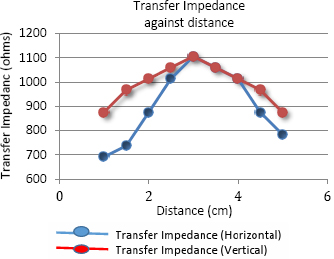
Figure 7:
Transfer Impedance against distance for linear TPIM for the measurement along horizontal and vertical directions.
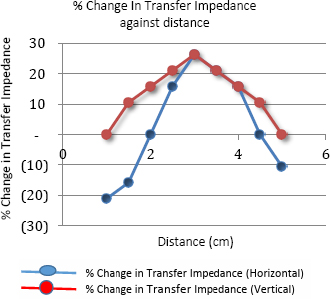
Figure 8:
Percentage change in Transfer Impedance against distance for linear TPIM along and perpendicular direction of electrode arrangement.
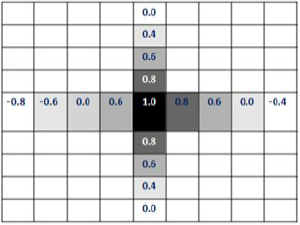
Figure 9:
Matrix Representations of Normalized Changes of Transfer Impedance for Linear TPIM.
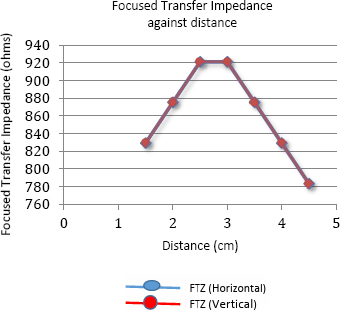
Figure 10:
Focused Transfer Impedance against a distance measured along both horizontal and vertical directions.
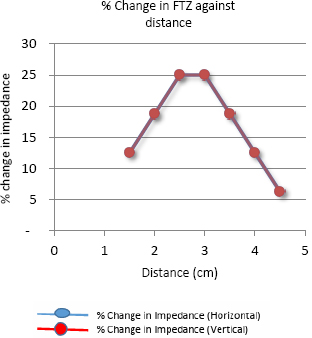
Figure 11:
Percentage Change in FTZ against distance for Horizontal and vertical direction of measurement
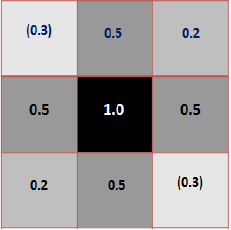
Figure 12:
Matrix Representation of Normalized Values for FIM-6 arrangements measured along chosen positions.
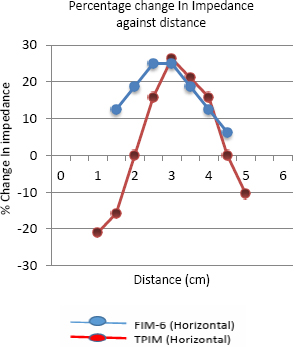
Figure 13:
Percentage change in Impedance against distance for the Horizontal measurement of TPIM and FIM-6 configuration.
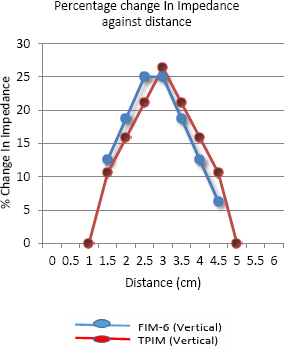
Figure 14:
Percentage change in Impedance against a distance measured for the perpendicular direction of the electrode arrangement of TPIM and FIM-6 configuration.