
Table 1:
Descriptive characteristics of the participants.
| Group | Female | Male | Age range (years) | Mean (years) |
|---|---|---|---|---|
| 1 | 10 | 10 | 18-25 | 21.05 ± 1.62 |
| 2 | 10 | 10 | 30-40 | 35.10 ± 2.93 |
| 3 | 10 | 10 | 50-70 | 61.80 ± 3.71 |
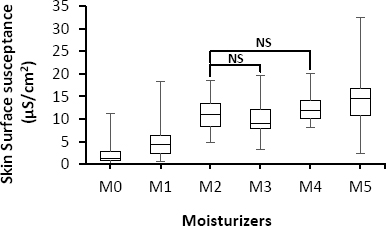
Fig. 1:
Box-plot with medians, quartiles, and the min and max as whiskers, showing variation in skin surface susceptance in relation to the five different types of moisturizers, NS = p > 0.05.
Table 2:
Percentage of increases in skin surface susceptance after application of five different moisturizers.
| M1/M0 | M2/M0 | M3/M0 | M4/M0 | M5/M0 |
|---|---|---|---|---|
| 289.72 | 1074.82 | 935.08 | 1245.10 | 1349.17 |
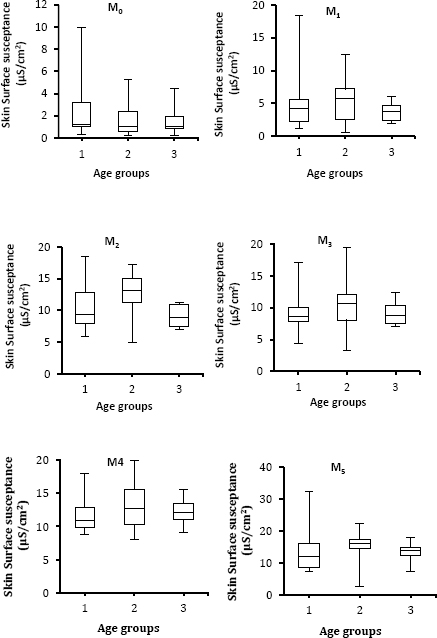
Fig. 2:
Boxplots with medians, quartiles, and the min and max as whiskers, showing variation in skin surface susceptance in relation to the different age groups for different moisturizers.
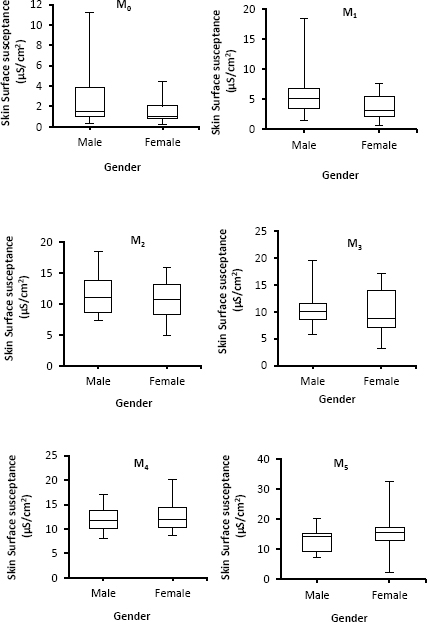
Fig. 3:
Boxplots with medians, quartiles, and the min and max as whiskers, showing variation in skin surface susceptance in relation to the different genders for different moisturizers.