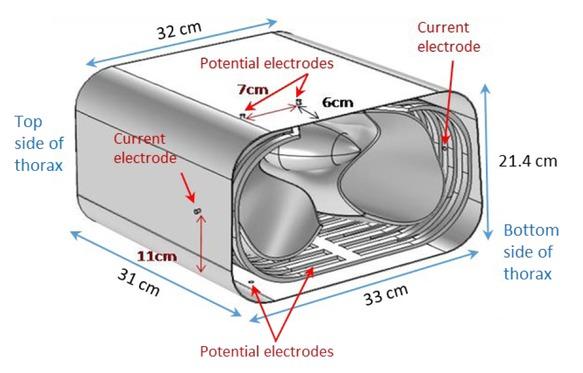
Have a personal or library account? Click to login

Probing deep lung regions using a new 6-electrode tetrapolar impedance method

Open Access
|Jan 2023

Figures & Tables

Fig.1

Electrode connections for transfer impedance measurement using the 6-electrode TPIM technique (left, 1a) and that for a 4 electrode TPIM (right, 1b) used for comparison. The sensitive regions are indicated in dark red, shades representing qualitative magnitudes (not to scale). Reproduced from [9] with permission.

Fig.2

3D schematics of the simulated 6-electrode TPIM configuration in a rectangular volume conductor.

Fig.3

Near to real life 3D model of the thorax. The positioning of electrodes for the measurements undertaken are also shown. Reproduced from [17] with permission.

Fig.4

Some details of a cross section of the modelled thorax. Reproduced from [17] with permission.

Fig.5

Sensitivity distribution along XY (horizontal) plane at for Z=6 cm for 4-electrode TPIM (top) and 6-electrode TPIM (bottom) with potential electrode separation of 15cm. Sensitivity range truncated beyond −400 and +2000.

Fig.6

Normalised sensitivity values along the depth (ab) for 6-electrode TPIM and 4-electrode TPIM for the simple volume conductor model shown in Figure 2. That for the former has much better uniformity at the deep regions compared to that for the latter.

Fig.7

Normalised sensitivity values along the width (cd) for 6-electrode TPIM and 4-electrode TPIM for the simple volume conductor model shown in Figure 2. Both have exactly the same sensitivity, with the highest at the cross point of ab and cd.

Fig.8

Sensitivity distribution over the lungs for 6-electrode TPIM (6-TPIM) and 4 electrode TPIM (4-TPIM) for inspired lung (left column) and expired lung (right column) in the cross sectional plane of the electrodes, as obtained for the life like thorax model with different Electrode Separations (ES). Shades of brown indicate higher sensitivity, darker for higher values, while shades of blue indicate regions having negative sensitivity. 1st row: 6-TPIM, ES=7 cm, 2nd row: 4-TPIM, potential electrodes on front, ES=7 cm, 3rd row: 4-TPIM, potential electrodes on back, ES=7 cm, 4th row: 6-TPIM, ES=10 cm.

Fig.9

6-electrode TPIM covering both lung regions. Reproduced from [9] with permission.

Simulation results for potential electrode separation of 7 cm

6-TPIM4-TPIM, Front4-TPIM, back
InspiredExpired% change*InspiredExpired% change*InspiredExpired% change*
Total Imp, Ω10.67.834.710.48.030.410.67.737.9
% CLTI(1)24.235.6-32.120.531.2-34.128.340.4-29.8
% CLTI(2)25.038.0-34.122.235.3-37.128.241.2-31.5
% OCLTI3.66.8 8.213.4 -0.32.1

Simulation results for potential electrode separation of 10 cm

6-TPIM4-TPIM, Front4-TPIM, back
InspiredExpired% change*InspiredExpired% change*InspiredExpired% change*
Total Imp, Ω13.910.631.413.610.332.214.09.942.1
% CLTI(1)26.336.4-27.621.933.4-34.429.842.8-30.5
% CLTI(2)27.238.0-28.623.536.9-36.329.843.5-31.4
% OCLTI3.24.6 7.410.6 0.21.6

Ratio of values for 10 cm Electrode Separation to those for 7 cm ES

6-TPIM4-TPIM Front4-TPIM back
% CLTI(1) Inspiration1.091.071.05
% CLTI(1) Expiration1.021.071.06
%OCLTI Inspiration0.910.90
%OCLTI Expiration0.680.790.75
Language: English
Page range: 116 - 124
Submitted on: Dec 1, 2022
Published on: Jan 8, 2023
Published by: University of Oslo
In partnership with: Paradigm Publishing Services
Publication frequency: 1 times per year

© 2023 Mahjabin Mobarak, Muhammad Abdul Kadir, K Siddique-e Rabbani, published by University of Oslo
This work is licensed under the Creative Commons Attribution 4.0 License.