
Fig. 1
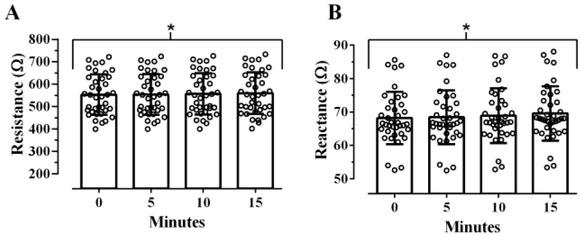
Fig. 2
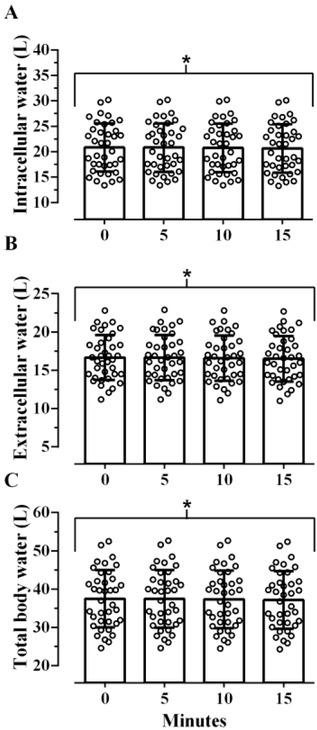
Fig. 3
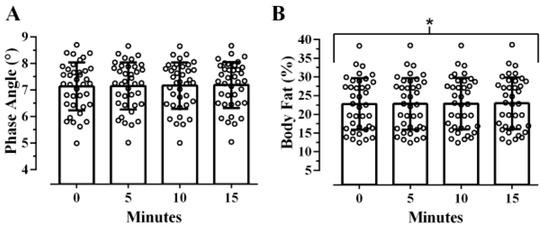
Fig. 4
Fig. 5
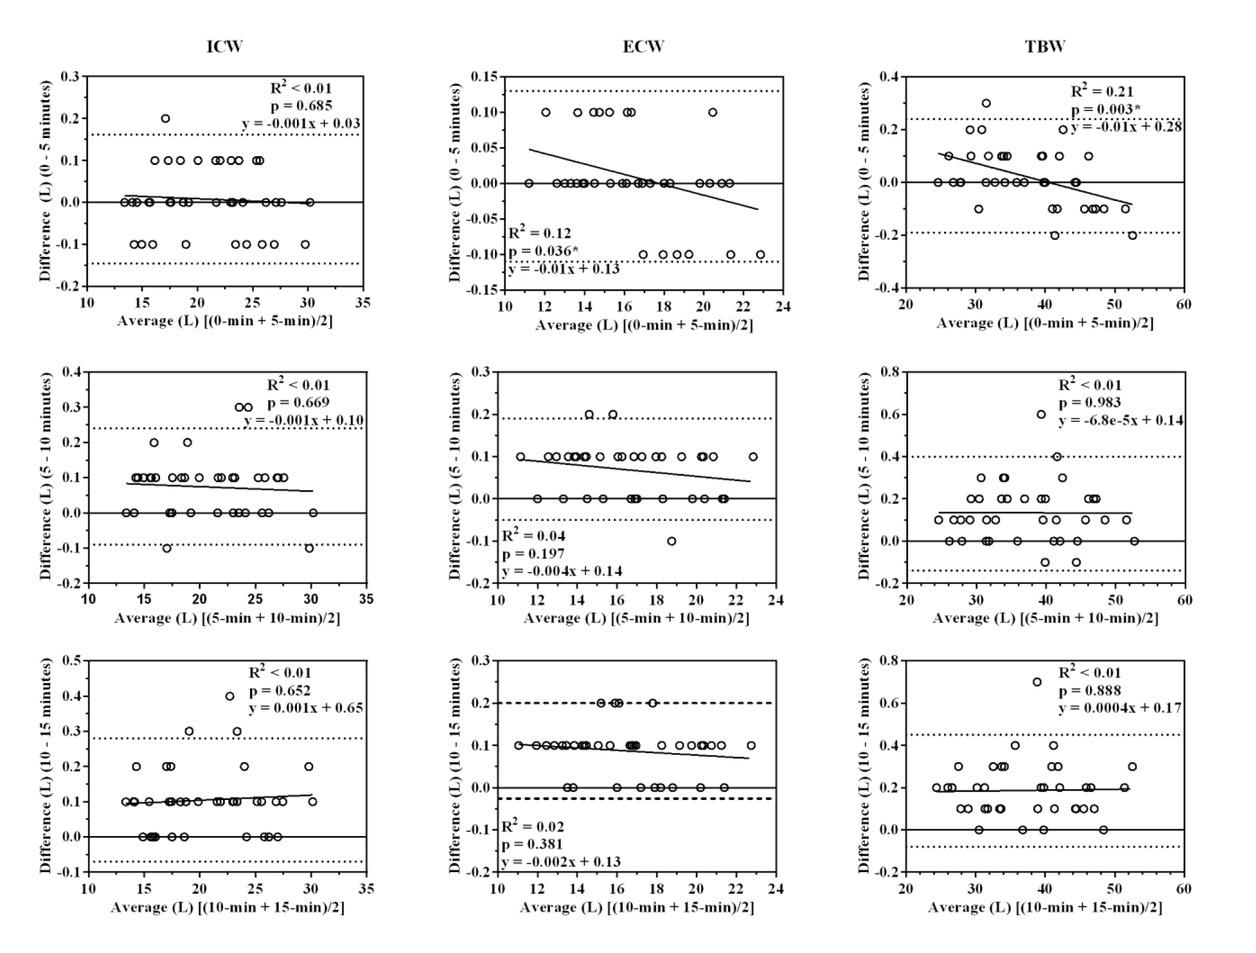
Fig. 6
Average bioelectrical variables as assessed by the RJL Quantum Legacy device (N=38)
| Variable | Time since transitioning from a vertical to a supine position | |||
|---|---|---|---|---|
| 0 min | 5 min | 10 min | 15 min | |
| R (Ω) | 553.2±90 | 554.1±91 | 556.9±92 | 560.4±93* |
| Xc (Ω) | 68.2±7.8 | 68.4±8.1 | 68.9±8.1* | 69.6±8.1* |
| ICW (L) | 20.9±4.8 | 20.9±4.8 | 20.8±4.8* | 20.7±4.8* |
| ECW (L) | 16.5±2.9 | 16.5±2.9 | 16.4±2.9* | 16.3±2.9* |
| TBW (L) | 37.4±7.5 | 37.4±7.6 | 37.2±7.6* | 37.0±7.6* |
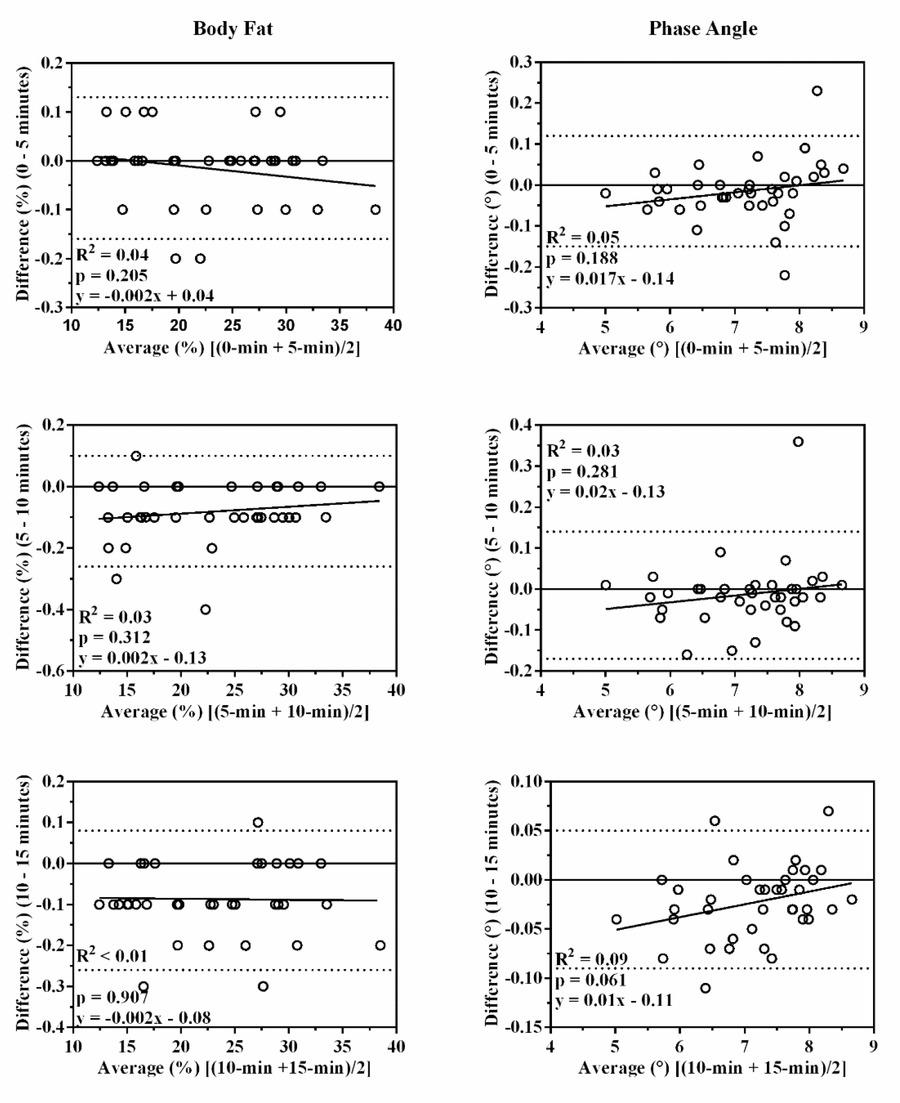
| PhA (°) | 7.13±0.9 | 7.14±0.9 | 7.16±0.9 | 7.18±0.9 |
| BF (%) | 22.4±6.8 | 22.4±6.8 | 22.5±6.8* | 22.5±6.8* |
Participant demographics (mean ± SD)_
| Men (n=16) | Women (n=22) | Total (N=38) | |
|---|---|---|---|
| Age (years) | 24.2 ± 3.9 | 22.8 ± 4.3 | 23.4 ±4.1 |
| Height (cm) | 177.7 ± 4.7 | 167.7 ± 9.0 | 171.9 ± 8.9 |
| Body Mass (kg) | 78.9 ± 10.2 | 65.0 ± 12.1 | 70.9 ± 13.2 |
| Body Mass Index (kg/m2) | 25.0 ± 4.6 | 23.1 ± 1.5 | 23.8 ± 3.3 |