
Figure 1
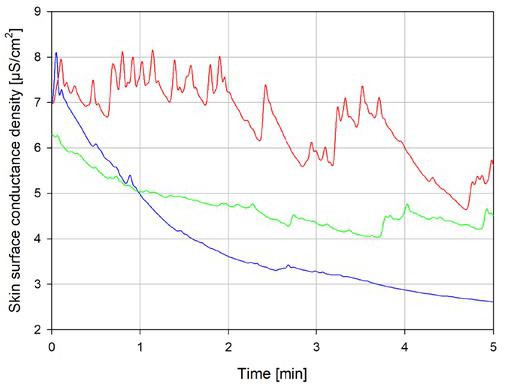
Figure 2
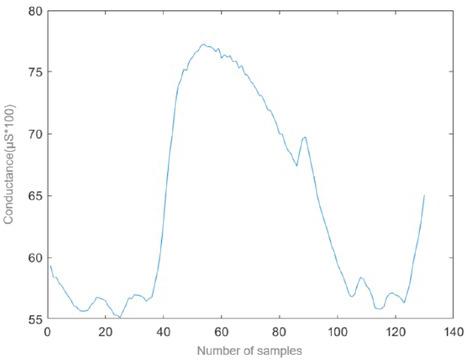
Figure 3
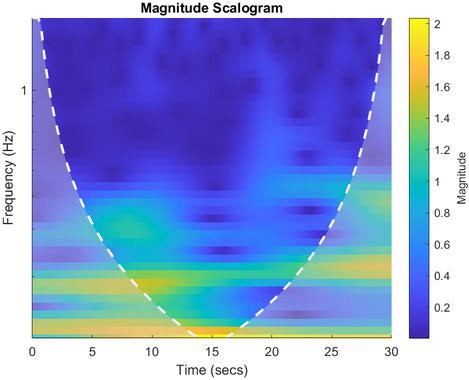
Figure 4
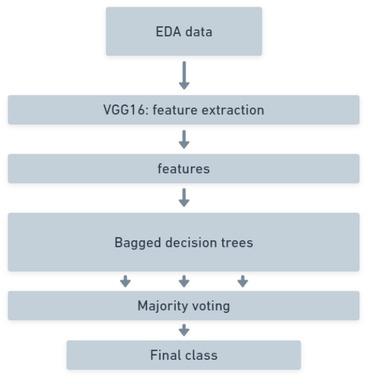
Figure 5
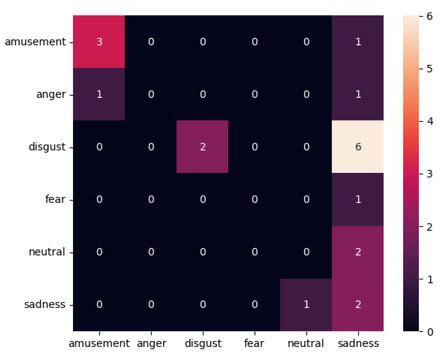
Figure 6
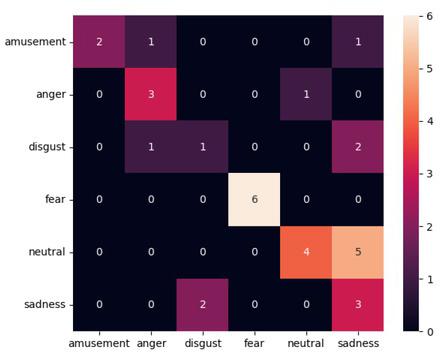
Figure 7
Results using the full CWT applied EDA dataset with synthetic data_ The parameters are set to: test size = 20 and trees = 100_
| test size = 20 | trees = 100 | ||||
|---|---|---|---|---|---|
| precision | recall | f1-score | support | ||
| amusement | 1.00 | 0.50 | 0.67 | 4 | |
| anger | 0.60 | 0.75 | 0.67 | 4 | |
| disgust | 0.33 | 0.25 | 0.29 | 4 | |
| fear | 1.00 | 1.00 | 1.00 | 6 | |
| neutral | 0.80 | 0.44 | 0.57 | 9 | |
| sadness | 0.27 | 0.60 | 0.37 | 5 | |
| accuracy | 0.59 | 32 | |||
| macro avg | 0.67 | 0.59 | 0.59 | 32 | |
| weighted avg | 0.70 | 0.59 | 0.61 | 32 | |
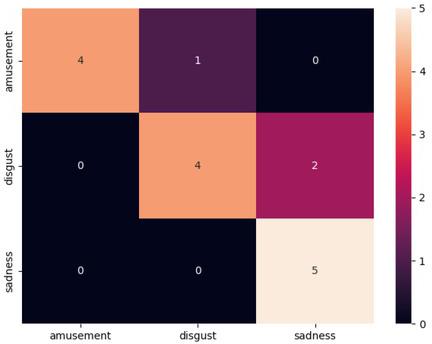
Results using the 3 class CWT EDA data with synthetic data_ Test size = 20 and trees = 300_
| test size = 20 | trees = 600 | ||||
|---|---|---|---|---|---|
| precision | recall | f1-score | support | ||
| amusement | 1.00 | 0.80 | 0.89 | 5 | |
| disgust | 0.80 | 0.67 | 0.73 | 6 | |
| sadness | 0.71 | 1.00 | 0.83 | 5 | |
| accuracy | 0.81 | 16 | |||
| macro avg | 0.84 | 0.82 | 0.82 | 16 | |
| weighted avg | 0.84 | 0.81 | 0.81 | 16 | |
Results using the CWT treated EDA data with test size = 20 and trees = 100_
| test size = 20 | trees = 100 | ||||
|---|---|---|---|---|---|
| precision | recall | f1-score | support | ||
| amusement | 0.75 | 0.75 | 0.75 | 4 | |
| anger | 0.00 | 0.00 | 0.00 | 2 | |
| disgust | 1.00 | 0.25 | 0.40 | 8 | |
| fear | 0.00 | 0.00 | 0.00 | 1 | |
| neutral | 0.00 | 0.00 | 0.00 | 2 | |
| sadness | 0.15 | 0.67 | 0.25 | 3 | |
| accuracy | 0.35 | 20 | |||
| macro avg | 0.32 | 0.28 | 0.23 | 20 | |
| weighted avg | 0.57 | 0.35 | 0.35 | 20 | |
Category of emotion and how many times the emotion was reported_
| Emotion | Number of samples |
|---|---|
| Amusement | 20 |
| Anger | 9 |
| Disgust | 24 |
| Fear | 5 |
| Neutral | 15 |
| Sadness | 26 |
| Tenderness | 1 |