
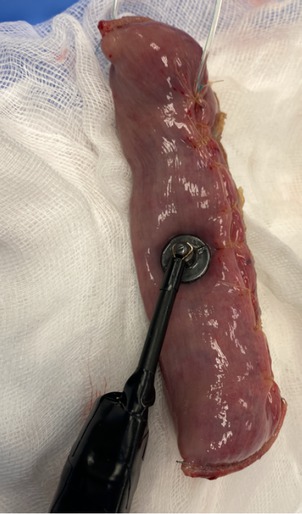
Figure 1
Experiment set-up. Human intestine sample under measurement.
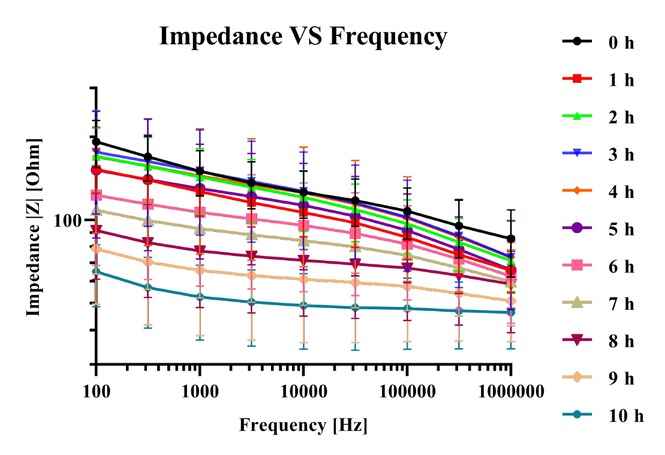
Figure 2
Plot of mean impedance values with 95 % confidence interval against frequency for 0 to 10 hours duration.
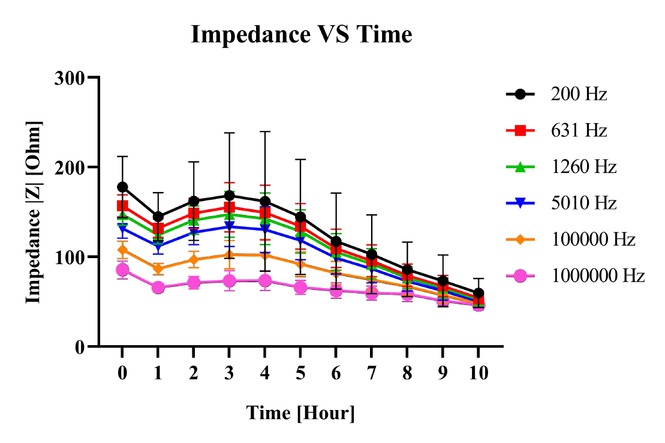
Figure 3
Plot of mean impedance values with 95 % confidence interval against time (0 to 10 hours) for selected frequencies.
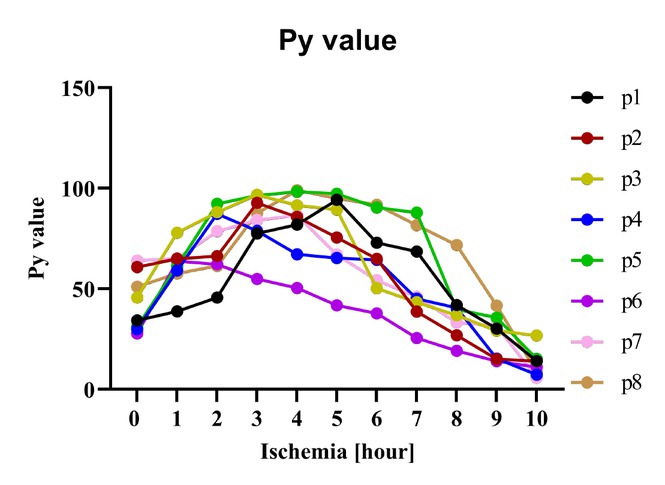
Figure 4
Plot of calculated Py value for eight small intestine samples from different patients.