
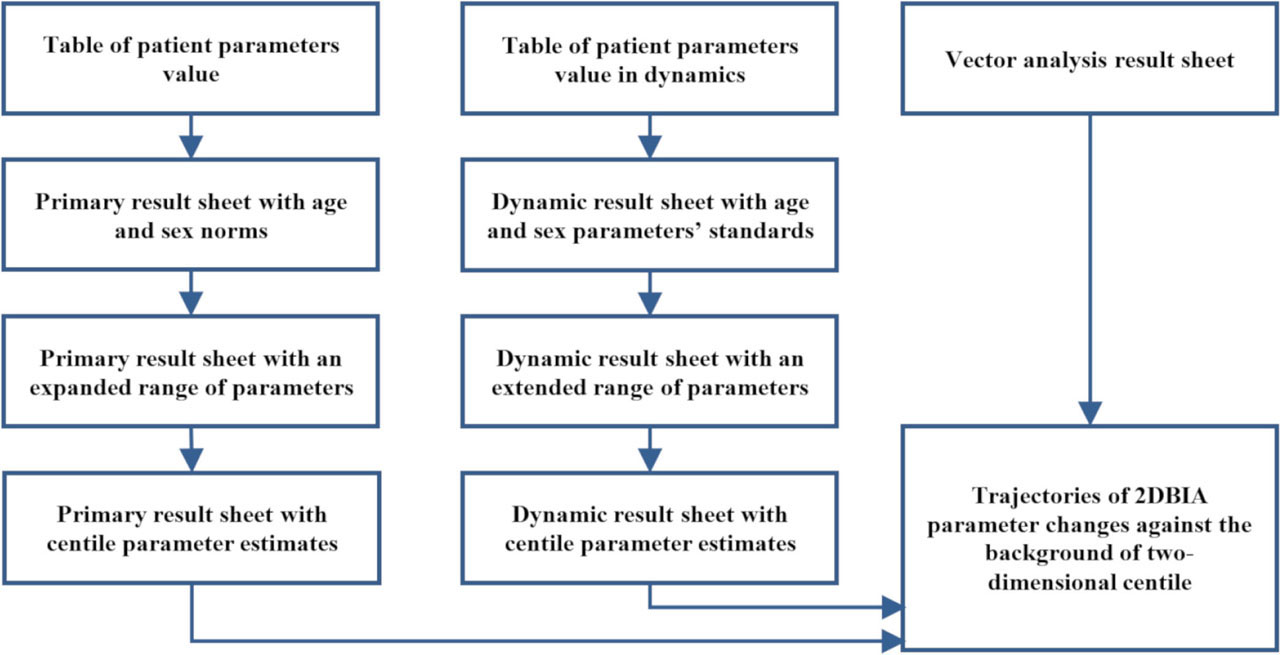
Fig. 1
Main stages of the BIA result sheets presentation evolution.
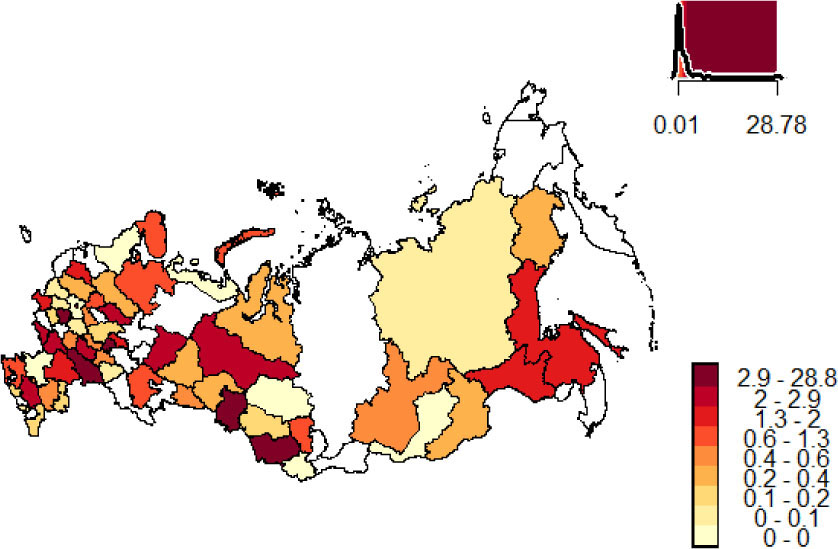
Fig. 2
Distribution of data by subjects of the Russian Federation as a percentage of the total volume of analyzed data.
Table 1
Median and quartile values of the main bioimpedance parameters used
| Total | Children (5–17 years old) | Adult (18–85 years old) | ||||
|---|---|---|---|---|---|---|
| Sex, N | Men 367,593 | Women 757,075 | Boys 185,927 | Girls 174,815 | Men 181,666 | Women 582,260 |
| Age, years | 17.8 [12.2; 44.9] | 43.8 [19.4; 58.2] | 12.3 [9.2; 15.3] | 12.4 [9.2; 15.5] | 45.3 [29.3; 58.4] | 51.6 [36.9; 61.2] |
| Height, cm | 170 [153; 177] | 160 [155; 165] | 153 [136; 171] | 154 [135; 163] | 175 [170; 179] | 161 [157; 165] |
| Weight, kg | 67 [46; 82] | 66 [54; 79] | 47 [32; 62] | 45 [31; 55.2] | 80 [71; 91.6] | 71 [61; 83] |
| BMI, kg/m2 | 22.8 [18.8; 27.2] | 25.6 [20.9; 30.7] | 19.1 [16.6; 22.1] | 18.9 [16.4; 21.7] | 26.6 [23.5; 29.9] | 27.6 [23.4; 32] |
| R50, Ohm | 539 [473; 635] | 586 [520; 663] | 623 [545; 702] | 696 [632; 764] | 484 [440; 533] | 560 [503; 622] |
| Xc50, Ohm | 64 [57; 72] | 66 [57; 76] | 67 [61; 75] | 75 [67; 83] | 61 [53; 68] | 63 [55; 72] |
| Phi50, deg. | 6.6 [5.9; 7.4] | 6.3 [5.8; 6.9] | 6.2 [5.7; 6.8] | 6.1 [5.6; 6.7] | 7.1 [6.4; 7.8] | 6.4 [5.9; 7] |
| R5, Ohm | 677 [591; 764] | 730 [638; 815] | 695 [614; 775] | 772 [700; 844] | 543 [479; 599] | 623 [547; 694] |
| FFM, kg | 53.9 [35.7; 62.3] | 44.2 [39.5; 48.9] | 36.0 [25.7; 49.5] | 33.6 [24.2; 40] | 61.4 [56.3; 67.1] | 45.8 [42.2; 50.1] |
| FM, kg | 13.2 [7.4; 21.1] | 21.7 [13.9; 30.8] | 8.6 [5.2; 13.5] | 10.9 [6.2; 16] | 19.1 [13.0; 26.0] | 25.2 [17.9; 33.3] |
| FM, % | 21.5 [15.9; 27.6] | 33.1 [26.0; 39.3] | 19.2 [14.6; 25.3] | 25.0 [19.4; 30.3] | 23.9 [18.1; 29.0] | 35.5 [29.2; 40.8] |
| SMM, % | 51.6 [48.3; 55.7] | 43.7 [39.9; 47.1] | 54.9 [48.5; 58.6] | 45.2 [35.5; 49.2] | 50.3 [48.3; 52.7] | 43.5 [40.4; 46.4] |
| TBW, l | 39.4 [26.1; 45.6] | 32.4 [28.9; 35.8] | 26.4 [18.9; 36.3] | 24.6 [17.9; 29.3] | 44.9 [41.2; 49.1] | 33.6 [30.9; 36.7] |
| ECW, l | 12.6 [9.3; 16.2] | 12.2 [9.7; 14.1] | 11.6 [9.0; 15.2] | 11.0 [8.6; 12.8] | 17.9 [16.2; 20.0] | 14.3 [12.9; 16.1] |
| ICW, l | 15.0 [9.7; 22.3] | 15.4 [10.2; 18.6] | 13.5 [9.3; 20] | 12.7 [8.6; 16] | 27.5 [25.0; 30.1] | 19.1 [17.6; 20.8] |
| ACM, kg | 30.7 [19.2; 36.7] | 24.5 [21.5; 27.5] | 19.4 [13.7; 27.9] | 18.2 [12.9; 22.4] | 36.1 [32.4; 40] | 25.5 [23.1; 28.3] |
| iFM, kg/m2 | 4.8 [3.0; 7.3] | 8.4 [5.4; 11.9] | 3.5 [2.5; 5.4] | 4.7 [3.2; 6.4] | 6.3 [4.3; 8.5] | 9.7 [6.9; 12.9] |
| iFFM, kg/m2 | 18.0 [15.2; 20.4] | 17.1 [15.2; 18.9] | 15.3 [13.7; 17.1] | 14.1 [12.9; 15.6] | 20.2 [18.7; 21.9] | 17.8 [16.3; 19.4] |
| BMR, kcal/m2 | 1586 [1224; 1775] | 1390 [1295; 1485] | 1230 [1047; 1498] | 1191 [1023; 1323] | 1755 [1639; 1881] | 1421 [1347; 1510] |
[i] BMI – body mass index, R50 – 50 kHz resistance, Xc50 – 50 kHz reactance, Phi50 – 50 kHz phase angle, R5 – 5 kHz resistance, FFM – fat free mass, FM – fat mass, percent from weight, SMM - skeletal muscle mass, percent from fat-free mass, TBW – total body water, ECW – extracellular water, ICW – intracellular water, ACM – active cell mass, iFM – fat mass index, iFFM – fat-free mass index, BMR – basal metabolic rate.
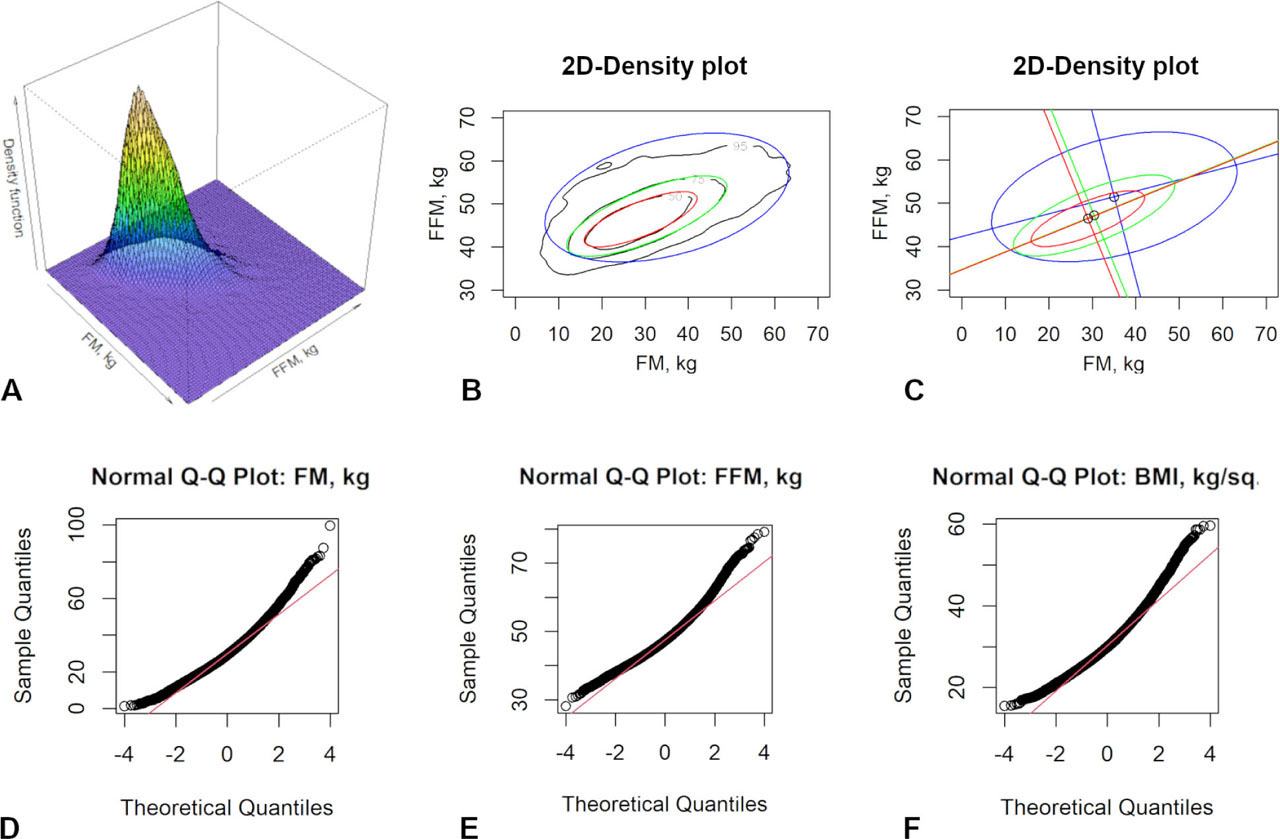
Fig. 3
Visual representations of the two-dimensional density distribution of Fat mass and Fat free mass (A–C) and normal quantile-quantile plots (D–F) in 57-year-old women (data for 15,434): A. a three-dimensional graph of the density distribution, B. flat sections containing inside 50%, 75% and 95% of data (black lines are sections obtained directly from the data, colored lines are calculated ellipses), C. axes and centers of tolerance ellipses, D. a normal quantile-quantile plot of Fat mass, E. a normal quantile-quantile plot of Fat free mass, F. a normal quantile-quantile plot of Body mass index.
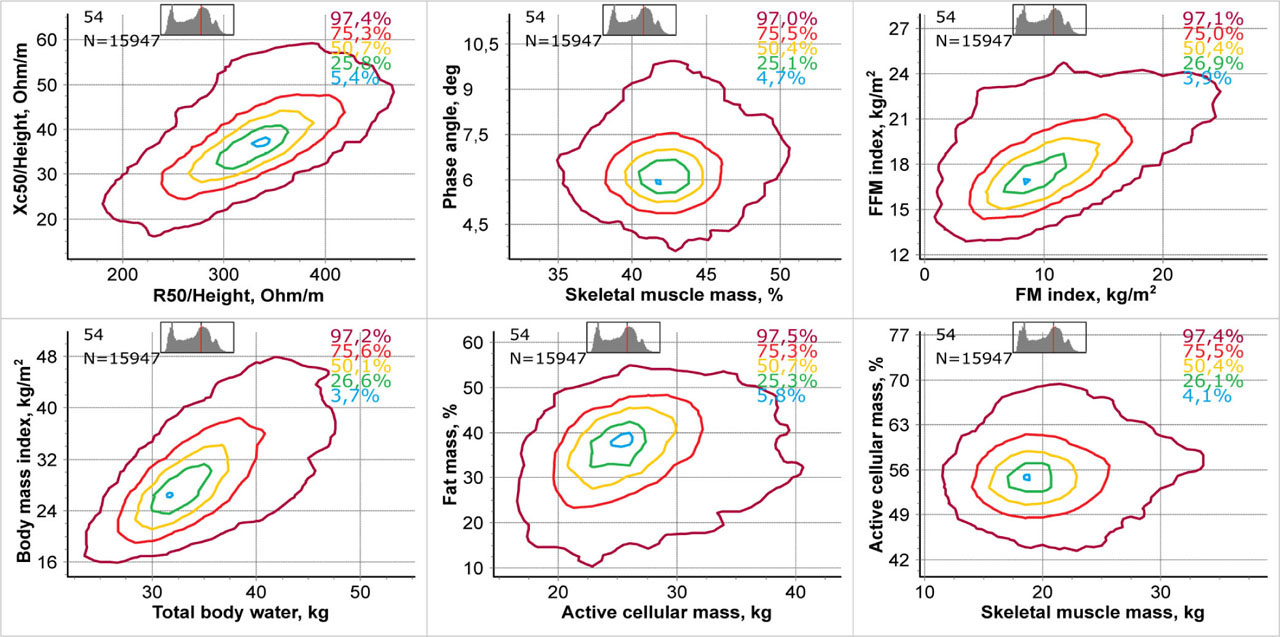
Fig. 4
An example of visualization of a bioimpedance study on 12 parameters, with centile lines arranged in two-dimensional graphs constructed from data of 15,947 women aged 54 full years.
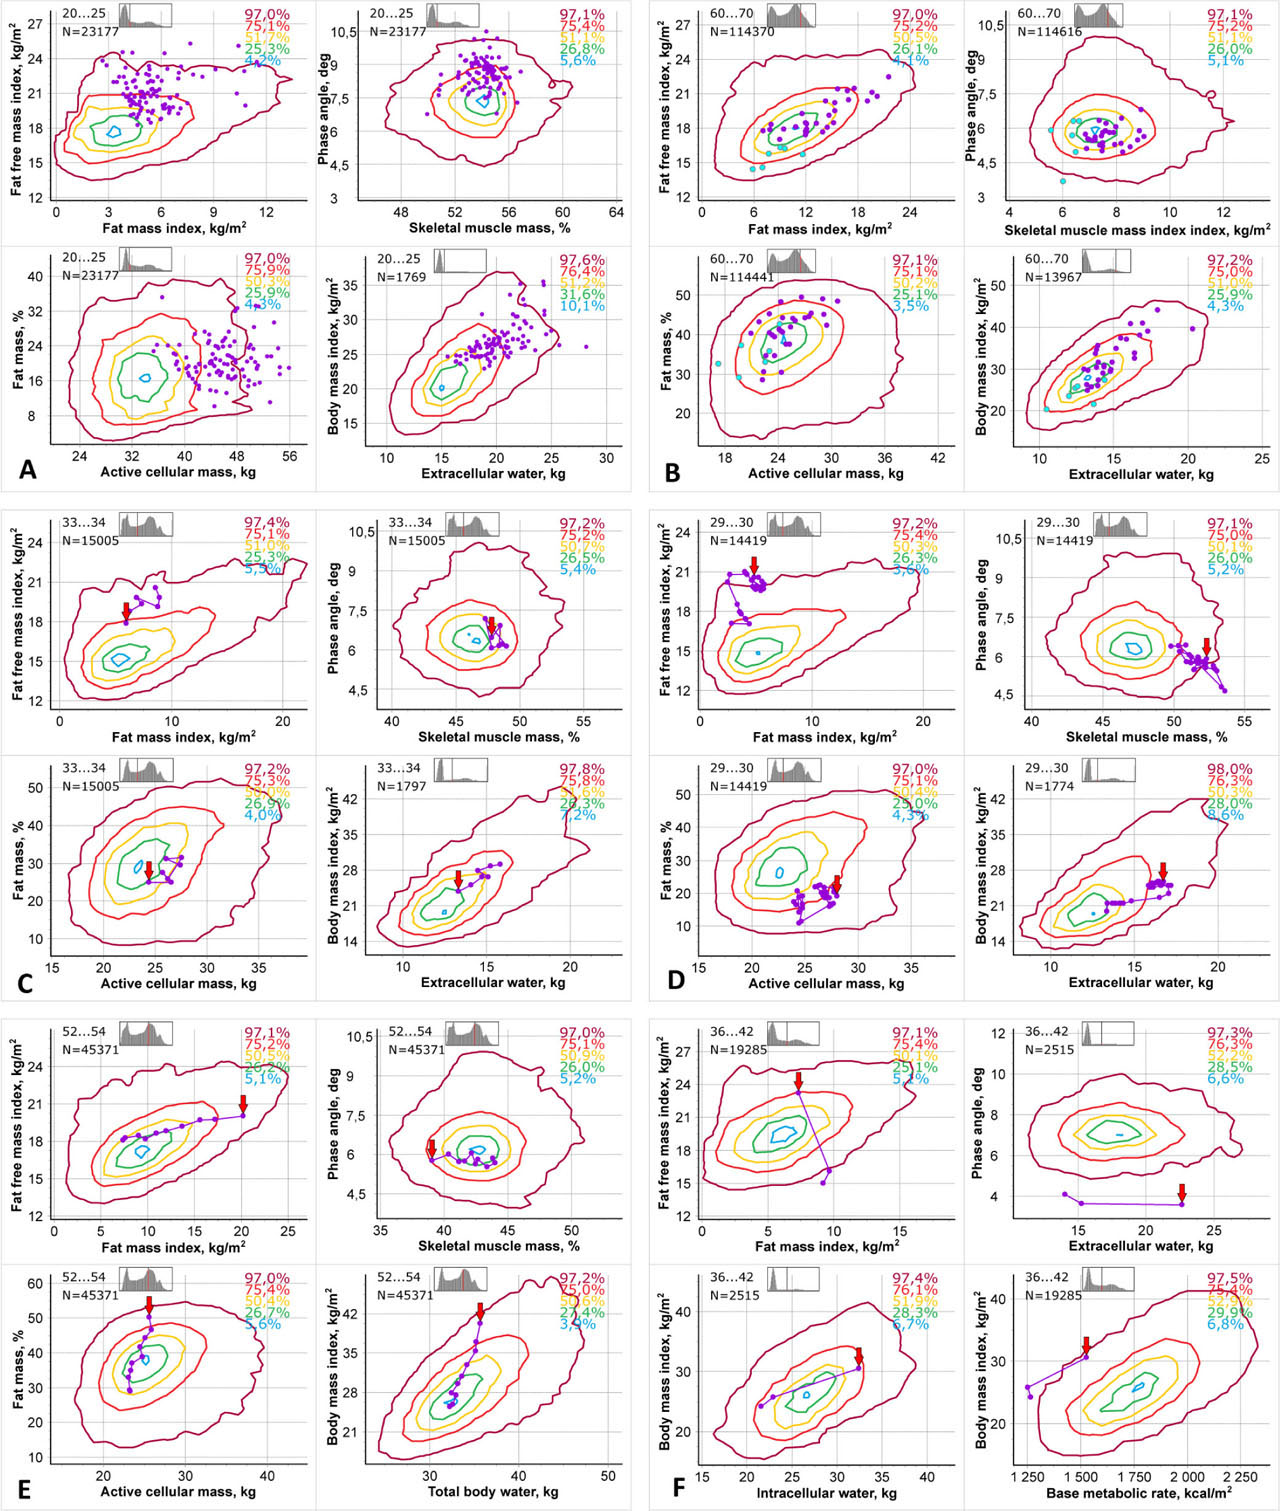
Fig. 5
Examples of “2DBIA” visualization of bioimpedance examination by 8 parameters, with centile lines, arranged in two-dimensional graphs.
Every point corresponds individual examination data. Dynamic observation of one patient is presented by line connected points. The arrow marks to the first examination point.
A. Data on a group of professional rugby players, 97 men 20–25 years old.
B. Data on a group of diabetic patients 60–70 years old. Pink points belong to 59 non-sarcopenic patients, blue points belong to 7 sarcopenic patients.
C. Data on a healthy pregnant woman 33 years old from 11th to 37th weeks of gestation. The points correspond to 11th (marked with an arrow), 16th, 22nd, 26th, 30th, 34th, 37th weeks of gestation.
D. Data on a pregnant woman 29 years old with a preeclampsia. Examinations were made daily from 30th week of gestation to the delivery at the 32nd week of gestation and on 2nd, 3rd, 4th, 5th, 8th, 9th, 10th, 11th, 12th and 15th day postpartum.
E. Data on fat mass reduction in a 52 years old woman without any recorded associated diseases.
F. Data on an intensive care unit patient with edema.