
Fig 1
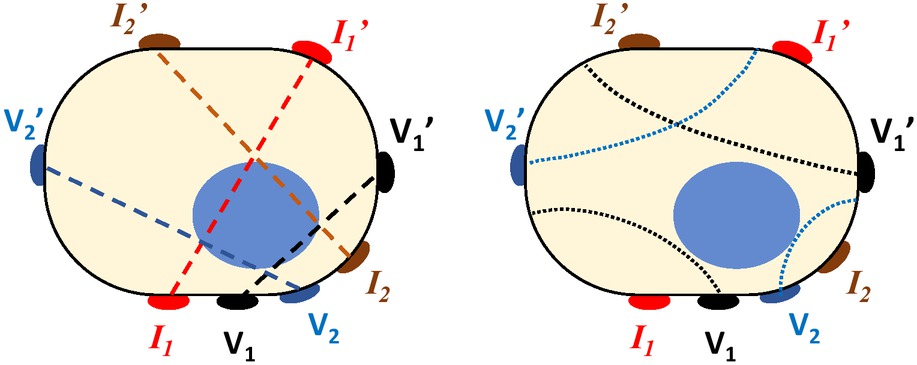
8-electrode FIM to localise a deep target object in a volume conductor. Two pairs of electrodes indicated by I1-I1’ and V1-V1’ form the first TPIM configuration while I2-I2’ and V2-V2’ indicate the second TPIM. The average of the two TPIM values make the FIM [14]. The dashed lines in the left hand figure show the maximum current lines between respective pairs of electrodes, which also includes the potential measuring electrodes, while the dotted lines on the right hand figure show approximate equipotential lines through the potential measuring electrodes.
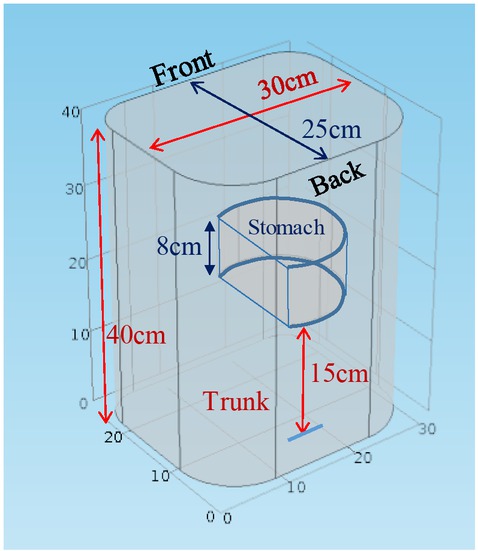
Fig 2
The simplified model for human trunk and an embedded stomach as used in the simulation. Some relevant dimensions are shown.
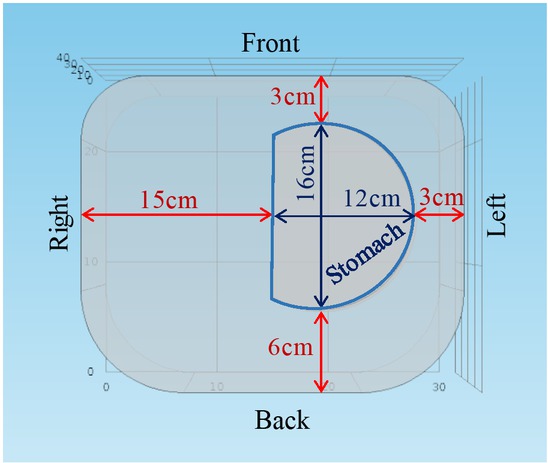
Fig 3
Cross sectional view of the trunk and the embedded stomach model as used in the simulation. The dimensions and position of the stomach are shown. The right and left side of the trunk are also indicated.
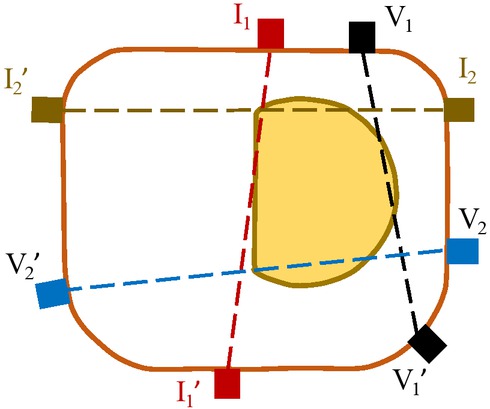
Fig 4
Cross sectional view showing the initial suggested positions of electrodes for the trunk and the embedded stomach model. The dashed straight lines represent the maximum current lines driven between the respective electrodes.
Table 1
Assumed electrical values for simulation. Frequency = 200 kHz. Current = 1 A.
| Electrical Properties | Background trunk volume* | Stomach volume** | Electrode (copper) |
|---|---|---|---|
| Conductivity (σ) [S/m] | 1.2 | 5 | 6 × 10⁷ |
| Relative Permittivity (ϵ) | 80 | 80 | 1 |
[i] * Equivalent to that of 0.9% saline at 200C, also for stomach in Simulation A.
** Equivalent to that of 3.5% Saline (sea water) at 200C, for simulation B.
Table 2
Geometrical parameters appropriate for the chosen model
| Volume of whole Trunk (including stomach) | 28430 cm3 |
| Volume of Stomach | 1293 cm3 |
| Stomach volume with respect to whole volume | 4.54 % |
| Horizontal Cross Sectional Area of Trunk | 711.4 cm2 |
| Horizontal Cross Sectional Area of Stomach | 161.4cm2 |
| Area of Stomach with respect to Area of Trunk | |
| (cross-sectional) | 22.69 % |
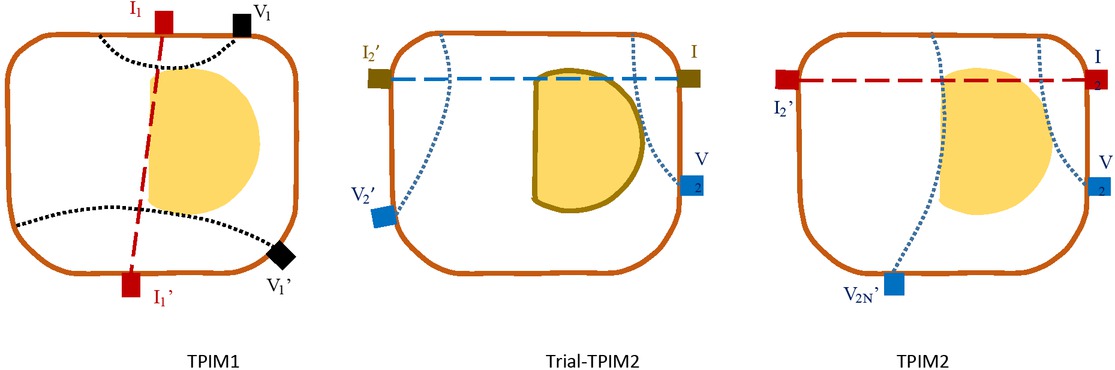
Fig 5
Visualization of electrode placement based on equipotential concept for both TPIM1 and TPIM2. Dashed lines show the maximum current lines through the current-drive electrodes. Dotted lines show approximate shape of equipotential lines through the potential electrodes due to the respective currents. For TPIM1, the equipotential lines bound the stomach region well. The equipotential lines for the electrode configuration for Trial-TPIM2 includes a large amount of background space on the left side of the stomach. For the new configuration of TPIM2, the lower potential electrode V2’ has been shifted to V2N’ based on equipotential visualization so that the stomach is bounded well between the two equipotential lines. This results in an improvement.
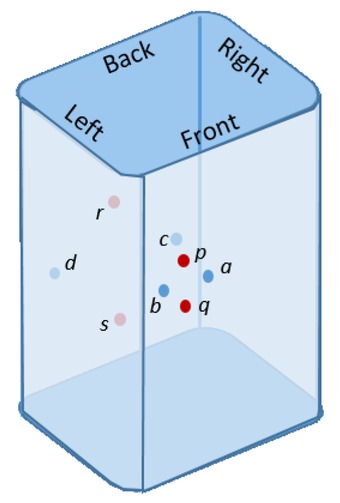
Fig 6
Orthogonal concentric TPIMs in the vertical plane.
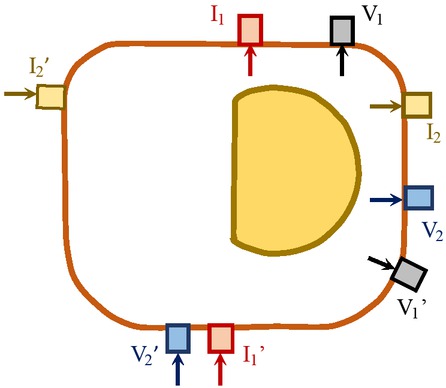
Fig 7
Geometrical reference points of electrodes, shown by arrows.
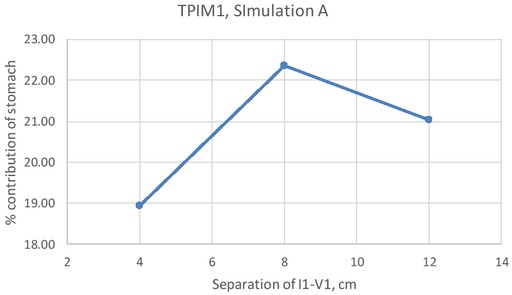
Fig 8
Percentage Contribution of stomach in Simulation-A for TPIM1 for varying separation of I1-V1
Table 3
Simulation-A for TPIM1 for varying separation of I1-V1 Electrode Co-ordinates for 3 separations: [I1:(16,25,19), V1:(20,25,19)]; [I1:(14,25,19), V1:(22,25,19)]; [I1:(12,25,19), V1:(24,25,19)]. Fixed [I1’=(16,-3,19); V1’=(29,6.5,19)] Direct straight-line separation for I1'-V1' = 15.4 cm
| Separation of I1-V1, cm | |||
|---|---|---|---|
| Simulated parameters | 4 | 8 | 12 |
| Maximum Sensitivity* | 7.71E+06 | 1.27E+06 | 8.99E+05 |
| Minimum Sensitivity* | -2.22E+06 | -3.66E+05 | -2.36E+05 |
| Total Impedance (ohm) | 3.23 | 1.57 | 1.07 |
| Stomach Impedance (ohm) | 0.61 | 0.35 | 0.23 |
| % Contribution of stomach | 18.94 | 22.36 | 21.04 |
[i] * values on the electrode plane (x-y plane) only
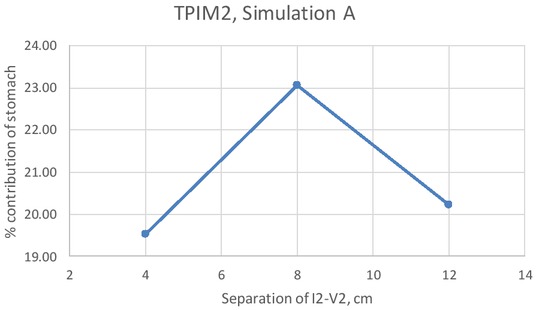
Fig 9
Percentage Contribution of stomach in Simulation-A for TPIM2 for varying separation of I2-V2
Table 4
Simulation-A for TPIM2 for varying separation of I2-V2 Electrode Co-ordinates for 3 separations: [I2:( 30,14,19), V2: (30,18,19)]; [I2:( 30,12,19), V2:( 30,20,19)]; [I2:( 30,10,19), V2: ( 30,22,19)]. Fixed [I1’=(13,-3,19), V1’=(2,21,19)] Direct straight-line separation for I2'-V2' = 24.7 cm
| I2-V2, cm | |||
|---|---|---|---|
| Simulated parameters | 4 | 8 | 12 |
| Max Sensitivity* | 9.65E+05 | 5.10E+05 | 4.01E+05 |
| Min Sensitivity* | -1.35E+07 | -2.99E+06 | -1.14E+06 |
| Total Impedance (ohm) | 3.08 | 1.63 | 1.06 |
| Stomach Impedance (ohm) | 0.60 | 0.38 | 0.21 |
| % Contribution of stomach | 19.53 | 23.07 | 20.22 |
[i] * values on the electrode plane (x-y plane) only
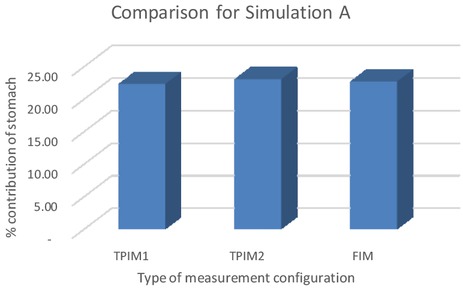
Fig 10
Percentage Contribution of stomach in Simulation-A for TPIM1, TPIM2 and FIM using the best combination of electrode configurations
Table 5
Simulation-A for FIM with best TPIM configurations Direct straight-line separations: I1-V1 = 8 cm, I1'-V1' = 15.4 cm, I2-V2 = 8 cm, I2'-V2' = 24.7 cm
| Simulated parameters | TPIM1 | TPIM2 | FIM |
|---|---|---|---|
| Max Sensitivity* | 1.27E+06 | 5.10E+05 | 6.40E+05 |
| Min Sensitivity* | -3.66E+05 | -2.99E+06 | -1.48E+06 |
| Total Impedance (ohm) | 1.57 | 1.63 | 1.60 |
| Stomach Impedance (ohm) | 0.35 | 0.38 | 0.36 |
| % Contribution of stomach | 22.36 | 23.07 | 22.73 |
[i] *values on the electrode plane (x-y plane) only
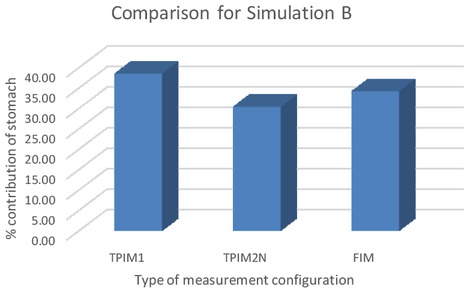
Fig 11
Percentage Contribution of stomach in Simulation-B for TPIM1, TPIM2 and FIM using the best combination of electrode configurations.
Table 6
Simulation-B for FIM with best TPIM configurations Direct straight-line separations: I1-V1 = 8 cm, I1'-V1' = 15.4 cm, I2-V2 = 8 cm, I2'-V2' = 24.7 cm
| Simulated parameters | TPIM1 | TPIM2 | FIM |
|---|---|---|---|
| Max Sensitivity* | 8.41E+05 | 4.86E+05 | 4.23E+05 |
| Min Sensitivity* | -2.41E+05 | -2.09E+06 | -1.05E+06 |
| Total Impedance (ohm) | 1.01 | 1.096 | 1.055 |
| Stomach Impedance (ohm) | 0.389 | 0.333 | 0.3611 |
| % Contribution of stomach | 38.51 | 30.38 | 34.23 |
[i] *values on the electrode plane (x-y plane) only
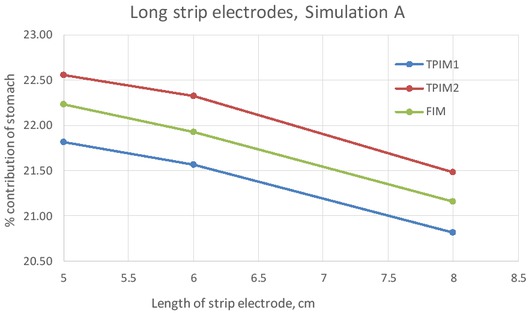
Fig 12
Percentage Contribution of stomach in Simulation-A for long strip electrodes of different lengths, for all the three configurations, TPIM1, TPIM2 and FIM using the electrode placements used for the small round electrodes.
Table 7
Simulation-A for Strip Electrodes of different lengths Strip electrode cross section: 2 cm × 2 cm Direct straight-line separations: I1-V1 = 8 cm, I1'-V1' = 15.4 cm, I2-V2 = 8 cm, I2'-V2' = 24.7 cm
| Length = 5 cm | Length = 6 cm | Length = 8 cm | |||||||
|---|---|---|---|---|---|---|---|---|---|
| Simulated Parameters | TPIM1 | TPIM2 | FIM | TPIM1 | TPIM2 | FIM | TPIM1 | TPIM2 | FIM |
| Max Sensitivity* | 3.90E+04 | 4.47E+04 | 2.43E+04 | 2.64E+04 | 2.37E+04 | 1.67E+04 | 5.42E+04 | 3.05E+04 | 3.27E+04 |
| Min Sensitivity* | -6.32E+04 | -7.53E+04 | -3.60E+04 | -5.14E+04 | -6.73E+04 | -3.26E+04 | -5.77E+04 | -1.57E+05 | -7.80E+04 |
| Total Impedance, Ω | 1.49 | 1.57 | 1.53 | 1.40 | 1.48 | 1.44 | 1.47 | 1.55 | 1.51 |
| Stomach Impedance, Ω | 0.33 | 0.36 | 0.34 | 0.29 | 0.32 | 0.30 | 0.32 | 0.35 | 0.33 |
| % Contribution of stomach | 21.82 | 22.55 | 22.23 | 20.82 | 21.49 | 21.16 | 21.57 | 22.33 | 21.93 |
[i] *values on the x-y plane at the vertical center of the electrode and stomach
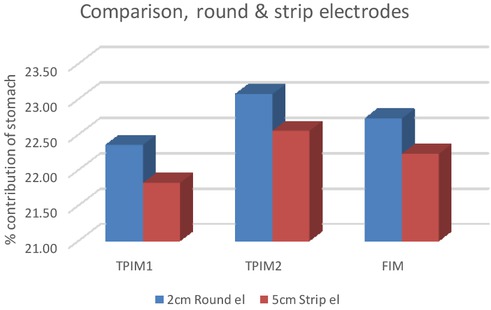
Fig 13
Percentage Contribution of stomach in Simulation-A for 2cm round electrodes and for 5cm long strip electrodes of 2cmx2cm cross section, for all the three configurations, TPIM1, TPIM2 and FIM.