Figure 1.
Figure 2.
Figure 3.
Figure 4.
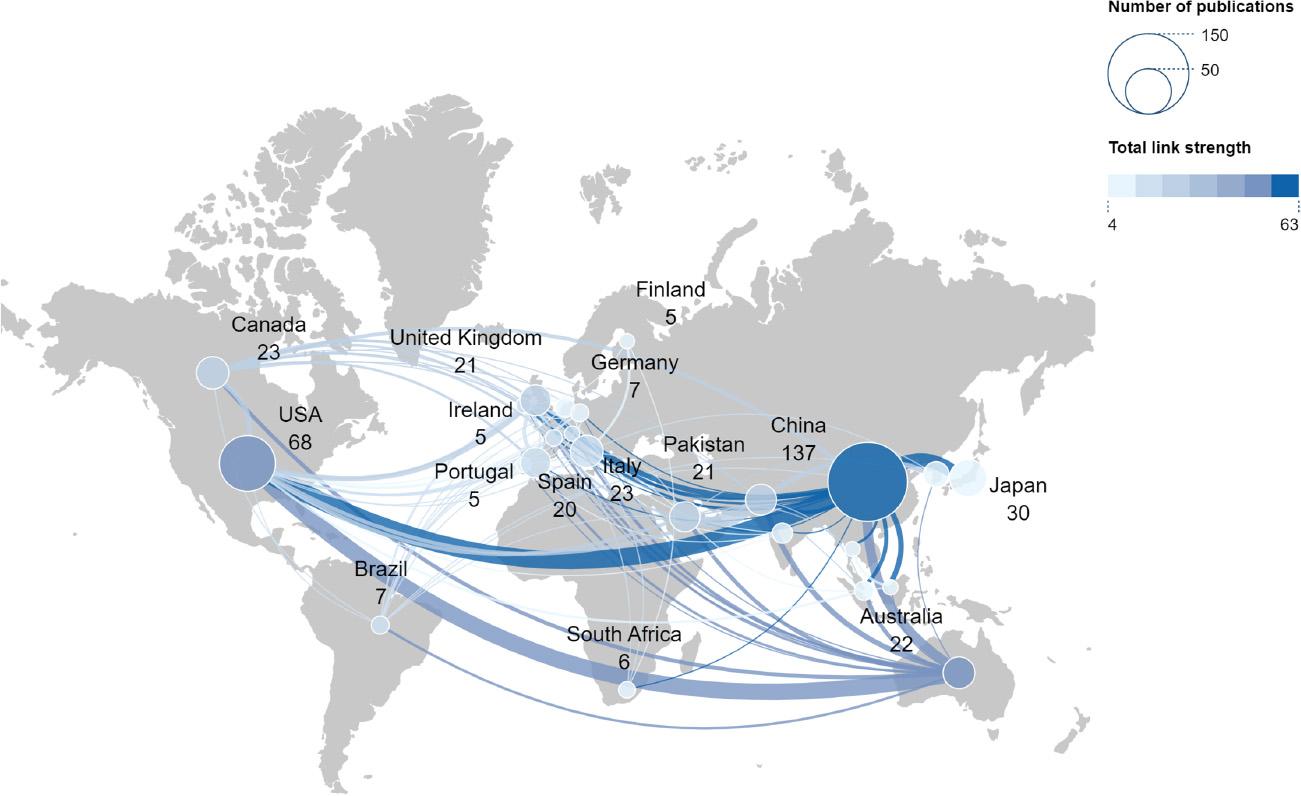
Figure 5.
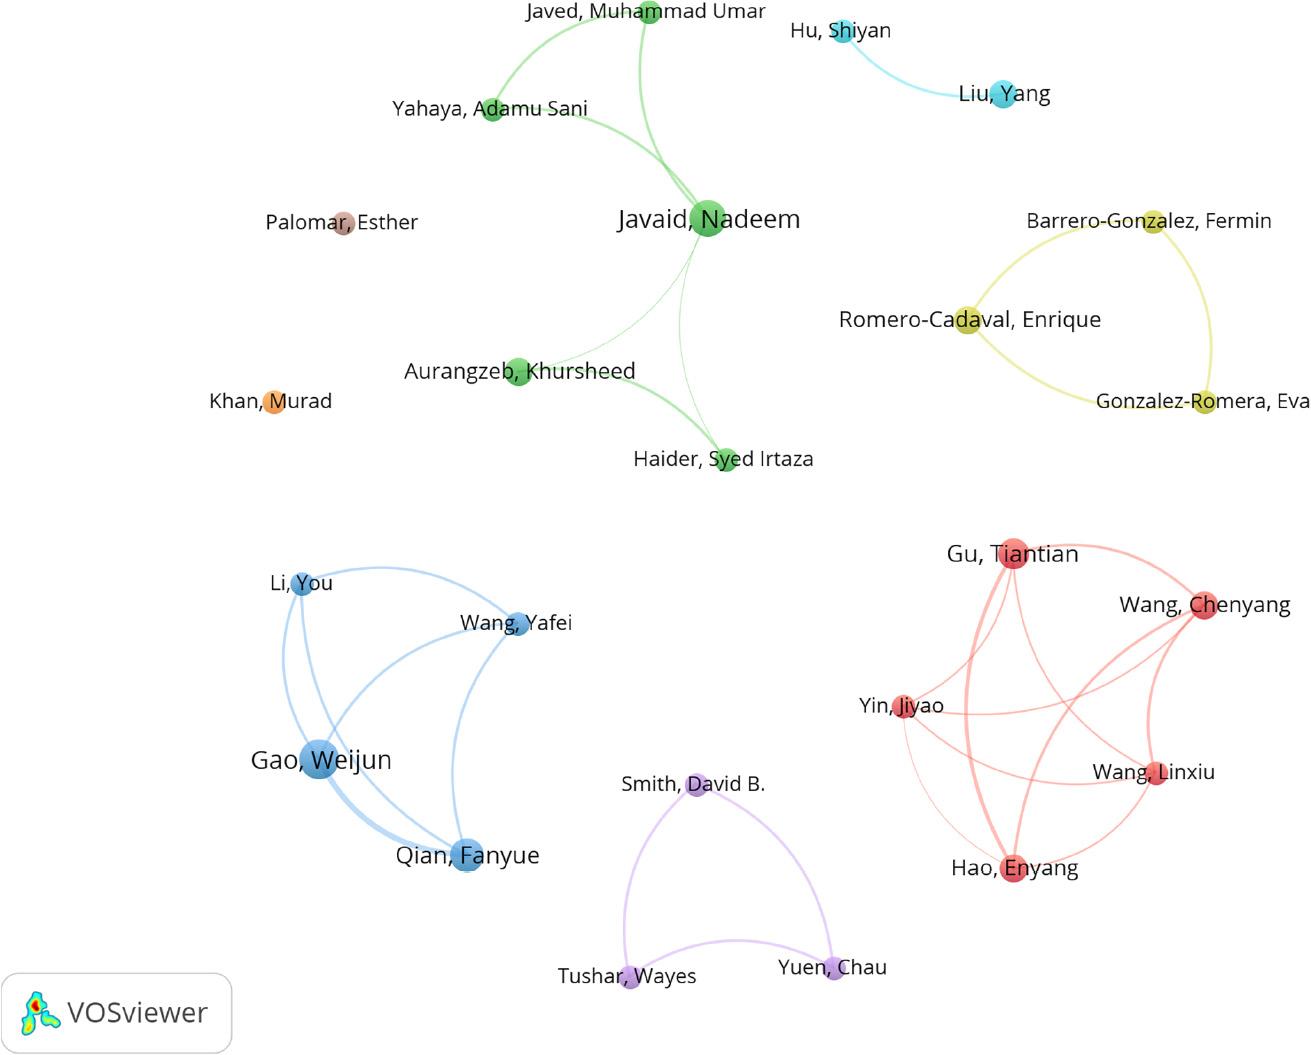
Figure 6.
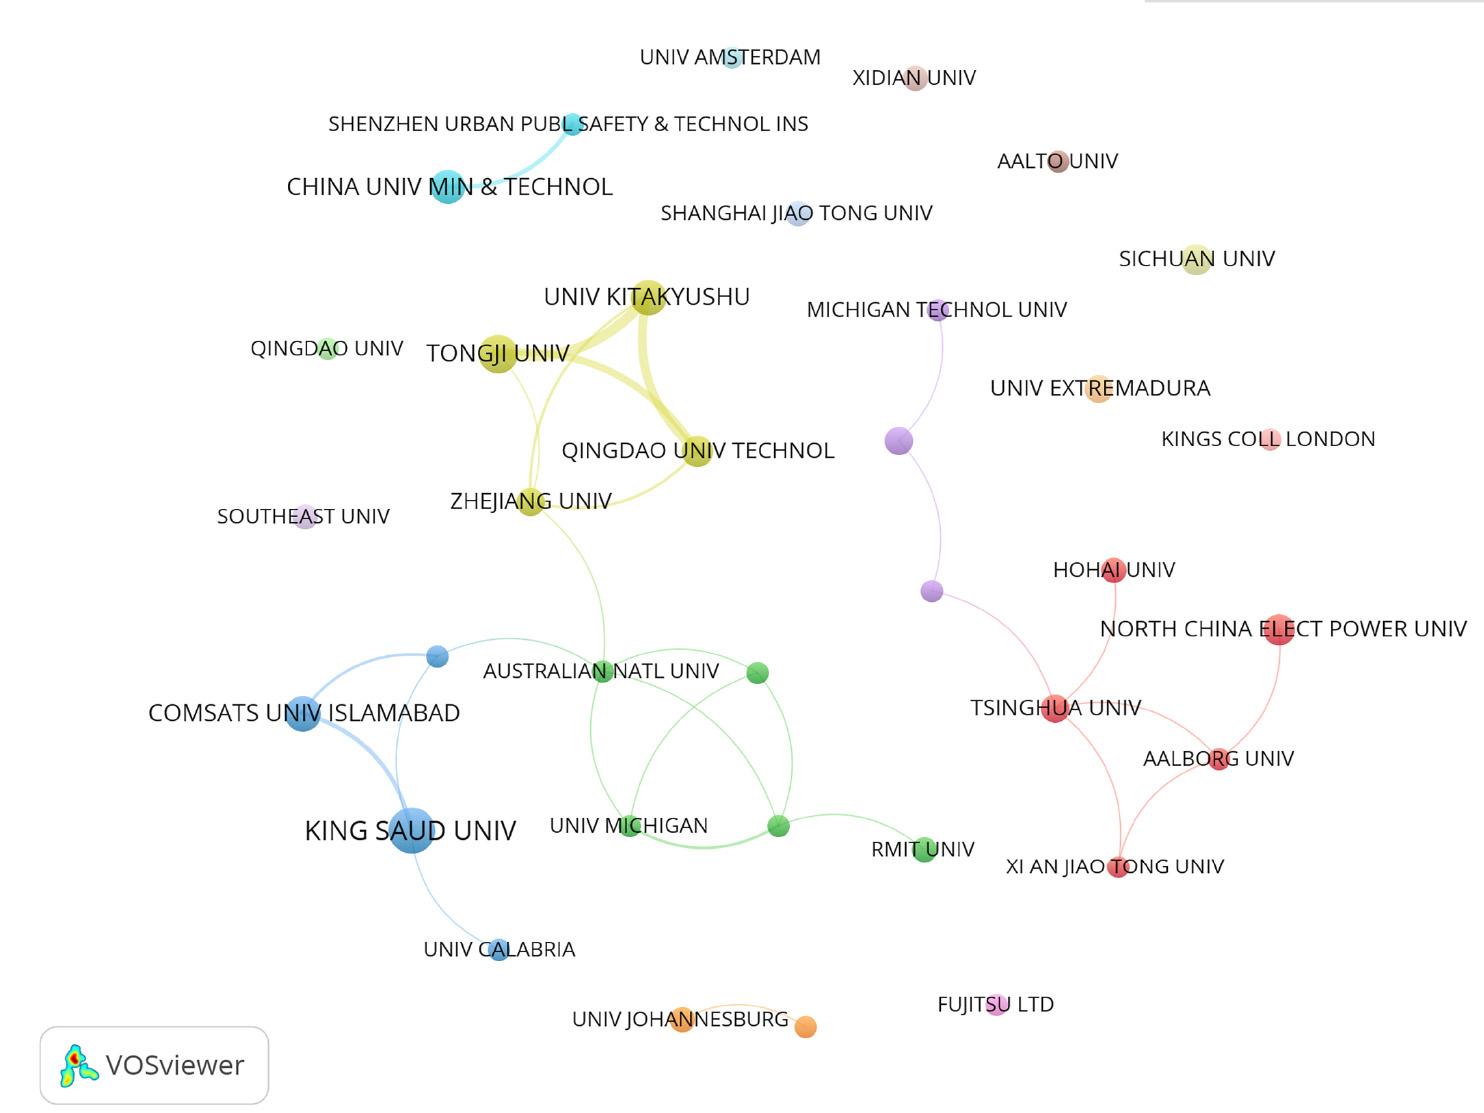
Figure 7.
Figure 8.
Figure 9.
Figure 10.
Figure 11.
Figure 12.
Figure 13.
Top 10 countries by publication volume_
| Rank | Country | NP | NC | AC | H-index |
|---|---|---|---|---|---|
| 1 | China | 137 | 2,979 | 21.74 | 26 |
| 2 | USA | 68 | 1,570 | 23.09 | 20 |
| 3 | Japan | 30 | 331 | 11.03 | 9 |
| 4 | Canada | 23 | 767 | 33.35 | 11 |
| 5 | Italy | 23 | 621 | 27.00 | 11 |
| 6 | Australia | 22 | 1,164 | 52.91 | 12 |
| 7 | Pakistan | 21 | 561 | 26.71 | 12 |
| 8 | United Kingdom | 21 | 313 | 14.90 | 10 |
| 9 | Spain | 20 | 396 | 19.80 | 10 |
| 10 | Saudi Arabia | 20 | 378 | 18.90 | 10 |
Top 10 institutions by publication volume_
| Rank | Organization | NP | NC | AC | H-index |
|---|---|---|---|---|---|
| 1 | KING SAUD UNIV | 13 | 314 | 24.15 | 9 |
| 2 | TONGJI UNIV | 9 | 213 | 23.67 | 5 |
| 3 | COMSATS UNIV ISLAMABAD | 8 | 238 | 29.75 | 7 |
| 4 | UNIV KITAKYUSHU | 8 | 179 | 22.38 | 5 |
| 5 | CHINA UNIV MIN & TECHNOL | 7 | 73 | 10.43 | 4 |
| 6 | NORTH CHINA ELECT POWER UNIV | 6 | 132 | 22.00 | 5 |
| 7 | QINGDAO UNIV TECHNOL | 6 | 114 | 19.00 | 3 |
| 8 | SICHUAN UNIV | 6 | 83 | 13.83 | 5 |
| 9 | ZHEJIANG UNIV | 5 | 791 | 158.20 | 5 |
| 10 | CHINESE ACAD SCI | 5 | 133 | 26.60 | 3 |
Top 20 disciplines by publication volume_
| Rank | Web of Science categories | NP |
|---|---|---|
| 1 | Engineering Electrical Electronic | 88 |
| 2 | Computer Science Information Systems | 62 |
| 3 | Telecommunications | 62 |
| 4 | Energy Fuels | 59 |
| 5 | Green Sustainable Science Technology | 21 |
| 6 | Environmental Sciences | 18 |
| 7 | Environmental Studies | 16 |
| 8 | Computer Science Theory Methods | 15 |
| 9 | Information Science Library Science | 15 |
| 10 | Communication | 13 |
| 11 | Construction Building Technology | 13 |
| 12 | Computer Science Artificial Intelligence | 12 |
| 13 | Computer Science Interdisciplinary Applications | 11 |
| 14 | Computer Science Hardware Architecture | 10 |
| 15 | Engineering Civil | 9 |
| 16 | Instruments Instrumentation | 9 |
| 17 | Multidisciplinary Sciences | 9 |
| 18 | Public Environmental Occupational Health | 9 |
| 19 | Engineering Multidisciplinary | 8 |
| 20 | Social Sciences Interdisciplinary | 8 |
Top 10 journals by publication volume and citation frequency_
| Rank | Journals | NP | Country | IF (JCR2023) | Cited journals or meetings | NC | Country | IF (JCR2023) |
|---|---|---|---|---|---|---|---|---|
| 1 | IEEE ACCESS | 17 | USA | 3.4 | IEEE T SMART GRID | 355 | USA | 8.6 |
| 2 | ENERGIES | 17 | Switzerland | 3.0 | APPL ENERG | 320 | United Kingdom | 10.1 |
| 3 | SUSTAINABILITY | 10 | Switzerland | 3.3 | IEEE ACCESS | 195 | USA | 3.4 |
| 4 | SENSORS | 6 | Switzerland | 3.4 | ENERGY | 184 | United Kingdom | 9.0 |
| 5 | IEEE COMMUNICATIONS MAGAZINE | 5 | USA | 8.3 | RENEW SUST ENERG REV | 164 | USA | 16.3 |
| 6 | APPLIED ENERGY | 5 | United Kingdom | 10.1 | ENERGIES | 164 | Switzerland | 3.0 |
| 7 | ENERGY | 5 | United Kingdom | 9.0 | SUSTAIN CITIES SOC | 120 | Netherlands | 10.5 |
| 8 | PLOS ONE | 5 | USA | 2.9 | IEEE T POWER SYST | 112 | USA | 6.5 |
| 9 | IEEE INTERNET OF THINGS JOURNAL | 4 | USA | 8.2 | IEEE T IND INFORM | 110 | USA | 11.7 |
| 10 | SUSTAINABLE CITIES AND SOCIETY | 4 | Netherlands | 10.5 | SUSTAINABILITY-BASEL | 102 | Switzerland | 3.3 |
Top 10 authors by publication volume_
| Rank | Author | NP | NC | AC | H-index |
|---|---|---|---|---|---|
| 1 | Gao, Weijun | 8 | 179 | 22.38 | 5 |
| 2 | Javaid, Nadeem | 7 | 132 | 18.86 | 7 |
| 3 | Qian, Fanyue | 6 | 138 | 23.00 | 3 |
| 4 | Gu, Tiantian | 5 | 25 | 5.00 | 2 |
| 5 | Aurangzeb, Khursheed | 4 | 92 | 23.00 | 3 |
| 6 | Liu, Yang | 4 | 61 | 15.25 | 3 |
| 7 | Romero-Cadaval, Enrique | 4 | 56 | 14.00 | 4 |
| 8 | Wang, Chenyang | 4 | 23 | 5.75 | 2 |
| 9 | Hao, Enyang | 4 | 17 | 4.25 | 2 |
| 10 | Smith, David B. | 3 | 391 | 130.33 | 3 |