
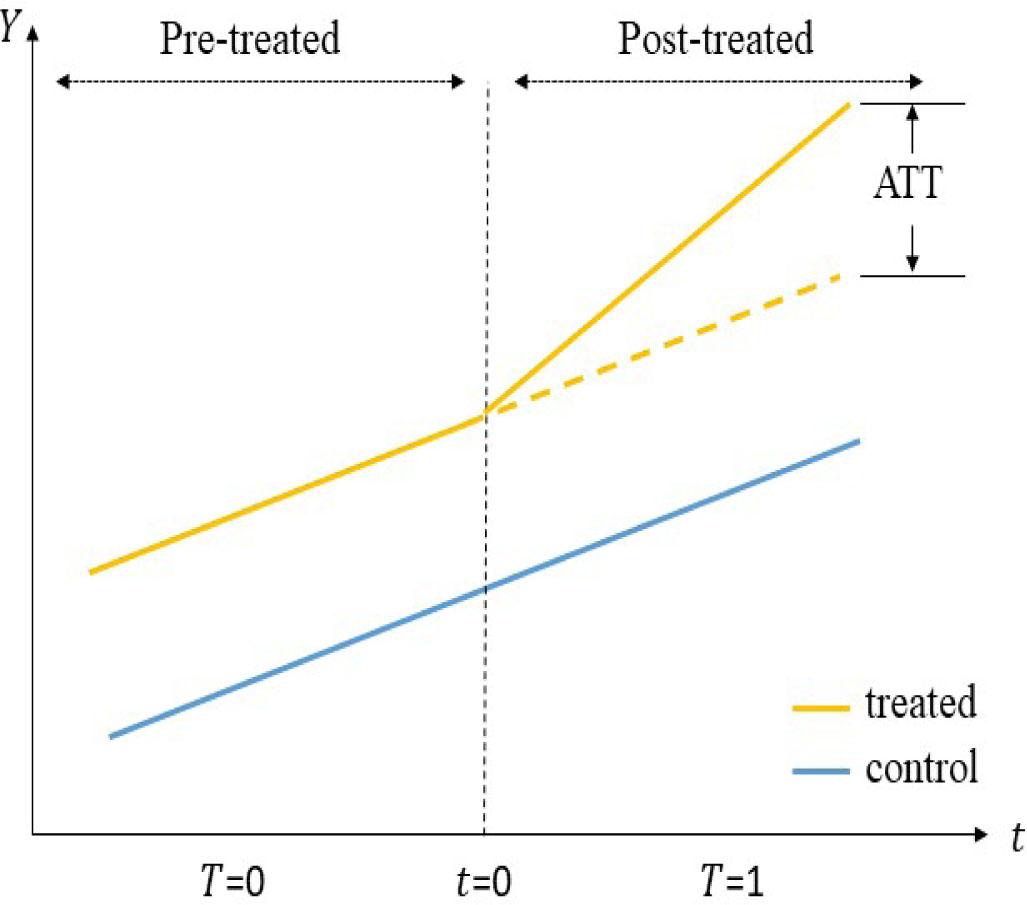
Figure 1
Regression results and CTA tests by applying different matching techniques_
| DID regression Model Results | |||
|---|---|---|---|
| Model | Model I | Model II | Model III |
| Matching Techniques | - | CEM | PSM |
| ATT | −0.1488 | −0.0780 | −0.1481 |
| SE | 0.0998 | 0.1307 | 0.1317 |
| Common trend assumption | Fail | Pass | Pass |
| p-value | 0.0999 | 0.6836 | 0.1582 |
| Fixed Effect Controls | |||
| Individual | Yes | Yes | Yes |
| Year | Yes | Yes | Yes |
Descriptive statistics for the entire sample (Nobel laureates and their prizewinning-work collaborators)_
| Prize year | Total #Publication | Total #Citation | |
|---|---|---|---|
| Minimum | 1934 | 10 | 443 |
| Maximum | 2011 | 1,627 | 194,896 |
| Mean | 1987 | 245.9 | 25,662.6 |
| Median | 1991 | 157 | 13,061 |
| Standard deviation | 18.6 | 266.1 | 31,571.4 |
| Count | 335 | 335 | 335 |
Matching results by applying different matching techniques_
| Average citation index
| ||||||
|---|---|---|---|---|---|---|
| Matching Techniques | - | CEM | PSM | |||
| Group | Control | Treated | Control | Treated | Control | Treated |
| Observations | 227 | 108 | 80 | 80 | 84 | 108 |
| Mean | 4.7083 | 5.2350 | 5.0701 | 5.2869 | 5.1353 | 5.2350 |
| Std. dev. | 1.4886 | 1.5034 | 1.7627 | 1.6595 | 1.5821 | 1.5034 |
| Minimum | 0.3519 | 0.1997 | 0 | 0 | 1.3754 | 0.1997 |
| Maximum | 8.4902 | 8.2194 | 8.3668 | 8.4933 | 8.4902 | 8.2194 |
Statistics for the treatment effects_
| Treatment | Control | Treatment-Control | |
|---|---|---|---|
| Prior | E(Y01) | E(Y00) | E(Y01)–E(Y00) |
| Posterior | E(Y11) | E(Y10) | E(Y11)–E(Y10) |
| Posterior-Prior | E(Y11)–E(Y01) | E(Y10)–E(Y00) | [E(Y11)–E(Y01)]–[E(Y10)–E(Y00)] |