
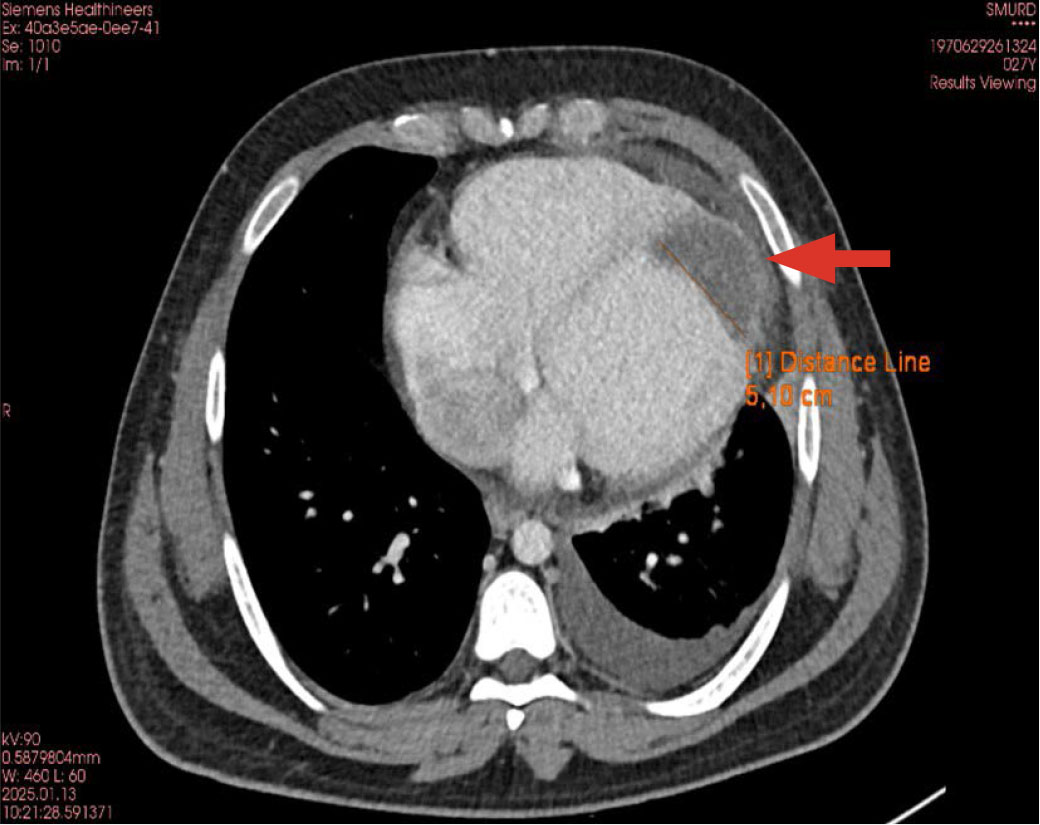
FIGURE 1.
Cardiac computed tomography imaging showing a large thrombus at the left ventricular apex (arrow).
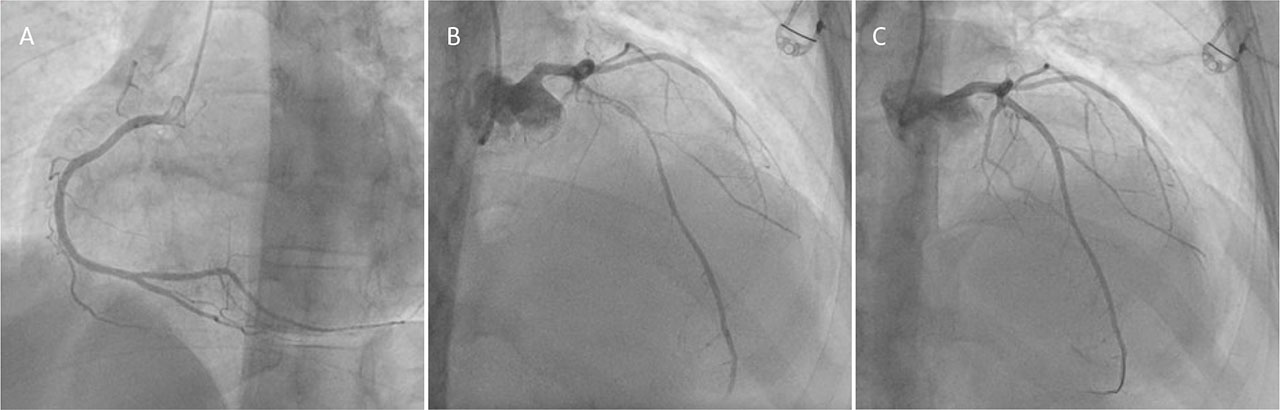
FIGURE 2.
Coronary angiography. A. Right coronary artery. B. Left coronary artery showing subocclusive stenosis in the left anterior descending artery. C. Left coronary artery showing the result of the percutaneous coronary intervention.
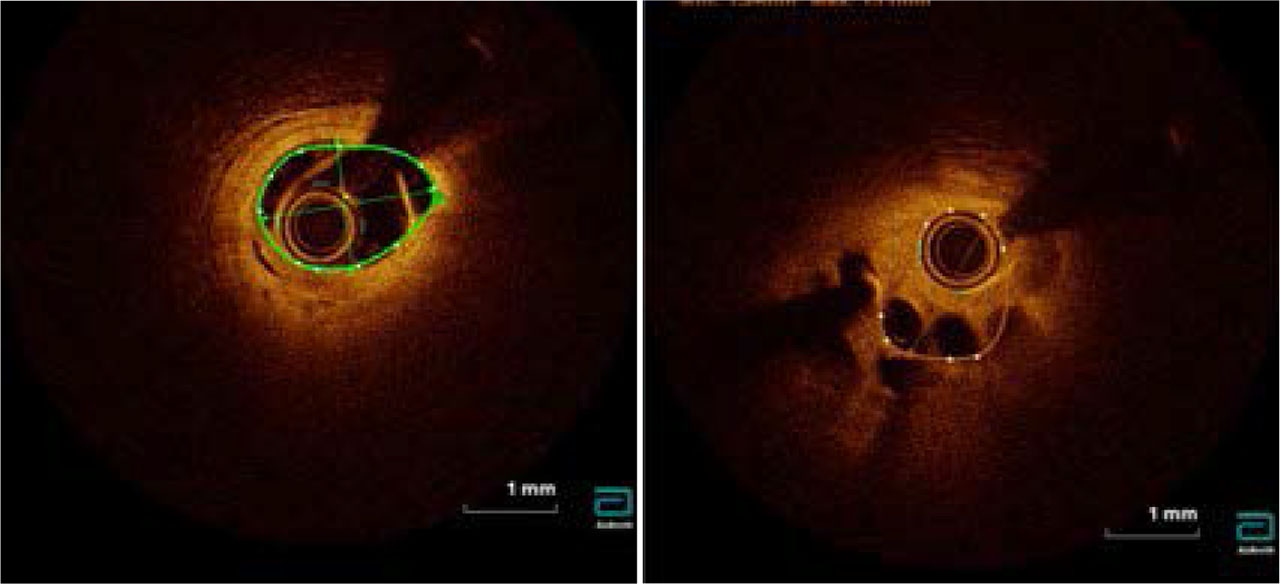
FIGURE 3.
Cardiac optical coherence tomography demonstrating extended thrombotic load with recanalization features and adjacent fibrous plaque without vulnerability signs.