
FIGURE 1.
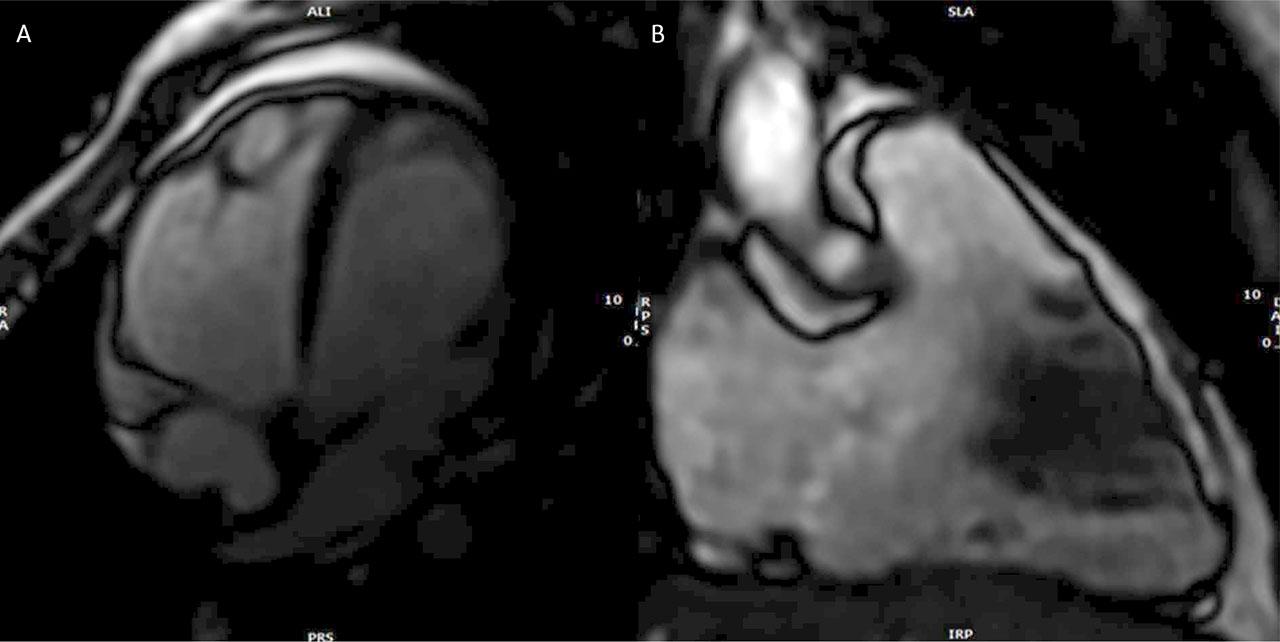
FIGURE 2.
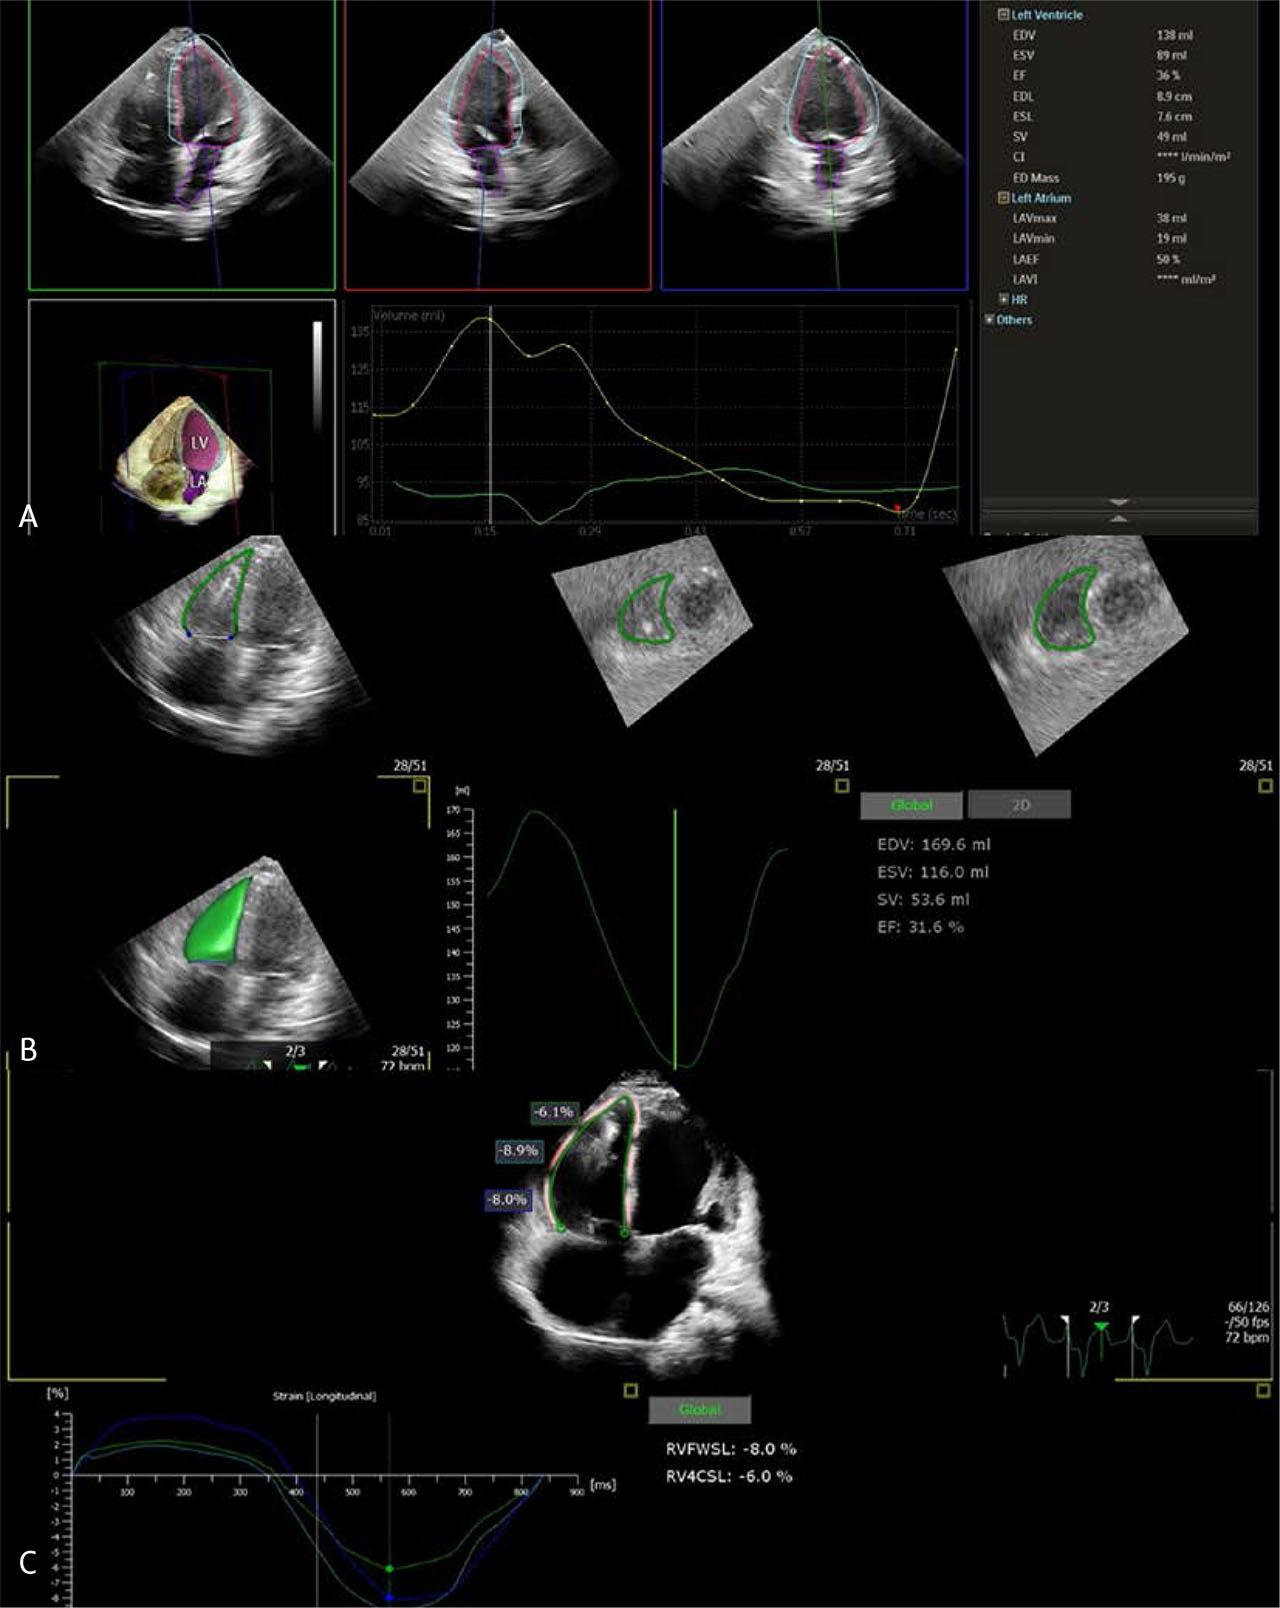
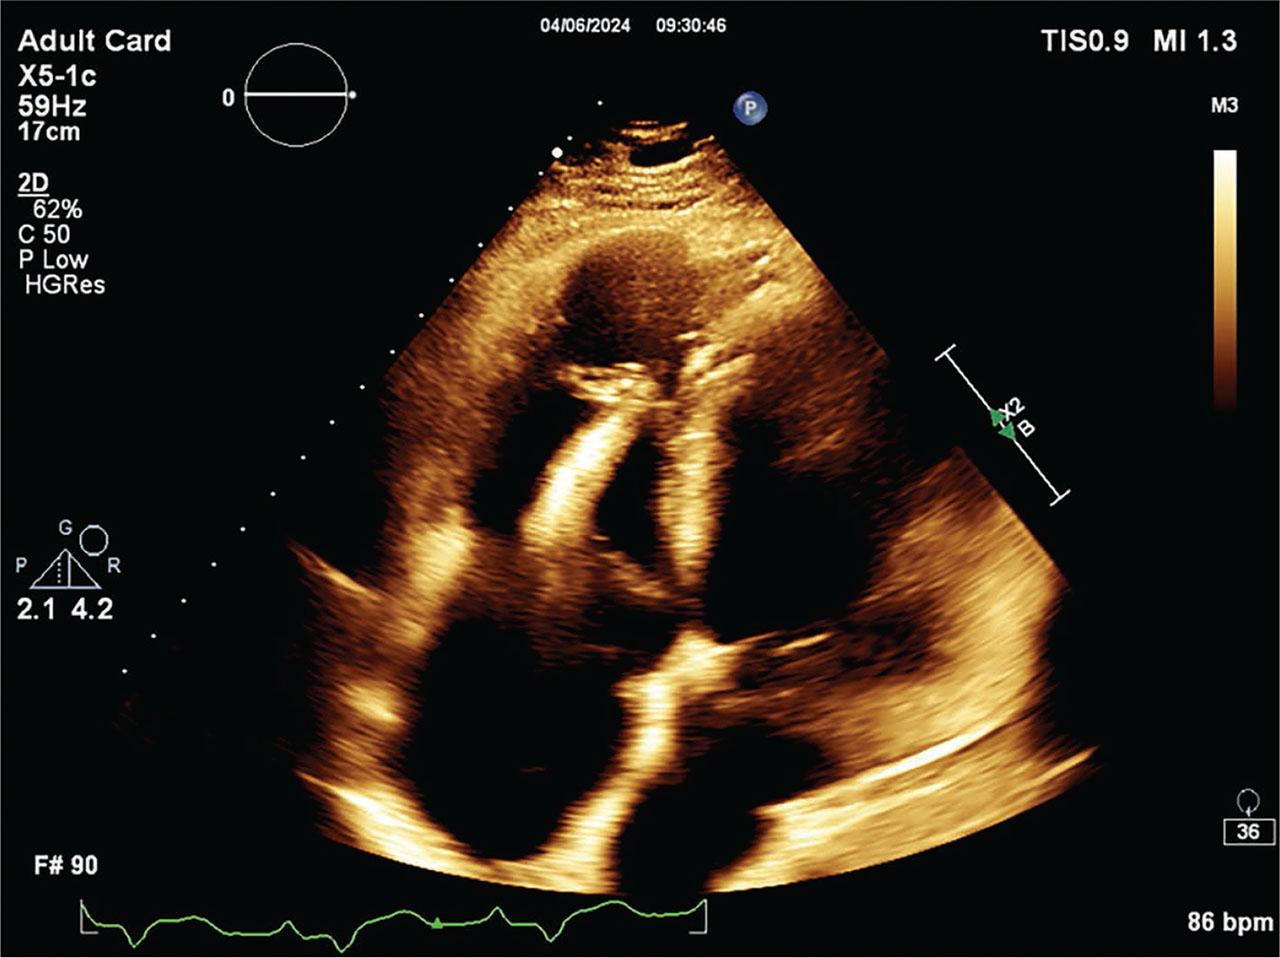
FIGURE 2.
Correlation analysis of patient characteristics and cystatin C levels
| Case 1 | Case 2 | Case 3 | Case 4 | |
|---|---|---|---|---|
| Age at diagnosis | 1.4 years | 12 years | 12 years | 17 years |
| Symptoms |
|
|
|
|
| Family history | – |
|
|
|
| ECG |
|
|
|
|
| Holter ECG |
|
|
|
|
| Echocardiography |
|
|
|
|
| MRI |
|
|
|
|
| Genetics | Mutation in the TTN gene (VUS) | Mutation in the TTN gene (VUS) | Mutation in the FLNC gene (VUS) | Mutation in the DSC2 gene (VUS) |
| Treatment | Pharmacological | ICD implantation | ICD implantation | ICD implantation |