
Coronavirus disease (COVID-19) has spread globally since 2020, with over 750 million confirmed cases and approximately 7 million fatalities.1 COVID-19 is an infectious illness with a wide spectrum of clinical signs, ranging from asymptomatic to moderately symptomatic and severe forms. This indicates that the host response to severe acute respiratory syndrome coronavirus 2 (SARS-CoV-2) has a significant role.2,3 The COVID-19 pandemic has also negatively affected hospitals’ activity regarding chronic pathology and elective surgery.4,5
Studies have found the majority of infections caused by SARS-CoV-2 to be moderate; 31% were severe (with dyspnea, hypoxia, or more than 50% lung involvement on detection imaging), whereas 5% of patients developed a life-threatening condition with respiratory failure or multiple organ dysfunction.6 The risk of mortality from COVID-19 is heavily influenced by age and medical history. Older individuals are considerably more likely to have catastrophic or fatal illness outcomes, particularly if they have comorbidities such as hypertension, cardiovascular disease, obesity, chronic renal disease, pulmonary disease, and diabetes.3,7,8
Researchers have used specific ratios to identify and analyze several inflammatory disorders in recent years. Numerous investigations have discovered that various combinations of hematological elements of the systemic immune response, such as the neutrophil-to-lymphocyte ratio (NLR), monocyte-to-lymphocyte ratio (MLR), and platelet-to-lymphocyte ratio (PLR), were successful indicators of prognosis in patients with an array of malignancies, heart disease, diabetes, acute ischemic stroke, peripheral arterial disease, and chronic kidney disease.9,10,11,12,13,14,15,16,17,18,19 The elements of these simply derived metrics are widely available, affordable, and frequently assessed as part of a complete blood test report in everyday practice. Calculating these hematological components associated with the systemic immune response may offer healthcare specialists an additional helpful tool for clinical risk classification.
Our study aims to provide an updated overview of the current landscape of the role of hematological inflammatory biomarkers (NLR, MLR, and PLR) on the risk of developing major adverse cardiovascular events (MACE) and mortality in patients with COVID-19, focusing on the optimal cut-off value of the biomarkers, their clinical impact, and the possibility of stratification of groups of patients at risk.
Following the analysis of the studies published in the literature, we included 21 articles in this review, reporting on a total number of 7,588 patients. The average age of the patients was 65.36 years, and 56.57% were male. Regarding the clinical data, 57.49% of the patients presented hypertension (15 out of the 21 studies reported hypertensive patients), followed by ischemic heart disease in 33.56% of patients (13 studies) and diabetes in 30.37% of patients (17 studies). In additional, among the usual risk factors, 23.55% of patients presented obesity (7 studies), and 23.02% were active smokers (10 studies). Regarding the hematological inflammatory biomarkers, NLR was analyzed in 21 studies, PLR was investigated in nine studies, and MLR was explored in only six. The rest of the data are shown in Table 1.
General characteristics of the studies included in the analysis
| Study | Patients, n | Mean age, years | Male sex, n (%) | Hypertension, n (%) | Ischemic heart disease, n (%) | Diabetes, n (%) | Obesity, n (%) | Active smoking, n (%) | Observation |
|---|---|---|---|---|---|---|---|---|---|
| Fois et al.34 | 119 | 72 | 77 (64.7%) | – | – | 25 (21%) | 27 (22.69%) | 36 (30.25%) | NLR, MLR, and PLR |
| Abrishami et al.20 | 100 | 55.5 | 68 (68%) | 33 (33%) | 21 (21%) | 21 (21%) | 25 (25%) | – | NLR and PLR |
| Pakos et al.21 | 242 | 66.03 | 208 (85.95%) | 180 (74%) | – | 118 (49%) | – | – | NLR |
| Allahverdiyev et al.22 | 455 | 56 | 217 (47.7%) | 170 (37.4%) | 88 (19.3%) | 128 (28.1%) | – | – | NLR |
| Zeng et al.23 | 352 | >60 years 133 (37.78%) | 190 (53.97%) | – | – | – | – | 57 (16.19%) | NLR |
| <60 years 219 (62.22%) | |||||||||
| Moradi et al.36 | 219 | – | 137 (62.6%) | 85 (38.8%) | 46 (21%) | 83 (38%) | – | 23 (10.5%) | NLR |
| Yildiz et al.37 | 198 | Derivation group 64.4 | 110 (55%) | 101 (51%) | 107 (54%) | 49 (25%) | – | 8 (4%) | NLR |
| Validation group 65 | 65 (64%) | 52 (51.5%) | 45 (44.6%) | 22 (21.8%) | – | 2 (2%) | |||
| Karaaslan et al.38 | 191 | 54.32 | 94 (49.2%) | 72 (37.7%) | – | 44 (23%) | – | – | NLR and PLR |
| Kudlinski et al.39 | 285 | 62 | 189 (66.3%) | 153 (55.2%) | 26 (9.4%) | 57 (20.7%) | 134 (47.7%) | 20 (7%) | NLR |
| Rose et al.24 | 454 | – | 291 (64.1%) | 225 (49.6%) | 137 (30.2%) | 119 (26.2%) | 103 (22.7%) | – | NLR and PLR |
| Halmaciu et al.25 | 267 | 71.19 | 159 (59.55%) | 167 (62.55%) | 145 (54.31%) | 116 (43.45%) | 69 (25.84%) | 99 (37.08%) | NLR and MLR |
| Arbănași et al.26 | 510 | 69.6 | 247 (62.37%) | 228 (57.78%) | 138 (34.85%) | 150 (37.88%) | 114 (28.79%) | 134 (33.84%) | NLR, MLR, and PLR |
| Mureșan et al.27 | 889 | 70.5 | 474 (53.32%) | 735 (82.67%) | 513 (57.70%) | 268 (30.14%) | 146 (16.42%) | 256 (28.79%) | NLR, MLR, and PLR |
| Citu et al.28 | 108 | 63.31 | 56 (51.9%) | 76 (70.4%) | 51 (47.2%) | 50 (46.3%) | – | – | NLR, MLR, and PLR |
| Ghobadi et al.29 | 1,792 | Elderly 76.29 | 988 (55.13%) | – | – | 522 (29.12%) | – | – | NLR, MLR, and PLR |
| Non-elderly 48.35 | |||||||||
| Regolo et al.30 | 411 | 72 | 237 (57.7%) | 244 (59.4%) | 70 (17.1%) | 111 (27%) | – | – | NLR |
| Seyfi et al.31 | 312 | – | – | – | – | – | – | – | NLR |
| Strazzulla et al.35 | 184 | – | 103 (55.97%) | – | – | – | – | – | NLR and PLR |
| Zhan et al.32 | 159 | – | 73 (45.91%) | 72 (45.28%) | 15 (9.43%) | 33 (20.75%) | – | 53 (33.33%) | NLR |
| Predenciuc et al.33 | 130 | 71 | 86 (66.2%) | 117 (90%) | 106 (81.5) | 39 (30%) | – | – | NLR |
| Khorvash et al.40 | 211 | 66.28 | 110 (52.13%) | 126 (59.7%) | 53 (25.1%) | 103 (48.8%) | – | – | NLR |
Regarding mortality, we identified an average NLR of 9.24 (range 5.00–17.70) in the group of patients with negative outcomes, much higher than in the control group, in which the average NLR was 4.86 (range 2.14–12.29). In addition, in 14 studies, the authors identified an optimal cut-off value of 7.16 (range 2.70–15.20) using receiver operating characteristic (ROC) analysis. The area under the curve (AUC) analysis yielded an average value of 0.77 (range 0.63–0.87), with an average sensitivity of 72.54% and a specificity of 72.31% (Figure 1 and Table 2). When analyzing the prognostic role of NLR in MACE, we found an optimal average cut-off value of 9.43 (range 5.40–13.67), with an average AUC of 0.830, a sensitivity of 76.87%, and a specificity of 82.2% (Table 2).
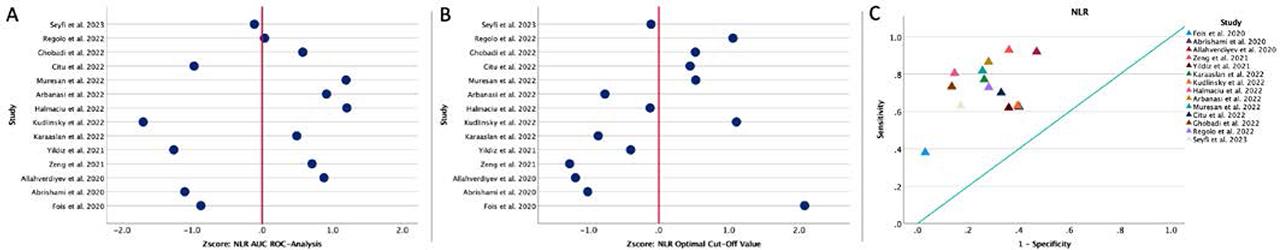
A, ROC analysis and AUC for NLR regarding mortality. Values are expressed per 1 s.d. increase regarding the median value. B, Distribution of the optimal cut-off values for NLR regarding mortality. Values are expressed per 1 s.d. increase regarding the median value. C, The position of the optimal cut-off value depending on the sensitivity and specificity of each value, regarding mortality.
NLR studies and predictive values for clinical outcomes
| Study | Year | Country | Biomarker | Study group value | Control group value | Cut-off value | AUC ROC analysis | Sensitivity (%) | Specificity (%) | Outcome |
|---|---|---|---|---|---|---|---|---|---|---|
| Fois et al.34 | 2020 | Italy | NLR | 9.17 | 5 | 15.2 | 0.697 | 38% | 97% | Mortality |
| Abrishami et al.20 | 2020 | Iran | NLR | 5.02 | 3.02 | 3.65 | 0.678 | 62.5% | 60% | Mortality |
| Pakos et al.21 | 2020 | USA | NLR | 6.4 | 4.5 | – | – | – | – | Mortality |
| Allahverdiyev et al.22 | 2020 | Turkey | NLR | 12.1 | 3.2 | 3 | 0.842 | 92% | 53% | Mortality |
| Zeng et al.23 | 2021 | China | NLR | 5.33 | 2.14 | 2.6937 | 0.828 | 92.9% | 63.9% | Mortality |
| Moradi et al.36 | 2021 | Iran | NLR | 5 | 4.1 | 3.3 | – | – | – | Mortality |
| Yildiz et al.37 | 2021 | Belgium | NLR | – | – | 5.94 | 0.665 | 62% | 64% | Mortality |
| Karaaslan et al.38 | 2022 | Turkey | NLR | 9.27 | 2.73 | 4.21 | 0.810 | 77.1% | 73.7% | Mortality |
| Kudlinski et al.39 | 2022 | Poland | NLR | 17.7 | 12.29 | 11.57 | 0.629 | 63% | 60.5% | Mortality |
| Rose et al.24 | 2022 | Switzerland | NLR | 8.2 | 5.0 | – | – | – | – | Mortality |
| Halmaciu et al.25 | 2022 | Romania | NLR | 11.04 | 3.73 | 6.97 | 0.869 | 80.5% | 85.4% | Mortality |
| Arbănași et al.26 | 2022 | Romania | NLR | 8.45 | 3.01 | 4.57 | 0.845 | 86.6% | 72% | Mortality |
| Mureșan et al.27 | 2022 | Romania | NLR | 9.74 | 5.38 | 9.4 | 0.868 | 81.8% | 74.4% | Mortality |
| Citu et al.28 | 2022 | Romania | NLR | 13.83 | 8.31 | 9.1 | 0.689 | 70% | 67% | Mortality |
| Ghobadi et al.29 | 2022 | Iran | NLR | 6.07 | 4.7 | 9.38 | 0.817 | 73.3% | 86.5% | Mortality |
| Regolo et al.30 | 2022 | Italy | NLR | – | – | 11.38 | 0.772 | 72.9% | 71.9% | Mortality |
| Seyfi et al.31 | 2023 | Iran | NLR | 11.3 | 5.8 | 7.02 | 0.760 | 63% | 83% | Mortality |
| MACE | ||||||||||
| Strazzulla et al.35 | 2021 | France | NLR | 7.5 | 3.2 | – | – | – | – | Acute pulmonary embolism |
| Zhan et al.32 | 2021 | China | NLR | 16.28 | 4.75 | 10.14 | 0.803 | 81.2 | 82.6 | MACE |
| Arbănași et al.26 | 2022 | Romania | NLR | – | – | 8.34 | 0.882 | 81.6% | 87.4% | Acute limb ischemia |
| Mureșan et al.27 | 2022 | Romania | NLR | – | – | 9.63 | 0.836 | 77% | 77.8% | Deep vein thrombosis |
| Mureșan et al.27 | 2022 | Romania | NLR | – | – | 13.67 | 0.801 | 67.7% | 81% | Acute pulmonary embolism |
| Predenciuc et al.33 | 2022 | Republic of Moldova | NLR | 11.1 | 6.3 | 5.4 | – | – | – | Major amputation or mortality |
| Khorvash et al.40 | 2022 | Iran | NLR | 13.9 | 8.03 | – | – | – | – | Acute ischemic stroke |
Abrishami et al.,20 Pakos et al.,21 Allahverdiyev et al.,22 and Zeng et al.23 found that NLR is associated with mortality, with odd ratios (ORs) and hazard ratios (HRs) ranging from 1.03 to 5.40 and 95% confidence intervals (CIs) ranging from 1.00 to 21.20. In addition, Rose et al.,24 Halmaciu et al.,25 Arbănași et al.,26 Mureșan et al.,27 and Citu et al.28 found significantly higher OR/HR values, ranging from 13.07 to 24.13, with tight confidence intervals. Furthermore, Ghobadi et al.,29 Regolo et al.,30 Seyfi et al.,31 Zhan et al.,32 and Predenciuc et al.33 emphasize the relationship between NLR and MACE. Regarding the Kaplan–Meier survival analysis, Fois et al.,34 Zeng et al.,23 Citu et al.,28 Ghobadi et al.,29 Regolo et al.,30 and Zhan et al.32 found a statistically significant difference for the primary endpoint based on the cut-off value (Table 3).
The association between NLR and clinical outcomes: ORs, HRs, and survival analyses
| Study | Biomarker | OR/HR | 95% CI | p value | Outcome | Kaplan–Meier survival analysis | log rank p value | |
|---|---|---|---|---|---|---|---|---|
| Lower | Upper | |||||||
| Fois et al.34 | NLR | 1.02 | 0.99 | 1.06 | 0.10 | Mortality | In-hospital mortality based on cut-off value | <0.001 |
| Abrishami et al.20 | NLR | 1.124 | 1.01 | 1.25 | 0.036 | Mortality | – | – |
| Pakos et al.21 | NLR | 1.038 | 1.003 | 1.074 | 0.031 | Mortality | – | – |
| Allahverdiyev et al.22 | NLR | 1.261 | 1.054 | 1.509 | 0.011 | Mortality | – | – |
| Zeng et al.23 | NLR | 5.4 | 2.6 | 11.1 | <0.001 | Mortality | Disease deterioration based on cut-off value | <0.001 |
| 21.2 | 2.8 | 161.3 | ||||||
| 19.8 | 2.6 | 151.4 | ||||||
| Moradi et al.36 | NLR | 1.03 | 1.003 | 1.07 | 0.03 | Mortality | One-month mortality based on cut-off value | 0.16 |
| Rose et al.24 | NLR | 1.82 | 1.14 | 2.95 | 0.013 | Mortality | – | – |
| Halmaciu et al.25 | NLR | 24.13 | 12.2 | 47.73 | <0.001 | Mortality | – | – |
| Arbănași et al.26 | NLR | 16.32 | 9.09 | 29.3 | <0.001 | Mortality | – | – |
| Mureșan et al.27 | NLR | 13.07 | 8.29 | 20.62 | <0.001 | Mortality | – | – |
| Citu et al.28 | NLR | 3.85 | 1.35 | 10.95 | 0.01 | Mortality | In-hospital mortality based on cut-off value | <0.001 |
| Ghobadi et al.29 | NLR | 3.57 | 2.859 | 4.458 | <0.0001 | Mortality | In-hospital mortality based on cut-off value for non-elderly and elderly | <0.001 / <0.001 |
| Regolo et al.30 | NLR | 1.62 | – | – | <0.0001 | Mortality | In-hospital mortality based on tertiles | <0.0001 |
| Seyfi et al.31 | NLR | 1.121 | 1.072 | 1.179 | <0.0001 | Mortality | – | – |
| Zhan et al.32 | NLR | 2.24 | 1.49 | 4.47 | <0.001 | MACE | 6-month MACE based on cut-off value | 0.010 |
| Arbănași et al.26 | NLR | 30.28 | 13.97 | 65.6 | <0.001 | Acute limb ischemia | – | – |
| Mureșan et al.27 | NLR | 11.7 | 7.99 | 17.13 | <0.001 | Deep vein thrombosis | – | – |
| Mureșan et al.27 | NLR | 10.5 | 5.86 | 18.8 | <0.001 | Acute pulmonary embolism | – | – |
| Predenciuc et al.33 | NLR | 2.46 | 1.0 | 6.03 | 0.04 | Major amputation or mortality | – | – |
The MLR, derived from the absolute monocyte and lymphocyte counts, is another inflammatory biomarker with a prognostic role in the negative evolution of patients with numerous pathologies. According to studies done in Italy and Iran by Fois et al.34 and Ghobadi et al.29, MLR biomarker levels range between 0.364 and 0.628, with specificities between 57% and 62.4%. In comparison, research done by Halmaciu et al.,25 Arbănași et al.,26 Mureșan et al.,27 and Citu et al.28 in Romania shows better ROC analysis and AUC values (between 0.661 and 0.826) and more consistent specificities (between 74% and 81.6%) in connection to mortality. Arbănași et al.26 and Mureșan et al.27 present essential information for acute limb ischemia, deep vein thrombosis, and acute pulmonary embolism, with remarkable specificities ranging from 71.6% to 76.2%. This investigation reveals that MLR may be a potential biomarker, particularly when evaluating the risk of mortality and MACE, with a focus on the specificity achieved in recent Romanian investigations.
We found a cut-off value of 0.516 (range 0.26–0.83), with an AUC of 0.71 (range 0.62–0.83), sensitivity of 66.75% (range 58.00–74.4%) and specificity of 70.50% (range 57.00–81.60%) in terms of mortality (Figure 2 and Table 4).
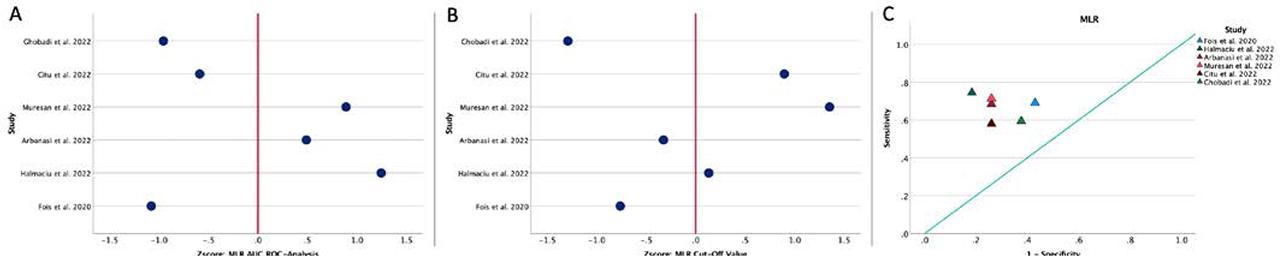
A, ROC analysis and AUC for MLR regarding mortality. Values are expressed per 1 s.d. increase regarding the median value. B, Distribution of the optimal cut-off values for MLR regarding mortality. Values are expressed per 1 s.d. increase regarding the median value. C, The position of the optimal cut-off value depending on the sensitivity and specificity of each value, regarding mortality.
MLR studies and predictive values for clinical outcomes
| Study | Year | Country | Patients, n | Biomarker | Study group value | Control group value | Cut-off value | AUC ROC analysis | Sensitivity (%) | Specificity (%) | Outcome |
|---|---|---|---|---|---|---|---|---|---|---|---|
| Fois et al.34 | 2020 | Italy | 119 | MLR | 0.429 | 0.333 | 0.364 | 0.617 | 69% | 57% | Mortality |
| Halmaciu et al.25 | 2022 | Romania | 267 | MLR | 0.75 | 0.33 | 0.54 | 0.826 | 74.4% | 81.6% | Mortality |
| Arbănași et al.26 | 2022 | Romania | 510 | MLR | 0.62 | 0.32 | 0.45 | 0.758 | 68.4% | 74% | Mortality |
| Mureșan et al.27 | 2022 | Romania | 889 | MLR | 1.14 | 0.47 | 0.78 | 0.794 | 71.3% | 74% | Mortality |
| Citu et al.28 | 2022 | Romania | 108 | MLR | 0.83 | 0.53 | 0.69 | 0.661 | 58% | 74% | Mortality |
| Ghobadi et al.29 | 2022 | Iran | 1,792 | MLR | 0.20 | 0.16 | 0.26 | 0.628 | 59.4% | 62.4% | Mortality |
| MACE | |||||||||||
| Arbănași et al.26 | 2022 | Romania | 510 | MLR | – | – | 0.49 | 0.787 | 71.4% | 71.6% | Acute limb ischemia |
| Mureșan et al.27 | 2022 | Romania | 889 | MLR | – | – | 0.78 | 0.824 | 77% | 76.2% | Deep vein thrombosis |
| Mureșan et al.27 | 2022 | Romania | 889 | MLR | – | – | 0.81 | 0.766 | 71% | 72.1% | Acute pulmonary embolism |
Regarding mortality, Halmaciu et al.25 discovered a significant association between MLR and mortality, with an OR of 6.49 (95% CI 2.51–22.24, p < 0.001), whereas Ghobadi et al.29 discovered a strong association, with an OR of 1.50 (95% CI 1.21–1.86, p < 0.0001). Furthermore, Arbănași et al.26 and Mureșan et al.27 reported substantial associations between MLR and various vascular diseases, including acute limb ischemia and deep vein thrombosis, with ORs and HRs underlining the biomarker’s influence in these conditions. However, we must highlight the diversity in the definition of outcomes and the cut-off values used because they may contribute to considerable discrepancies in research results. Hence, methodological standardization is essential for facilitating inter-study comparisons and validating the relevance of MLR in prognostic evaluation in various medical scenarios. Regarding the Kaplan–Meier survival analysis, only Fois et al.,34 Citu et al.,28 and Ghobadi et al.29 have identified a statistically significant difference in in-hospital mortality based on the cut-off value of MLR (p < 0.05 for all) (Table 5).
The association between MLR and clinical outcomes: ORs, HRs, and survival analyses
| Study | Biomarker | OR/HR | 95% CI | p value | Outcome | Kaplan–Meier survival analysis | log rank p value | |
|---|---|---|---|---|---|---|---|---|
| Lower | Upper | |||||||
| Fois et al.34 | MLR | 1.60 | 0.62 | 4.09 | 0.32 | Mortality | In-hospital mortality based on cut-off value | 0.006 |
| Halmaciu et al.25 | MLR | 6.49 | 2.51 | 22.24 | <0.001 | Mortality | – | – |
| Arbănași et al.26 | MLR | 5.51 | 3.50 | 8.67 | <0.001 | Mortality | – | – |
| Mureșan et al.27 | MLR | 6.89 | 4.64 | 10.23 | <0.001 | Mortality | – | – |
| Citu et al.28 | MLR | 3.05 | 1.16 | 8.05 | 0.02 | Mortality | In-hospital mortality based on cut-off value | <0.001 |
| Ghobadi et al.29 | MLR | 1.502 | 1.212 | 1.86 | <0.0001 | Mortality | In-hospital mortality based on cut-off value for non-elderly and elderly | <0.001 |
| Arbănași et al.26 | MLR | 6.82 | 3.51 | 13.28 | <0.001 | Acute limb ischemia | – | – |
| Mureșan et al.27 | MLR | 11.19 | 7.68 | 16.29 | <0.001 | Deep vein thrombosis | – | – |
| Mureșan et al.27 | MLR | 8.96 | 5.11 | 15.69 | <0.001 | Acute pulmonary embolism | – | – |
We found eight studies that analyzed the prognostic role of PLR regarding mortality. The average value of PLR was 254.82 (range 168.00–363.16) in the case of patients with a negative outcome and 166.95 (range 128.22–215.50) for the control group. In addition, eight studies presented the results of the ROC analysis, in which we identified an average AUC value of 0.66 (range 0.56–0.82) and an optimal calculated cut-off value of 220.78 (range 177.51–266.90), with a sensitivity of 63.00% (range 52.60–72.00%) and a specificity of 69.92% (range 58.00–81.10%) (Table 6). Also, Strazzulla et al.,35 Arbănași et al.,26 and Mureșan et al.27 demonstrated a positive association between high PLR values and the risk of MACE.
PLR studies and predictive values for clinical outcomes
| Study | Year | Country | Patients, n | Biomarker | Study group value | Control group value | Cut-off value | AUC ROC analysis | Sensitivity (%) | Specificity (%) | Outcome |
|---|---|---|---|---|---|---|---|---|---|---|---|
| Fois et al.34 | 2020 | Italy | 119 | PLR | 265 | 214 | 240 | 0.572 | 59% | 58% | Mortality |
| Abrishami et al.20 | 2020 | Iran | 100 | PLR | 202 | 160.8 | – | 0.559 | – | – | Mortality |
| Karaaslan et al.38 | 2022 | Turkey | 191 | PLR | 287.5 | 139.94 | 189.5 | – | – | – | Mortality |
| Rose et al.24 | 2022 | Switzerland | 454 | PLR | 268.3 | 215.5 | – | – | – | – | Mortality |
| Arbănași et al.26 | 2022 | Romania | 510 | PLR | 229.83 | 128.22 | 177.51 | 0.775 | 68.4% | 77.5% | Mortality |
| Mureșan et al.27 | 2022 | Romania | 889 | PLR | 363.16 | 156.22 | 266.9 | 0.819 | 72% | 81.1% | Mortality |
| Citu et al.28 | 2022 | Romania | 108 | PLR | 345 | 324 | – | – | – | – | Mortality |
| Ghobadi et al.29 | 2022 | Iran | 1,792 | PLR | 168 | 154 | 230 | 0.585 | 52.6% | 63.1% | Mortality |
| MACE | |||||||||||
| Strazzulla et al.35 | 2021 | France | 184 | PLR | 259 | 204 | – | – | – | – | Acute pulmonary embolism |
| Arbănași et al.26 | 2022 | Romania | 510 | PLR | – | – | 178.99 | 0.858 | 81.6% | 73.1% | Acute limb ischemia |
| Mureșan et al.27 | 2022 | Romania | 889 | PLR | – | – | 230.67 | 0.802 | 72.8% | 76.8% | Deep vein thrombosis |
| Mureșan et al.27 | 2022 | Romania | 889 | PLR | – | – | 207.06 | 0.734 | 74.2% | 61.3% | Acute pulmonary embolism |
Regarding the predictive role of PLR in clinical outcomes, Fois et al.34 and Rose et al.24 found no statistically significant associations between PLR and mortality. However, Arbănași et al.,26 Mureșan et al.,27 and Ghobadi et al.29 reported a positive association between high baseline values of PLR and mortality. In addition, Arbănași et al.26 discovered a correlation between PLR and acute limb ischemia, whereas Mureșan et al.27 discovered correlations between PLR and deep vein thrombosis and acute pulmonary embolism. Differences in ORs, CIs, and p values between studies highlight the heterogeneity of results and suggest that a rigorous and in-depth review of study techniques and populations is needed to clarify the correlation between PLR and various clinical outcomes. Nevertheless, Ghobadi et al.29 found a significant difference in the Kaplan–Meier survival analysis based on the cut-off value of PLR for non-elderly patients (p < 0.001) but not for the elderly (p = 0.10) (Table 7).
The association between PLR and clinical outcomes: ORs, HRs, and survival analyses
| Study | Biomarker | OR/HR | 95% CI | p value | Outcome | Kaplan–Meier survival analysis | log rank p value | |
|---|---|---|---|---|---|---|---|---|
| Lower | Upper | |||||||
| Fois et al.34 | PLR | 1.0006 | 1.00 | 1.0013 | 0.058 | Mortality | In-hospital mortality based on cut-off value | 0.13 |
| Rose et al.24 | PLR | 1.37 | 0.79 | 2.46 | 0.27 | Mortality | – | – |
| Arbănași et al.26 | PLR | 7.47 | 4.71 | 11.83 | <0.001 | Mortality | ||
| Mureșan et al.27 | PLR | 11.04 | 7.34 | 16.62 | <0.001 | Mortality | ||
| Ghobadi et al.29 | PLR | 1.451 | 1.17 | 1.799 | <0.0001 | Mortality | In-hospital mortality based on cut-off value for non-elderly and elderly | <0.001 / 0.10 |
| Arbănași et al.26 | PLR | 12.07 | 7.71 | 21.77 | <0.001 | Acute limb ischemia | – | – |
| Mureșan et al.27 | PLR | 8.36 | 5.82 | 12.02 | <0.001 | Deep vein thrombosis | – | – |
| Mureșan et al.27 | PLR | 6.26 | 3.54 | 11.07 | <0.001 | Acute pulmonary embolism | – | – |
Based on the results of our state-of-the-art review, we can conclude that NLR, MLR, and PLR have good predictive values regarding the risk of MACE and mortality in patients with COVID-19. The evaluation of hematological inflammatory biomarkers at admission, in the case of patients with viral or septic infections, could help in the stratification of risk groups for better management.