
FIGURE 1.
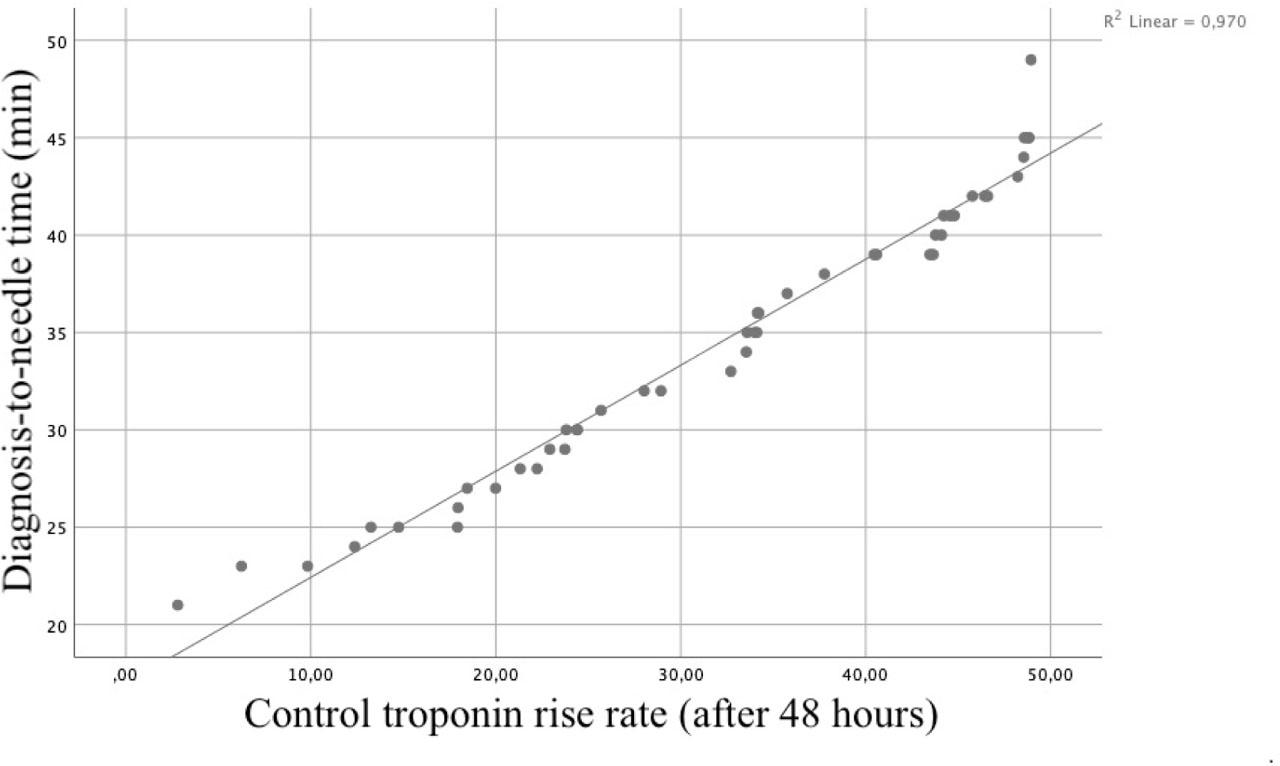
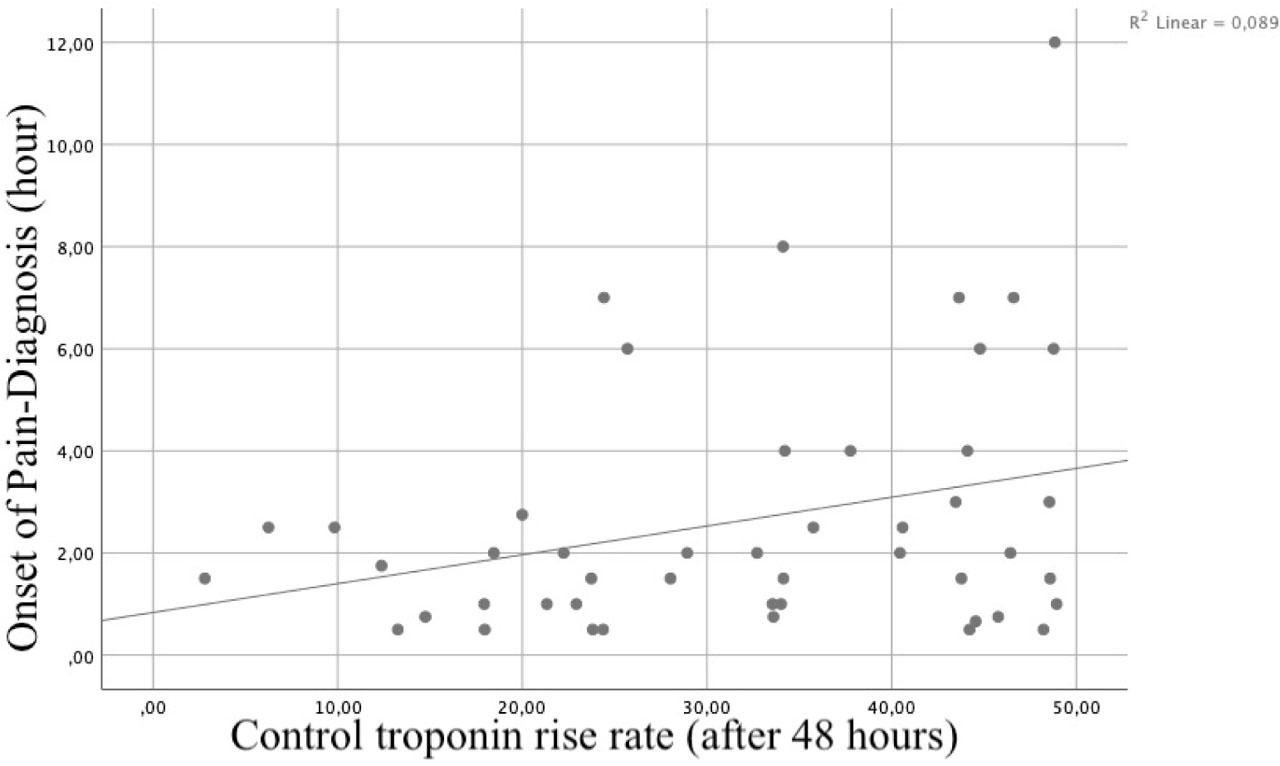
FIGURE 2.
Sociodemographic and clinical characteristics
| % | |
|---|---|
| Smoking | |
| Yes | 60 |
| No | 40 |
| Diabetes mellitus | |
| Yes | 20 |
| No | 80 |
| Hypertension | |
| Yes | 20 |
| No | 80 |
| History of coronary artery disease | |
| Yes | 20 |
| No | 80 |
| Type of myocardial infarction | |
| Anterior | 48 |
| Inferior | 48 |
| Lateral | 4 |
| Localization of the culprit lesion | |
| CX, mid region | 6 |
| LAD, mid region | 24 |
| LAD, osteal region | 2 |
| LAD, proximal | 6 |
| LAD, proximal region | 14 |
| LAD-SAFEN proximal region | 2 |
| RCA, pre-crux | 2 |
| RCA, distal region | 4 |
| RCA, mid region | 20 |
| RCA, proximal | 6 |
| RCA, proximal region | 10 |
| RCA, proximal and crux region | 2 |
| RCA, proximal and distal region | 2 |
| Contrast nephropathy | |
| Not developed | 96 |
| Developed | 4 |
| Patient's time of arrival | |
| Out of working hours | 60 |
| During working hours | 40 |
Relationship between the localization of the culprit lesion and post-angiography ejection fraction
| Localization of the culprit lesion | n | Post-angiography ejection fraction (%) | p value |
|---|---|---|---|
| LAD mid regiona | 12 | 44.50 ± 7.65 | 0.017* |
| LAD proximal regionb | 7 | 43.29 ± 8.30 | 0.035& (difference between a and c) |
| RCA mid regionc | 10 | 52.20 ± 3.99 | 0.034& (difference between b and c) |
The relationship between diagnosis-to-needle times according to working hours
| During working hours (n = 20) | Outside of working hours (n = 30) | p value | |||
|---|---|---|---|---|---|
| Frequency | % | Frequency | % | ||
| Male | 13 | 65 | 25 | 83.3 | 0.210* |
| Female | 7 | 35 | 5 | 16.6 | |
| Age | 58.89 ± 12 | 53.62 ± 14 | 0.205** | ||
| Smoking | |||||
| Yes | 11 | 55 | 19 | 63.3 | 0.594* |
| No | 9 | 45 | 11 | 36.7 | |
| Onset of pain-to-diagnosis time (h) | 1.87 ± 0.99 | 3.12 ± 2.97 | 0.043** | ||
| Diagnosis-to-needle time (min) | 29.89 ± 6.12 | 37.31 ± 6.43 | 0.000** | ||
| Baseline troponin (ng/ml) | 5.04 ± 5.98 | 3.98 ± 4.84 | 0.974** | ||
| Control troponin after 48 h (ng/ml) | 28.77 ± 12.76 | 41.29 ± 10.71 | 0.001** | ||
| Troponin increase | 23.73 ± 11.93 | 37.30 ± 11.04 | 0.000** | ||
| Post-angiography ejection fraction (%) | 50.39 ± 4.57 | 45.48 ± 6.91 | 0.011** | ||
| Diabetes mellitus | |||||
| Yes | 3 | 15 | 7 | 23.3 | 0.334* |
| No | 17 | 85 | 23 | 76.7 | |
| Hypertension | |||||
| Yes | 5 | 25 | 5 | 16.6 | 0.210* |
| No | 15 | 75 | 25 | 83.4 | |
Evaluation of diagnosis-to-needle time
| Mean ± SD | |
|---|---|
| Onset of pain-to-diagnosis time (h) | 2.64 ± 2.47 |
| Post-angiography ejection fraction (%) | 47.36 ± 6.53 |
| Baseline troponin (ng/ml) | 4.39 ± 5.26 |
| Control troponin after 48 h (ng/ml) | 36.50 ± 12.95 |
| Troponin increase (ng/ml) | 32.10 ± 13.09 |