
TABLE 1.
General patient characteristics and admission details
| Parameter | n (%) |
|---|---|
| Male sex | 373 (74.6%) |
| Age (years) | 61.7 ± 12.08 |
| ≥80 | 51 (10.2%) |
| <40 | 10 (2%) |
| Body mass index (kg/m2) | 28 ± 5.1 |
| >30 | 153 (30.6%) |
| Smoking (at any time) | 317 (63.4%) |
| Current smoker | 251 (50.2%) |
| Former smoker | 66 (13.2%) |
| Never | 183 (36.6%) |
| Hypertension | 376 (75.2%) |
| Diabetes mellitus | 117 (23.4%) |
| Chronic obstructive pulmonary disease | 8 (1.6%) |
| Moderate or severe chronic kidney disease | 37 (7.4%) |
| Previous stroke | 9 (1.8%) |
| Previous myocardial infarction | 33 (6.6%) |
| Heart failure | 24 (4.8%) |
| Atrial fibrillation or atrial flutter | 14 (2.8%) |
| Previous percutaneous coronary intervention | 33 (6.6%) |
| Previous coronary artery bypass grafting | 1 (0.2%) |
| Presenting symptoms | |
| Chest pain | 465 (93%) |
| Dyspnea | 10 (2.0%) |
| Cardiac arrest | 21 (4.2%) |
| Other | 4 (0.8%) |
| Cardiac arrest prior to hospital arrival | 38 (7.6%) |
| Prehospital thrombolysis | 32 (6.4%) |
| Heart rate | 84.8 ± 19.8 |
| Systolic blood pressure | 137.9 ± 27.5 |
| Killip class | |
| I | 419 (83.8%) |
| II | 33 (6.6%) |
| III | 21 (4.2%) |
| IV | 27 (5.4%) |
| Hemoglobin (g/dl) | 14.4 ± 1.9 |
| Creatinine (mg/dl) | 0.98 ± 0.5 |
| LDL cholesterol (mg/dl) | 160 ± 51.6 |
| TTE assessment at ED | 500 (100%) |
| Left ventricular ejection fraction | |
| >50% | 121 (24.2%) |
| 40–50% | 142 (28.4%) |
| 30–40% | 186 (37.2%) |
| <30% | 51 (10.2%) |
| ST-segment elevation on ECG | |
| Inferior | 225 (45%) |
| Anterior | 215 (43%) |
| Other | 60 (12%) |
| ECG – QRS morphology | |
| Normal | 389 (77.8%) |
| Q waves | 85 (17%) |
| LBBB | 9 (1.8%) |
| RBBB | 15 (3%) |
| Pacing | 2 (0.4%) |
| Other | |
| ECG – rhythm | |
| Sinus rhythm | 459 (91.8%) |
| Atrial fibrillation | 30 (6%) |
| Other | 11 (2.2%) |
[i] ECG, electrocardiogram; ED, emergency department; TTE, transthoracic echocardiography; LBBB, left bundle branch block; RBBB, right bundle branch block
TABLE 2.
Emergency coronary angiography findings and PCI procedural findings
| Parameter | n (%) |
|---|---|
| Overall coronary findings | 373 (74.6%) |
| Normal | 14 (2.8%) |
| 1-vessel disease | 261 (52.2%) |
| 2-vessel disease | 133 (26.6%) |
| 3-vessel disease | 63 (12.6%) |
| LM + 1-vessel disease | 5 (1%) |
| LM + 2-vessel disease | 10 (2%) |
| LM + 3-vessel disease | 14 (2.8%) |
| Spontaneous coronary artery dissection | 0 |
| Culprit vessel | 183 (36.6%) |
| RCA | 243 (41.7%) |
| LAD | 226 (38.8%) |
| Cx | 96 (16.5%) |
| LM | 14 (2.4%) |
| RI | 4 (0.7%) |
| TIMI flow | |
| TIMI 0 | 62.60% |
| TIMI 1 | 9.30% |
| TIMI 2 | 18.40% |
| TIMI 3 | 9.80% |
| In-stent restenosis | 10 (2%) |
| In-stent thrombosis | 6 (1.2%) |
| Percutaneous coronary intervention | 10 (2.0%) |
| During index procedure | 477 (95.4%) |
| Planned after discharge | 6 (1.2%) |
| Not performed/planned | 17 (3.4%) |
| PCI attempted | 477 (95.4%) |
| Primary PCI | 447 (93.7%) |
| Rescue PCI | 27 (5.6%) |
| Pharmacoinvasive strategy | 3 (0.62%) |
| Arterial access | |
| Radial artery | 306 (61.2%) |
| Femoral artery | 194 (38.8%) |
| Adjuvant therapies/equipment | 84 (16.8%) |
| Thrombectomy | 84 (16.8%) |
| Angioplasty with at least one stent (no. of patients) | 428 |
| One stent | 333 |
| Two stents | 82 |
| Three stents | 9 |
| Four stents | 4 |
| Median stent length (mm) | 23.18–28] |
| Median stent diameter (mm) | 3.3–3.5] |
| Lesions treated with DEB | 3 (0.5%) |
| Median DEB diameter | 2.5.2.5–2.5] |
| POBA | 33 (5.7%) |
| Successful PCI | 461 (96.6%) |
| Any periprocedural events | 37 (7.4%) |
| Type of periprocedural events | 60 (12%) |
| Bradyarrhythmia requiring pacing | 5 (1%) |
| Arrhythmia requiring cardioversion | 5 (1%) |
| Coronary perforation | 1 (0.2%) |
| Coronary dissection persisting | 1 (0.2%) |
| Access site-related complication | 3 (0.6%) |
| Stroke/TIA | 1 (0.2%) |
| Cardiogenic shock | 11 (2.2%) |
| Death | 3 (0.6%) |
| Other | 7 (1.4%) |
| Complete revascularization | 269 (53.8%) |
| Glycoprotein IIb/IIIa inhibitors | 0 |
| Pharmacological vascular support | 27 (5.4%) |
| Any mechanical circulatory support | 13 (2.6%) |
| Mechanical circulatory support type | |
| IABP | 10 (2%) |
| ECMO | 3 (0.6%) |
[i] Cx, circumflex artery; DEB, drug-eluting balloon; ECMO, extracorporeal membrane oxygenation; IABP, intra-aortic balloon pump; LAD, left anterior descending; LM, left main coronary; PCI, percutaneous coronary intervention; POBA, plain-old balloon angioplasty; RCA, right coronary artery; RI, intermediate ramus; TIA, transient ischemic attack
TABLE 3.
Comparison of time intervals between the two methods of arrival at the PCI center. Values are expressed in min (medians).
| Ambulance from home | Transportation from another hospital | p value | |
|---|---|---|---|
| Symptoms to ambulance (time to FMC) | 126 (53–257) | N/A | N/A |
| Symptoms to first ECG | 132 (78–327) | 245 (120–465) | 0.003 |
| Ambulance to hospital | 60 (40–95) | N/A | N/A |
| Symptoms to hospital arrival | 203 (126–371) | 372 (260–614) | <0.0001 |
| First ECG to hospital arrival (EMS delay) | 40 (5–76) | 119 (53–204) | <0.0001 |
| Hospital arrival to arterial access (ED delay) | 39 (27–60) | 46 (33–71) | 0.08 |
| Hospital arrival to wire passage | 57 (45–78) | 66 (50–92) | 0.04 |
| Arterial access to wire passage | 17 (13–24) | 18 (14–24) | 0.07 |
| Arterial access to revascularization | 24 (18–32) | 25 (20–33) | 0.33 |
| Wire passage to revascularization | 5 (3–10) | 5 (3–10) | 0.99 |
| Ambulance to revascularization (FMC to revascularization) | 134 (109–197) | N/A | N/A |
| First ECG to wire crossing | 112 (71–160) | 190 (114–268) | <0.0001 |
| First ECG to revascularization | 117 (73–167) | 200 (117–290) | <0.0001 |
| Hospital arrival to revascularization (door-to-balloon time) | 63 (49–88) | 72 (55–99) | 0.06 |
| Symptoms onset to revascularization(TIT) | 260 (199–441) | 453 (333–635) | <0.0001 |
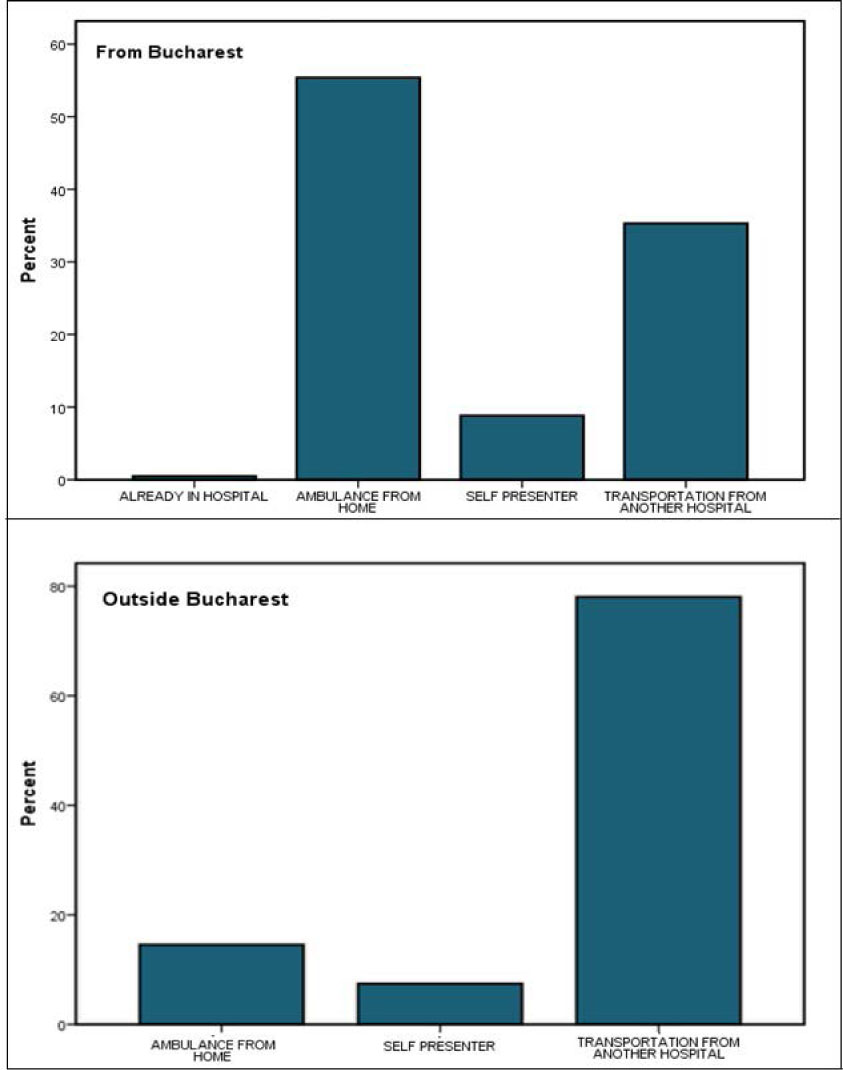
FIGURE 1.
Arrival method to the PCI center according to scene of symptoms onset
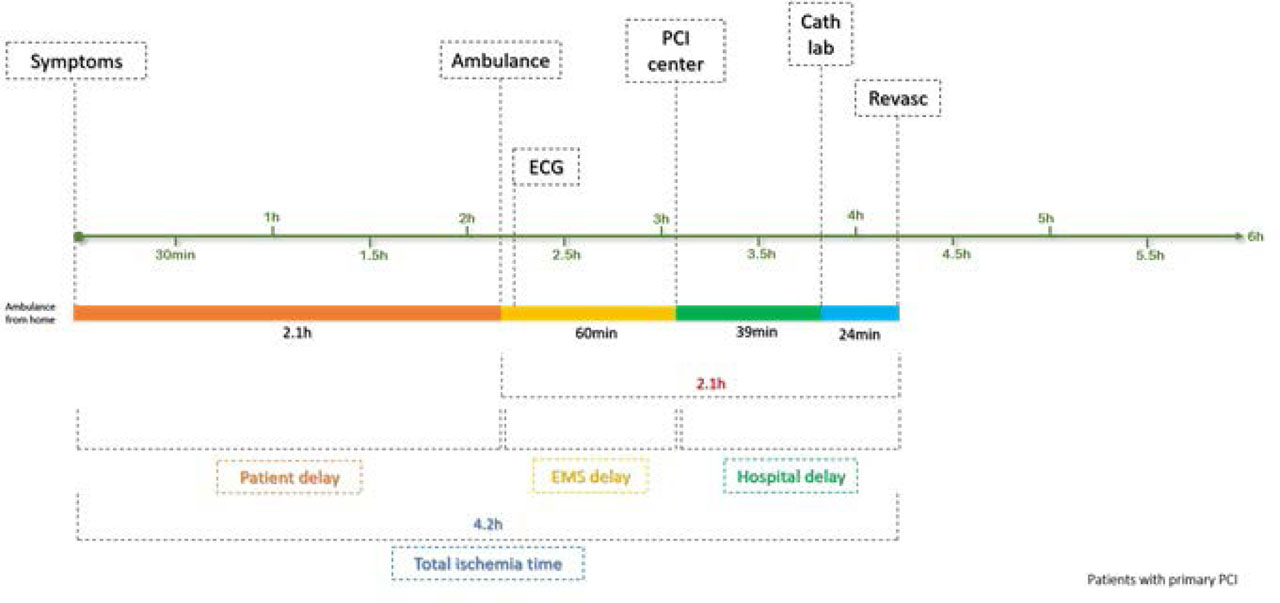
FIGURE 2.
Visual representation of time intervals for patients arriving to the PCI center via primary route (6-hour time scale)
TABLE 4.
Total ischemic time by categories of time intervals as a function of method of arrival
| Arrival method (p < 0.0001) | Revascularization timing categories | |||
|---|---|---|---|---|
| <2 h | 2–6 h | 6–12 h | >12 h | |
| By ambulance | 4.6% | 58% | 29% | 8.4% |
| Transfer from another hospital | 0.5% | 31% | 50.2% | 18% |
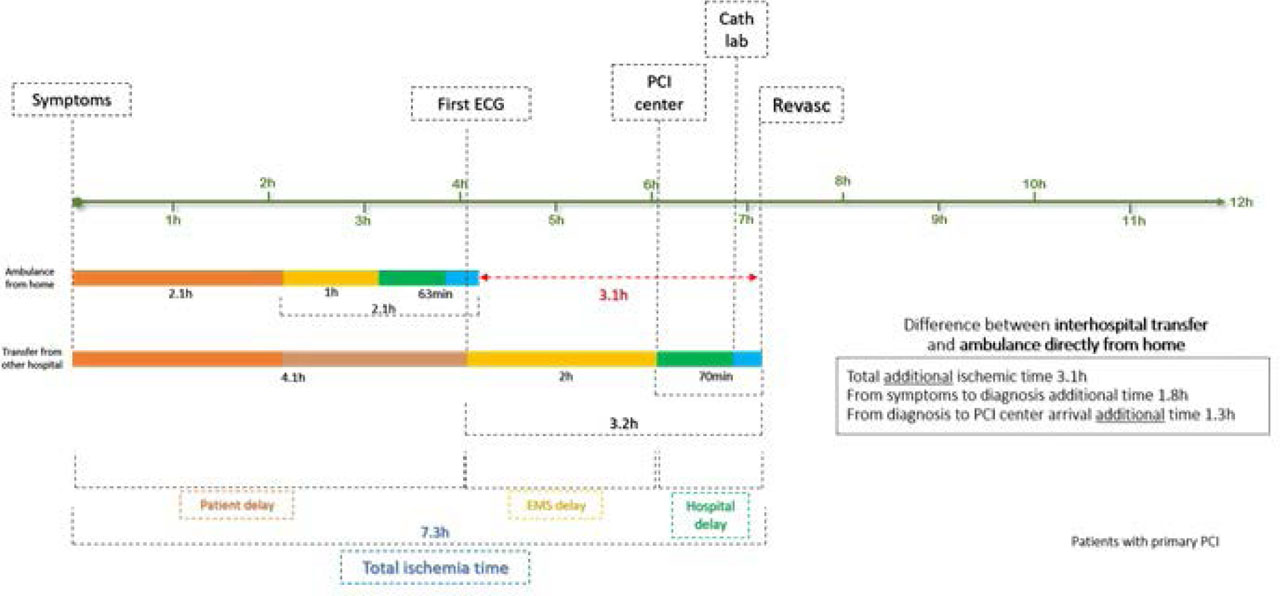
FIGURE 3.
Visual representation of time intervals for patients arriving to the PCI center via secondary route and comparison with primary route (12-hour time scale)
TABLE 5.
Achievement of target time intervals in patients who underwent pPCI
| Interval | Target | Percentage achieved |
|---|---|---|
| FMC to ECG | ≤10 min | 63 (40.3%) |
| Diagnostic to wire passage (overall) | ≤120 min | 159 (35.5%) |
| Diagnosis to wire passage (for self-presenters) | ≤60 min | 14 (29.1%) |
| ≤120 min | 29 (60.4%) | |
| Diagnosis to wire passage (for ambulance arrival) | ≤120 min | 73 (46.7%) |
| Diagnosis to wire passage (for transfers) | ≤120 min | 56 (18.9%) |
| Door-to-balloon | ≤90 min | 300 (67.1%) |