FIGURE 1.
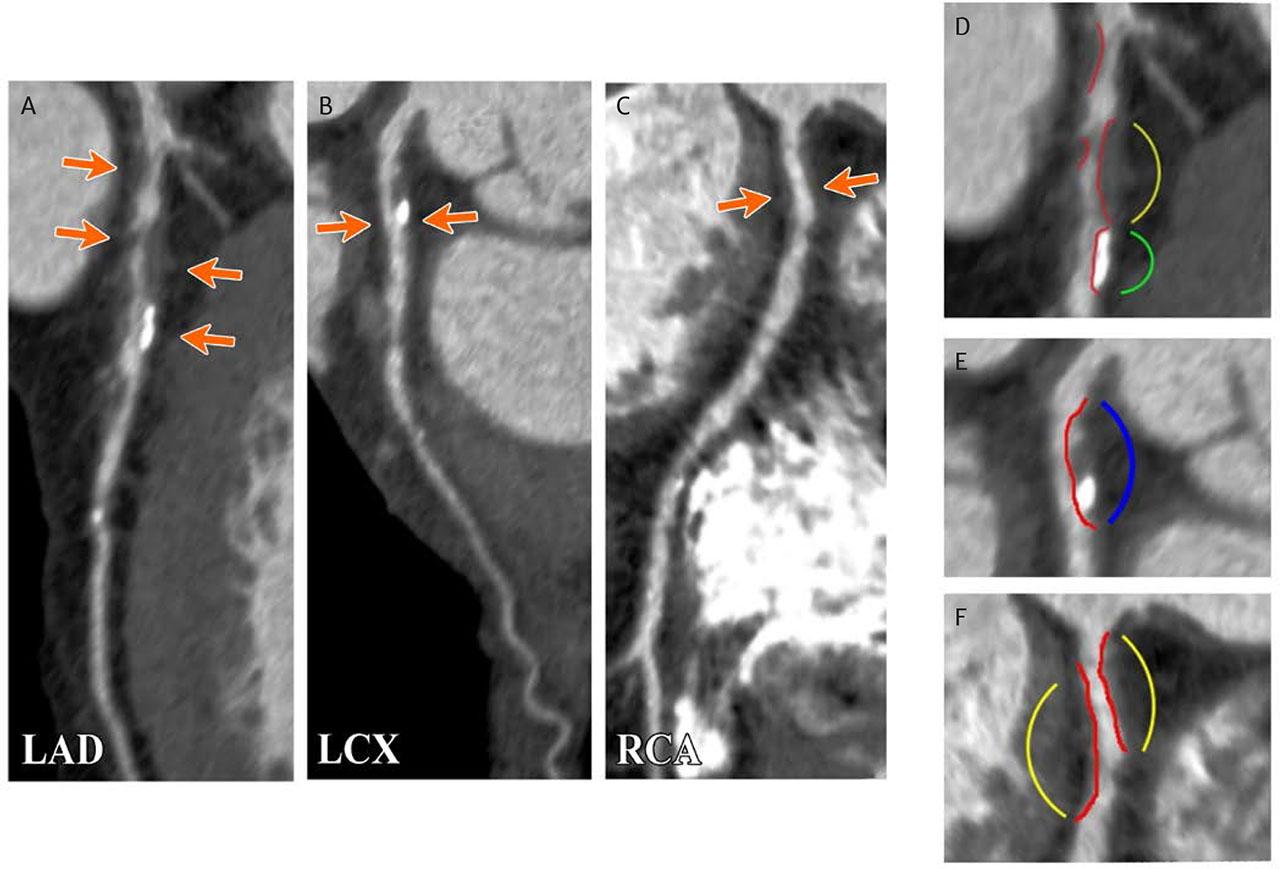
FIGURE 2.
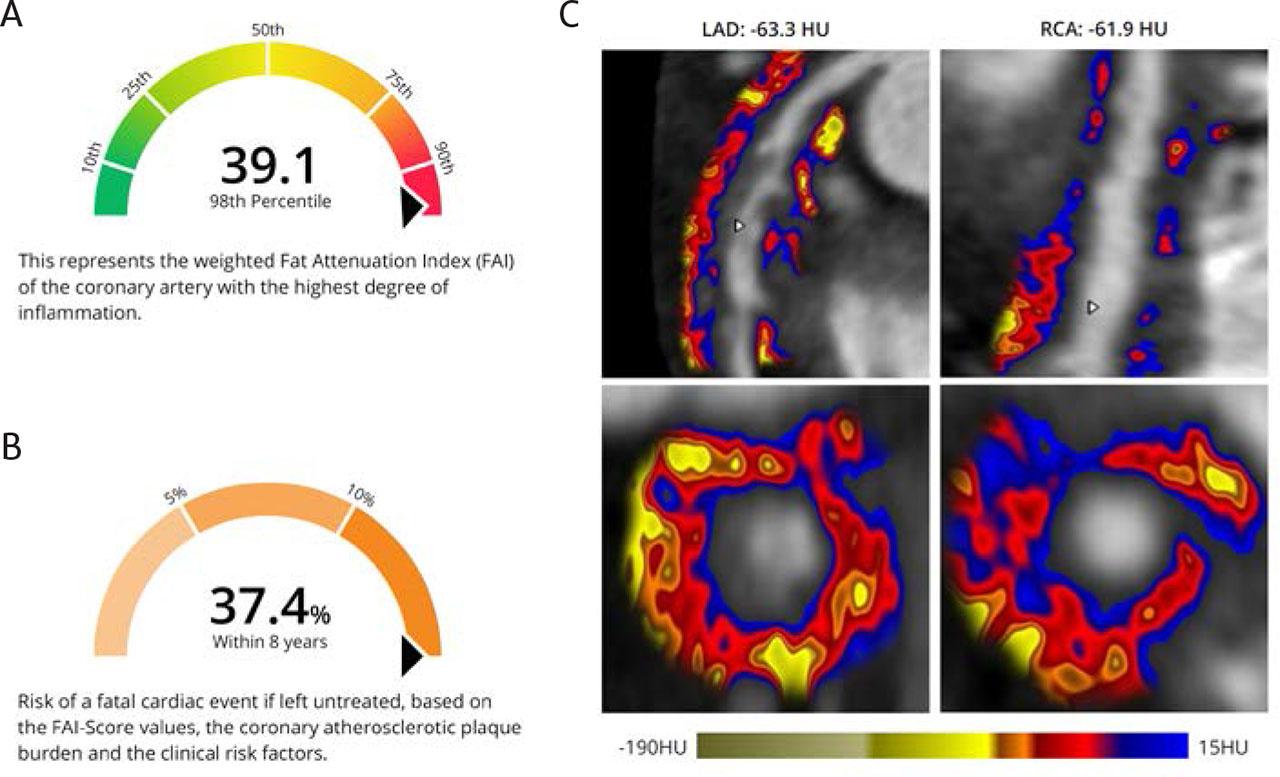
FIGURE 3.
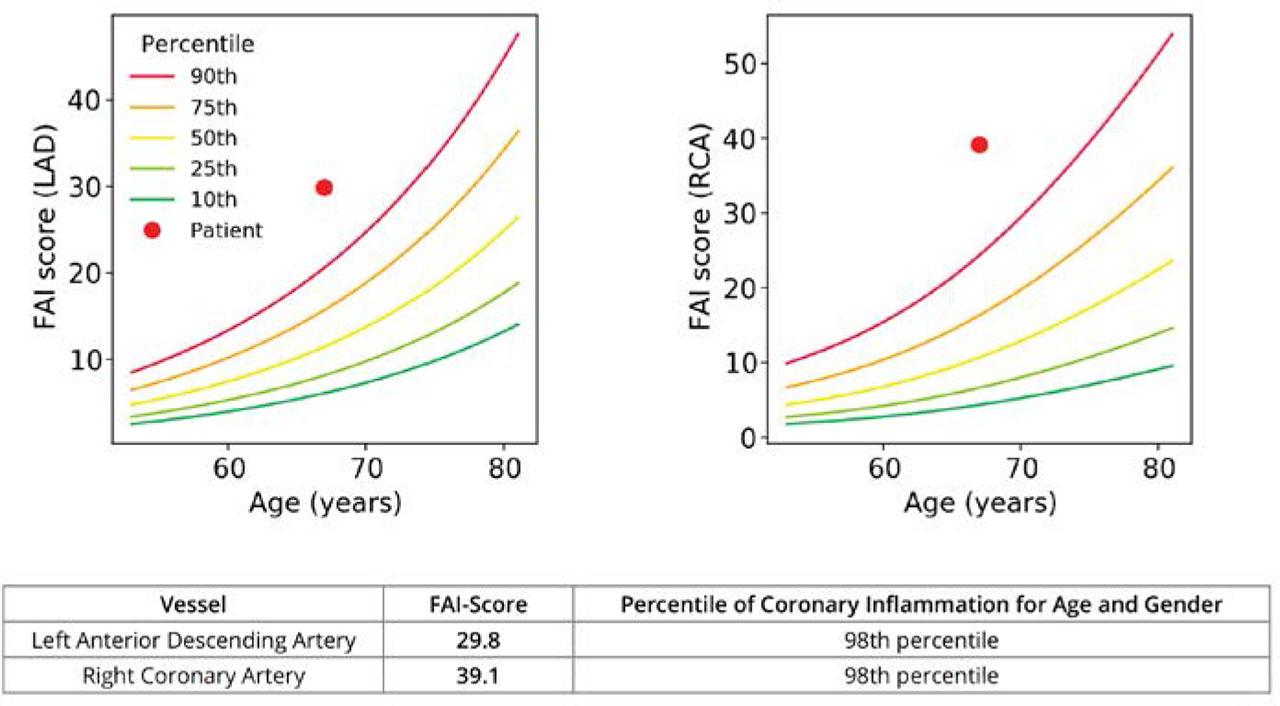
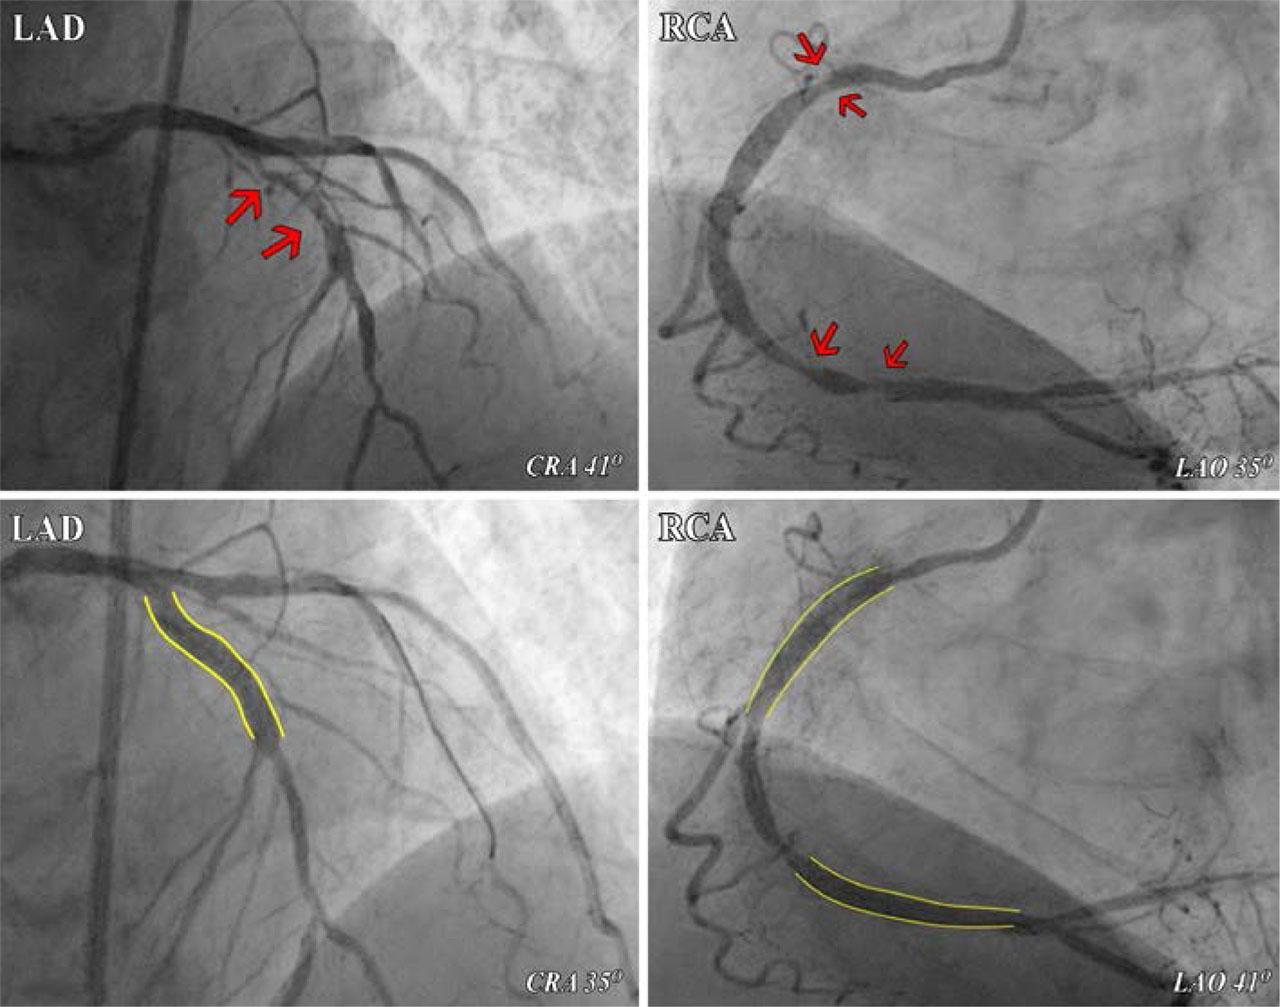
FIGURE 4.
© 2023 Emanuel Blîndu, Botond-Barna Mátyás, Balázs Bajka, Corneliu-Florin Buicu, Monica Chițu, Imre Benedek, published by Asociatia Transilvana de Terapie Transvasculara si Transplant KARDIOMED
This work is licensed under the Creative Commons Attribution-NonCommercial-NoDerivatives 3.0 License.