
Fig. 1.
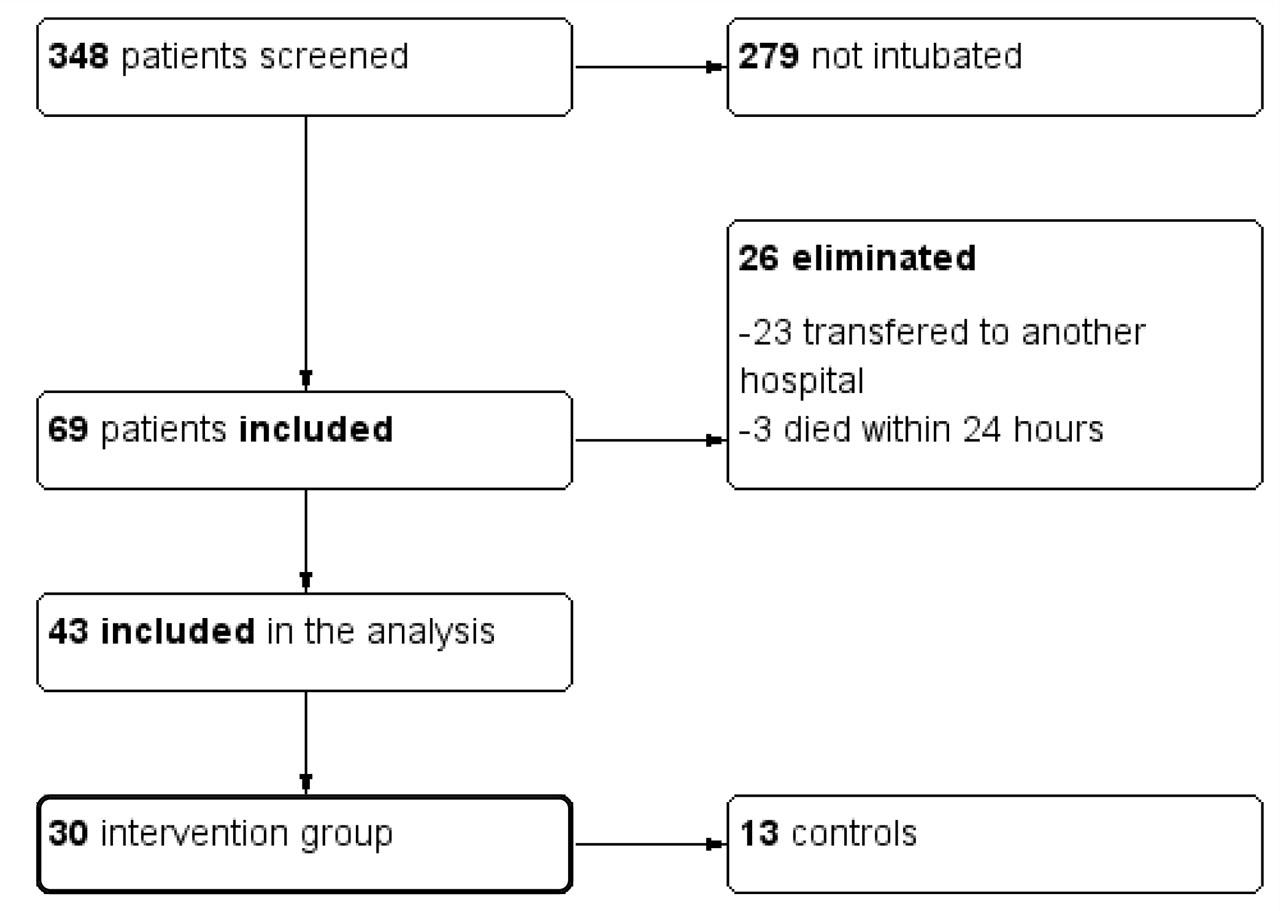
Fig. 2.
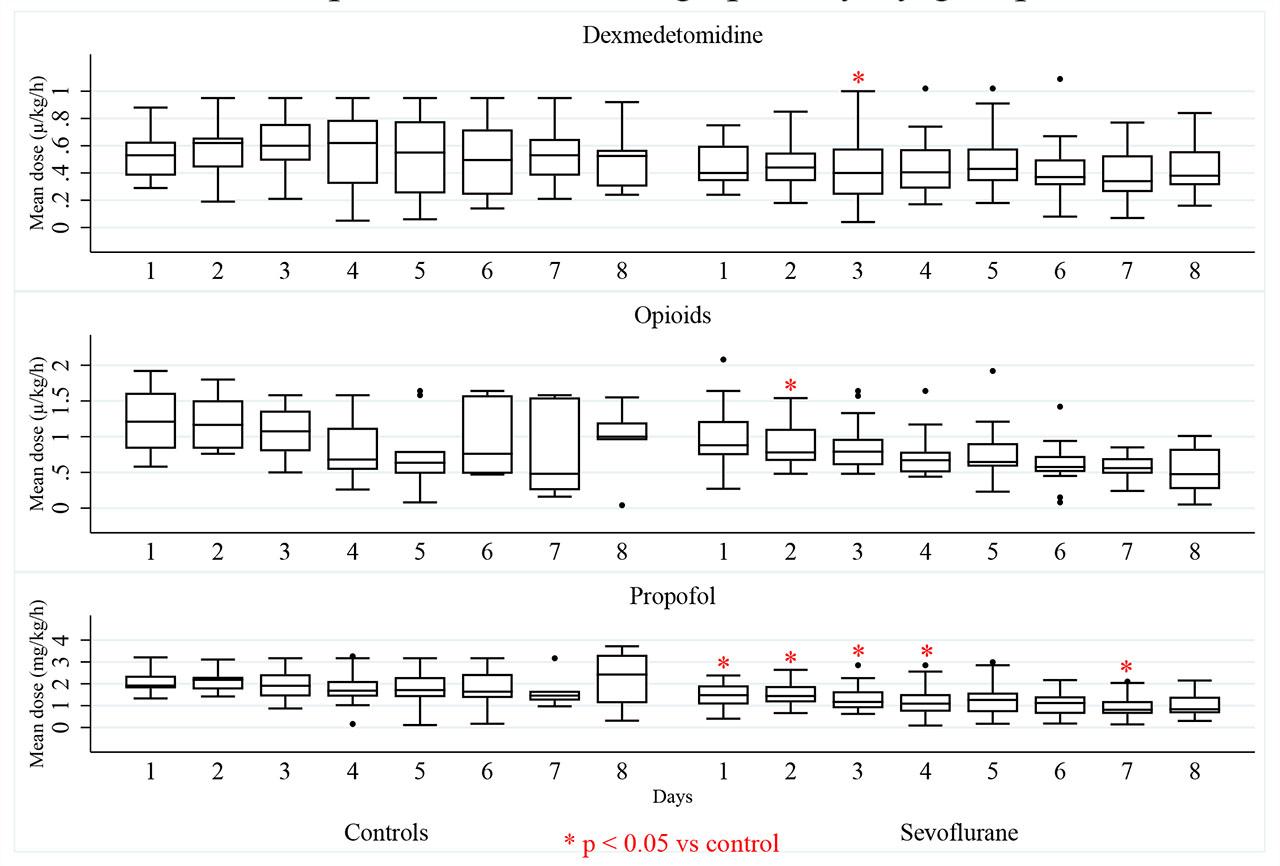
Fig. 3.
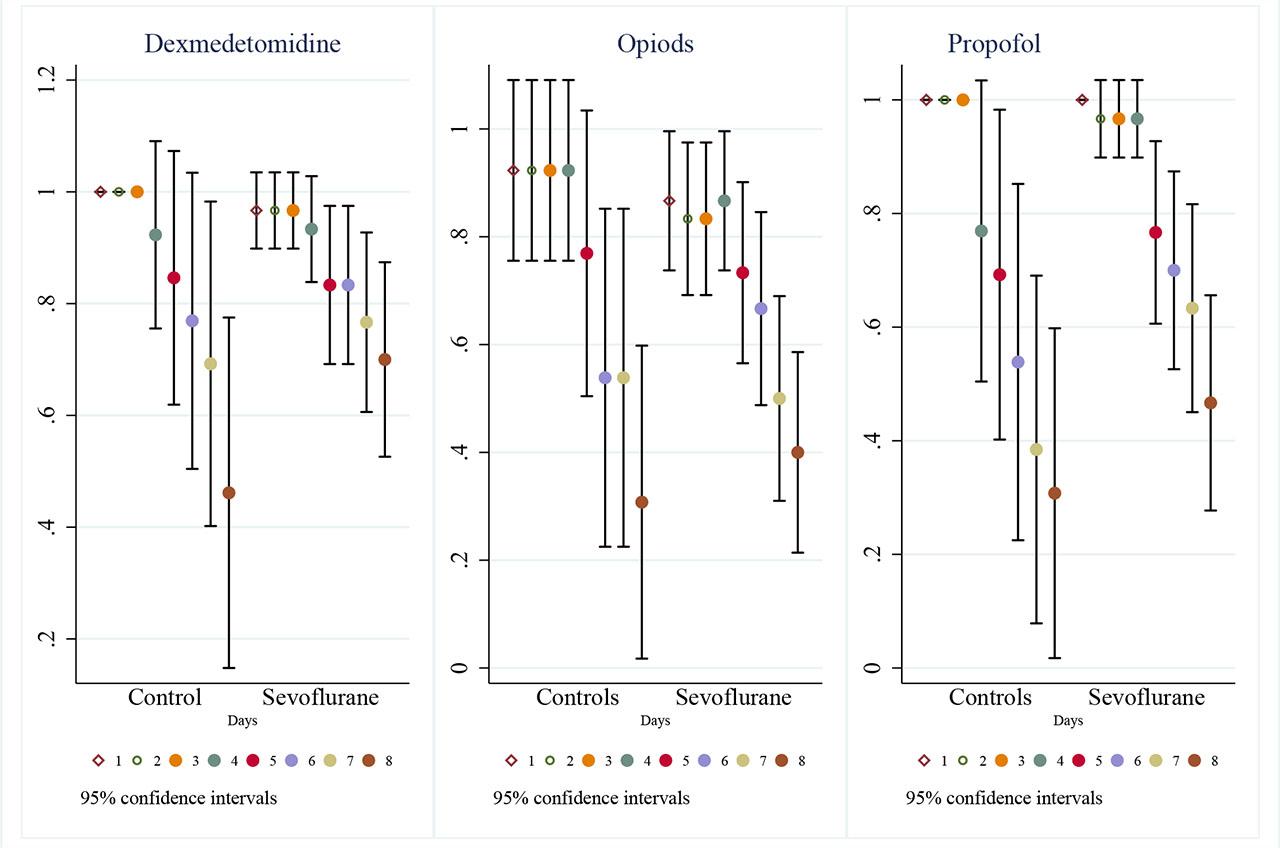
Fig. 4.
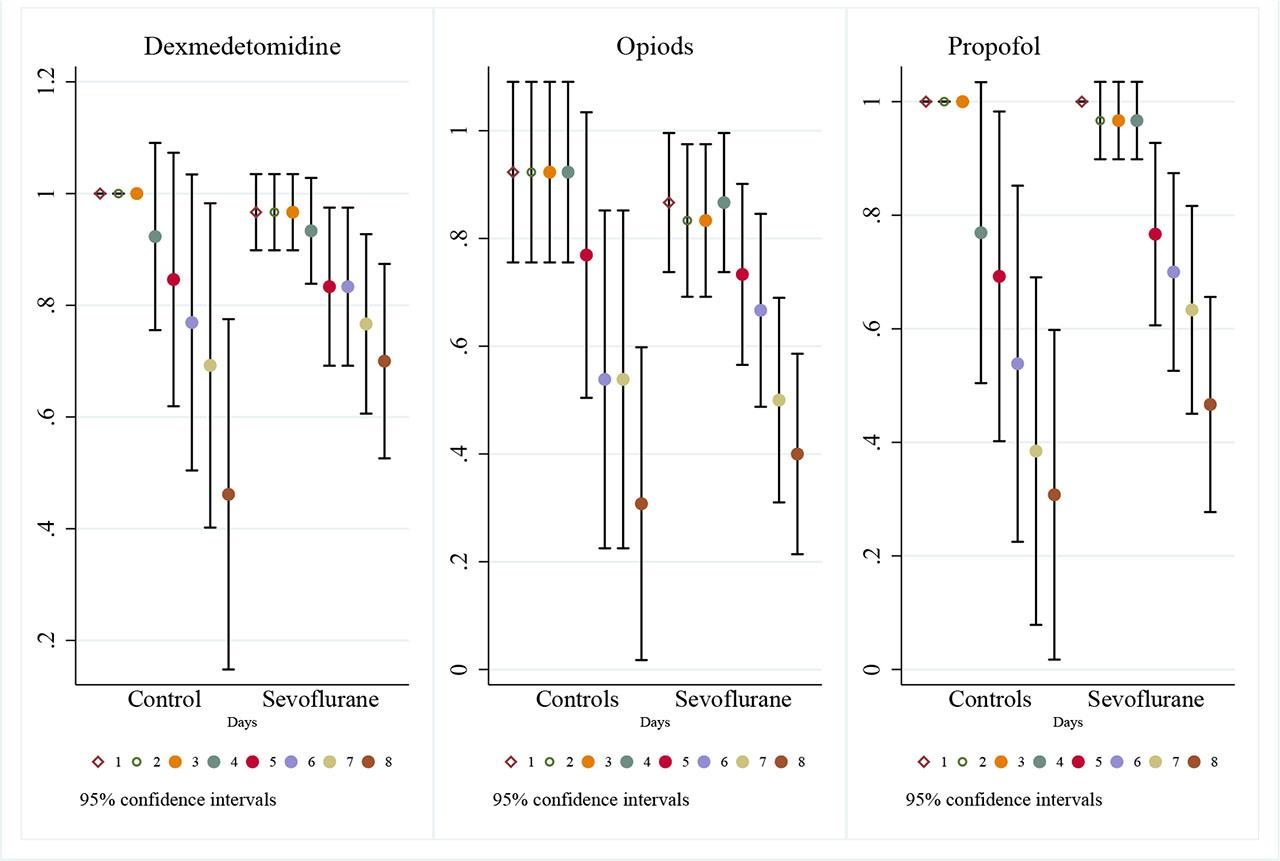
Fig. 5.
Multiple linear regression analysis for cumulative dose for each intravenous sedative
| Opioids | OR | LCI | UCI | P |
| Sevoflurane use | 0.151 | 0.140 | 1.638 | 0.107 |
| SOFA Score | 1.088 | 0.459 | 2.579 | 0.829 |
| Maximum lactate on day one | 1.357 | 0.613 | 3.007 | 0.407 |
| Calcium | 1.968 | 0.898 | 4.309 | 0.082 |
| Procalcitonin | 3.194 | 1.139 | 8.952 | 0.031* |
| Propofol | OR | LCI | UCI | P |
| Sevoflurane use | 0.024 | 0.000 | 15.721 | 0.232 |
| SOFA Score | 0.510 | 0.139 | 1.866 | 0.278 |
| Maximum lactate on day one | 0.861 | 0.024 | 30.82 | 0.929 |
| Calcium | 8.756 | 1.640 | 46.73 | 0.016* |
| Procalcitonin | 14.32 | 0.954 | 214.8 | 0.053 |
| Dexmedetomidine | OR | LCI | UCI | P |
| Sevoflurane use | 0.813 | 0.173 | 3.808 | 0.783 |
| SOFA Score | 1.004 | 0.741 | 1.360 | 0.976 |
| Maximum lactate on day one | 1.044 | 0.563 | 3.725 | 0.423 |
| Calcium | 1.411 | 0.943 | 2.113 | 0.090 |
| Procalcitonin | 1.865 | 0.936 | 3.716 | 0.074 |
Baseline clinical characteristics of patients according to sevoflurane use
| Variable | Controls (n= 13) | Sevoflurane (n=30) | Total (n=43) | p value |
|---|---|---|---|---|
| Demographic characteristics | ||||
| Age (years) | 46 (40–61) | 54 (48–60) | 53 (45–61) | 0.277 |
| Male sex (%) | 11 (84.6) | 26 (86.6) | 37 (86.0) | 1.000 |
| Weight (kg) | 83 (75–92) | 85 (75–95) | 85 (75–95) | 0.760 |
| Height (m) | 166 (162–175) | 172 (165–177) | 171 (163–177) | 0.307 |
| Systemic Hypertension (%) | 4 (30.7) | 8 (26.6) | 12 (27.9) | 1.000 |
| Diabetes Mellitus (%) | 3 (23) | 10 (33.3) | 13 (30.2) | 0.720 |
| Obesity (%) | 7 (53.8) | 16 (53.3) | 23 (53.4) | 1.000 |
| COPD (%) | 0 | 1 (3.3) | 1 (2.3) | 1.000 |
| Asthma (%) | 0 | 2 (6.6) | 2 (4.6) | 1.000 |
| Sleep apnea obstructive syndrome (%) | 1 (7.6) | 2 (6.6) | 3 (6.9) | 1.000 |
| Smoking (%) | 0 (0) | 1 (3.3) | 1 (2.3) | 1.000 |
| Hypothyroidism (%) | 2 (15.3) | 0 (0) | 2 (4.6) | 0.086 |
| Immunodeficiencies (%) | 2 (15.3) | 1 (3.3) | 3 (6.9) | 0.213 |
| Hematology (%) | 2 (15.3) | 2 (6.6) | 4 (9.3) | 0.572 |
| Chronic Heart Failure (%) | 1 (7.6) | 1 (3.3) | 2 (4.6) | 0.518 |
| CORADS 6 (%) | 2 (15.3) | 10 (33.3) | 12 (27.9) | 0.290 |
| Total SOFA | 6 (5–7) | 6 (5–7) | 6 (5–7) | 0.805 |
| Respiratory SOFA | 3 (2–3) | 3 (3–3) | 3 (3–3) | 0.433 |
| CV SOFA | 3 (3–4) | 3 (3–3) | 3 (3–3) | 0.405 |
| Renal SOFA | 0 (0–0) | 0 (0–0) | 0 (0–0) | 0.344 |
| Hematological SOFA | 0 (0–0) | 0 (0–0) | 0 (0–0) | 0.029* |
| Hepatic SOFA | 0 (0–0) | 0 (0–0) | 0 (0–0) | 0.172 |
| Sevoflurane dose | N/A | 10 (9.3–10) | 10 (9.3–10) | N/A |
| Sevoflurane use day 1 (%) | N/A | 20 (66.6%) | 20 (46.5%) | 0.000* |
| Day of symptoms at admission | 9 (7–12) | 9 (7–12) | 9 (7–12) | 0.968 |
| Day of symptoms at intubation | 12 (9–14) | 9 (8–12) | 10 (8–14) | 0.143 |
| Heart Rate | ||||
| Maximum | 92 (80–100) | 84 (80–93) | 85 (80–96) | 0.404 |
| Minimum | 62 (55–71) | 57 (50–63) | 58 (52–65) | 0.177 |
| Mean Arterial Pressure | ||||
| Maximum | 95 (90–97) | 94 (90–103) | 95 (90–99) | 0.915 |
| Minimum | 72 (70–74) | 70 (68–73) | 71 (68–74) | 0.482 |
| Maximum lactate at day one (mmol/L) | 1.4 (1.3–1.6) | 1.9 (1.6–2.3) | 1.7 (1.4–2.3) | 0.023* |
| PEEP maximum day 1 | 10 (9–12) | 12 (10–12) | 12 (10–12) | 0.122 |
| PaO2 / FiO2 | 149 (126–204) | 156 (124–192) | 151 (124–199) | 0.801 |
| Urinary flow (mL) | 1442 (980–1890) | 1652 (950–2130) | 1630 (950–2130) | 0.894 |
| Hemoglobin (g/dL) | 14.1 (12.8–15.4) | 15.7 (14.1–16.6) | 14.9 (13.9–16.5) | 0.095 |
| Leucocytes (× 109/L) | 7.15 (6.43–14.7) | 11.9 (9.1–13.7) | 11.6 (7.15–13.7) | 0.272 |
| Neutrophiles (× 109/L) | 5.48 (5.06–11.7) | 10.2 (6.93–11.7) | 9.53 (5.79–11.7) | 0.095 |
| Lymphocytes (× 109/L) | .75 (.6– .94) | .99 (.74 – 1.25) | .91 (.62 – 1.23) | 0.109 |
| Platelets (× 109/L) | 223 (195–340) | 233 (206–312) | 233 (195–317) | 0.926 |
| Creatinine (mg/dL) | 0.9 (0.6– 1.1) | 0.7 (0.7– 0.8) | 0.8 (0.7– 0.9) | 0.501 |
| BUN (mg/dL) | 19 (14–24) | 16 (12–21) | 16 (13–23) | 0.499 |
| Sodium (mEq/L) | 139 (137–141) | 140 (138–142) | 140 (137–142) | 0.154 |
| Potassium (mEq/L) | 4.1 (3.8–4.2) | 4.3 (3.9–4.7) | 4.1 (3.8– 4.6) | 0.217 |
| Calcium (mg/dl) | 8.1 (7.6–8.5) | 8.6 (8.3–8.9) | 8.5 (8.1–8.8) | 0.003* |
| RCP (mg/L) | 23.6 (19.2–36.6) | 23 (16.3–35) | 23.4 (16.5–36.6) | 0.630 |
| PCT (ng/mL) | 0.4 (0.17–1.17) | 0.105 (0.05–0.36) | 0.17 (0.07–0.55) | 0.003* |
| Total Bilirubin (mg/dL) | 0.61 (0.38–.77) | 0.65 (0.44–0.95) | 0.65 (0.43–0.83) | 0.155 |
| Albumin (g/dL) | 2.8 (2.6–3.7) | 3 (2.9–3.4) | 3 (2.7–3.4) | 0.437 |
| AST (U/L) | 51 (41–68) | 44 (32–59) | 45 (33–62) | 0.274 |
| ALT (U/L) | 43 (19–57) | 43 (27–54) | 43 (27–56) | 0.663 |
| LDH (U/L) | 427 (404–512) | 448 (326–513) | 436 (369–513) | 0.606 |
| IL-6 (pg/mL) | 69.9 (44.9–188) | 104 (79–181) | 102 (57–181) | 0.590 |
| D-Dimer (ng/mL) | 1391 (888–1764) | 850.5 (525–1883) | 1099 (607–1883) | 0.255 |
| Ferritin | 1423 (553.5–2815) | 962.8 (649–2113) | 1113 (625.3–2283) | 0.737 |
| Fibrinogen | 641 (518–738) | 724 (641–799) | 704 (583–782) | 0.064 |
| Propofol (%) | 13 (100%) | 30 (100%) | 43 (100%) | NT |
| Propofol dose on day 1 mg/kg/h | 1.92 (1.79–2.37) | 1.48 (1.05–1.93) | 1.71 (1.09–2.12) | 0.001* |
| Dexmedetomidine use on day 1 (%) | 13 (100%) | 29 (96.6%) | 42 (97.6%) | 1.000 |
| Dexmedetomidine dose µg/kg/h | 0.53 (0.38–0.63) | 0.4 (0.34–0.6) | 0.42 (0.34–0.62) | 0.231 |
| Fentanyl (%) | 12 (92.3%) | 26 (86.6%) | 38 (88.3%) | 1.000 |
| Opioids (dose) µg/kg/min | 1.21 (0.83–1.61) | 0.88 (0.74 – 1.22) | 0.95 (0.77–1.3) | 0.078 |
| Remifentanil use in day 1 (%) | 1 (7.6%) | 3 (10%) | 4 (9.3%) | 0.811 |
| Remifentanil (dose) | 3.37 (3.37–3.37) | 1.47 (1.26–1.66) | 1.56 (1.36–2.51) | 0.179 |
| Cisatracurium (dose) | - | 0.1 (.09–.12) | 0.1 (.09–.12) | NT |
| Cisatracurium use in day 1 (%) | 0 (0%) | 14 (46.6%) | 14 (32.5%) | 0.003 |
| Rocuronium (dose) | 0.44 (0.31–0.61) | 0.44 (0.38–0.56) | 0.44 (0.34–0.61) | 0.637 |
| Rocuronium use in day 1 (%) | 6 (46.1%) | 9 (30%) | 15 (34.8%) | 0.324 |
| Norepinephrine (dose) | 0.05 (0.02–0.13) | 0.04 (0.02–0.08) | 0.04 (0.02–0.10) | 0.692 |
| Norepinephrine use in day 1 (%) | 12 (92.3%) | 27 (90%) | 39 (90.7%) | 1.000 |
| Fluid Balance on day 1 (mL) | 331 (−361–350) | 10.5 (−647–715) | 74 (−594–700) | 0.615 |
| Outcomes | ||||
| ICU days | 18 (16–20) | 16 (13–26) | 17 (13–23) | 0.550 |
| VAP (%) | 7 (53.8%) | 14 (46.6%) | 21 (48.8%) | 0.747 |
| Delirium (%) | 0 (0%) | 14 (46.6%) | 14 (32.5%) | 0.003* |
| Antipsychotics (%) | 2 (15.3%) | 20 (66.6%) | 22 (51.1%) | 0.002 |
| Mechanical Ventilation (hours) | 144 (115–156) | 206 (144–356) | 189 (125–241) | 0.005* |
| Mortality (%) | 2 (15.3%) | 4 (13.3%) | 6 (13.9%) | 1.000 |
| Reintubation (%) | 4 (30.7%) | 4 (13.3%) | 8 (18.6%) | 0.217 |
| Reintubation (hours) | 46 (13.5–88.5) | 42.5 (24.5–52.5) | 42.5 (16–64.5) | 0.772 |
| Wake-up time (hours) | 7 (5–16) | 6 (1–12) | 6.5 (3–13) | 0.376 |
| Propofol use (days) | 6 (4–8) | 7 (5–8) | 7 (4–8) | 0.235 |
| Dexmedetomidine use (days) | 7 (6–8) | 8 (6–8) | 8 (6–8) | 0.314 |
| Opioids use (days) | 7 (5–8) | 8 (6–8) | 7 (5–8) | 0.233 |
| Neuromuscular blockage (days) | 3 (0–4) | 5 (3–8) | 4 (2–7) | 0.057 |
Multiple linear regression analysis for total of days of use of each intravenous sedative
| Total days of Propofol use | OR | LCI | UCI | P |
|---|---|---|---|---|
| Sevoflurane use | 2.614 | 0.565 | 12.07 | 0.211 |
| SOFA Score | 1.270 | 0.903 | 1.787 | 0.163 |
| Maximum lactate on day one | 0.751 | 0.337 | 1.674 | 0.474 |
| Calcium | 1.729 | 1.212 | 2.466 | 0.003* |
| Procalcitonin | 1.040 | 0.976 | 1.108 | 0.215 |
| Total days of Dexmedetomidine use | OR | LCI | UCI | P |
| Sevoflurane use | 1.246 | 0.299 | 5.181 | 0.756 |
| SOFA Score | 1.113 | 0.810 | 1.529 | 0.498 |
| Maximum lactate on day one | 0.744 | 0.352 | 1.569 | 0.427 |
| Calcium | 2.203 | 1.583 | 3.066 | <0.001* |
| Procalcitonin | 1.024 | 0.966 | 1.086 | 0.405 |
| Total days of Opioid use | OR | LCI | UCI | P |
| Sevoflurane use | 1.224 | 0.297 | 5.040 | 0.774 |
| SOFA Score | 1.219 | 0.889 | 1.672 | 0.209 |
| Maximum lactate on day one | 1.239 | 0.590 | 2.600 | 0.561 |
| Calcium | 1.768 | 1.273 | 2.455 | 0.001* |
| Procalcitonin | 0.998 | 0.941 | 1.058 | 0.964 |
Logistic Regression Analysis for secondary outcomes
| Antipsychotic use | OR | LCI | UCI | P |
| Sevoflurane use | 18.682 | 1.965 | 177.5 | 0.011* |
| SOFA Score | 0.902 | 0.545 | 1.493 | 0.690 |
| Maximum lactate on day one | 1.073 | 0.422 | 2.724 | 0.882 |
| Calcium | 0.240 | 0.043 | 1.326 | 0.102 |
| Procalcitonin | 0.427 | 0.095 | 1.915 | 0.267 |
| Reintubacion | OR | LCI | UCI | P |
| Sevoflurane use | 0.679 | 0.095 | 4.813 | 0.699 |
| SOFA Score | 1.254 | 0.761 | 2.067 | 0.374 |
| Maximum lactate on day one | 1.793 | 0.681 | 4.719 | 0.237 |
| Calcium | 0.175 | 0.019 | 1.581 | 0.121 |
| Procalcitonin | 0.943 | 0.812 | 1.095 | 0.446 |
| NAVM | OR | LCI | UCI | P |
| Sevoflurane use | 0.912 | 0.164 | 5.049 | 0.917 |
| SOFA Score | 1.647 | 0.914 | 2.966 | 0.096 |
| Maximum lactate on day one | 1.201 | 0.479 | 3.010 | 0.696 |
| Calcium | 2.965 | 0.633 | 13.88 | 0.168 |
| Procalcitonin | 2.087 | 0.636 | 6.840 | 0.224 |