
Fig. 1.
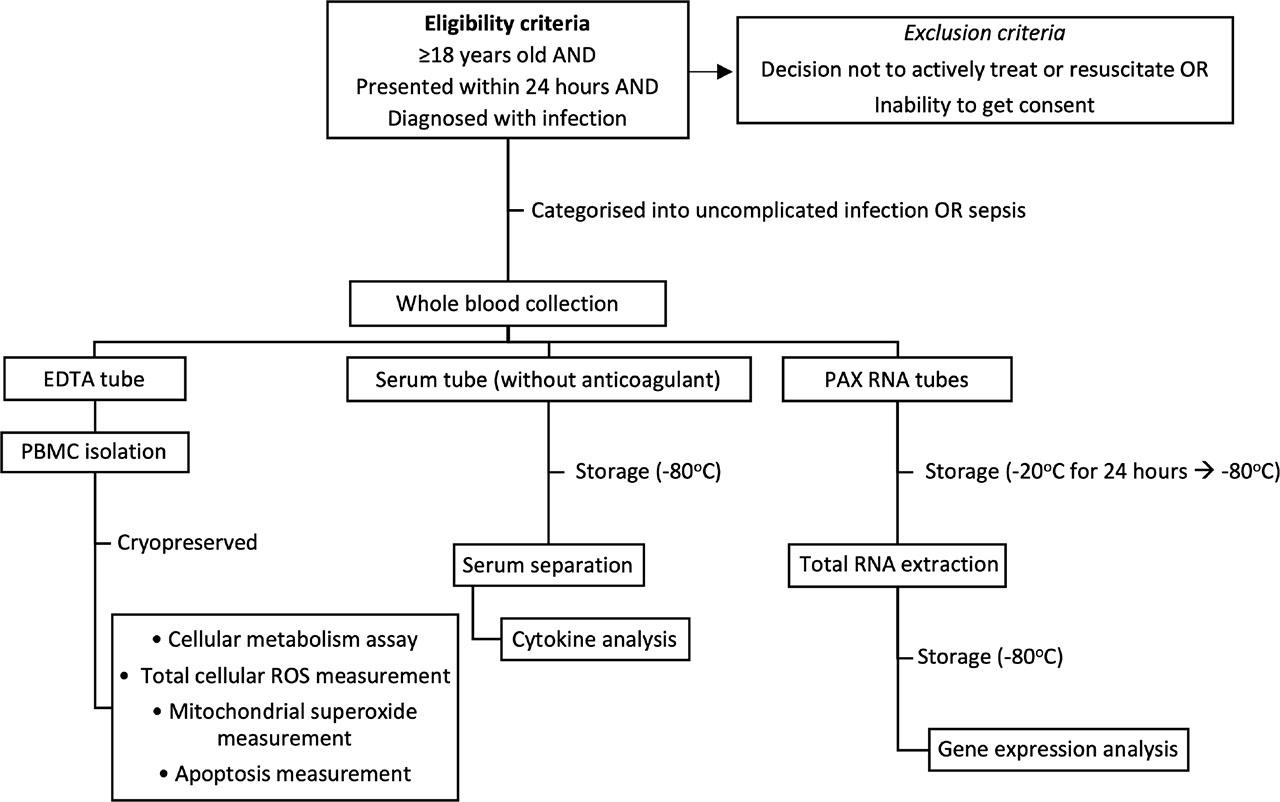
Fig. 2.
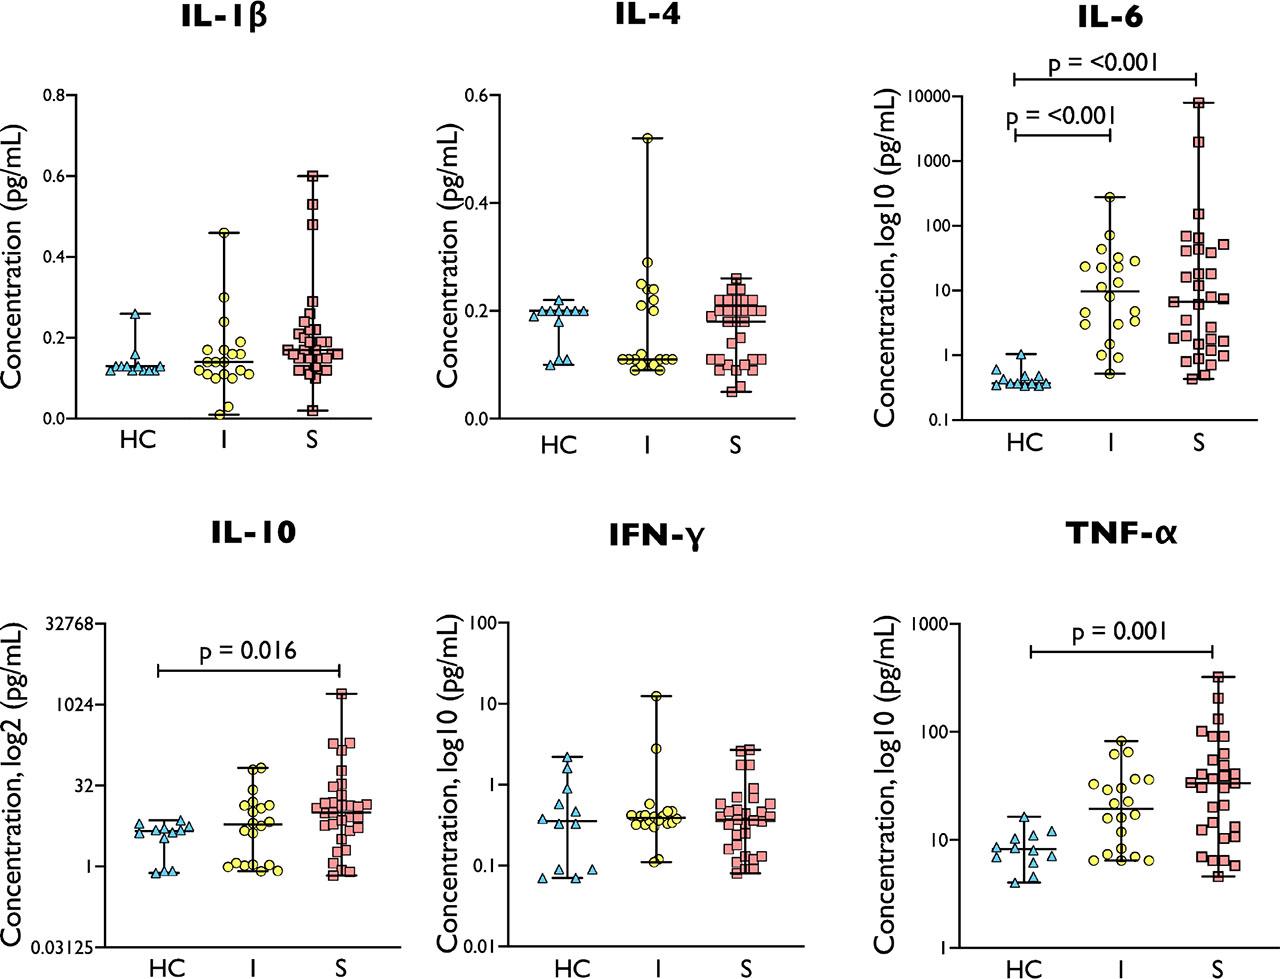
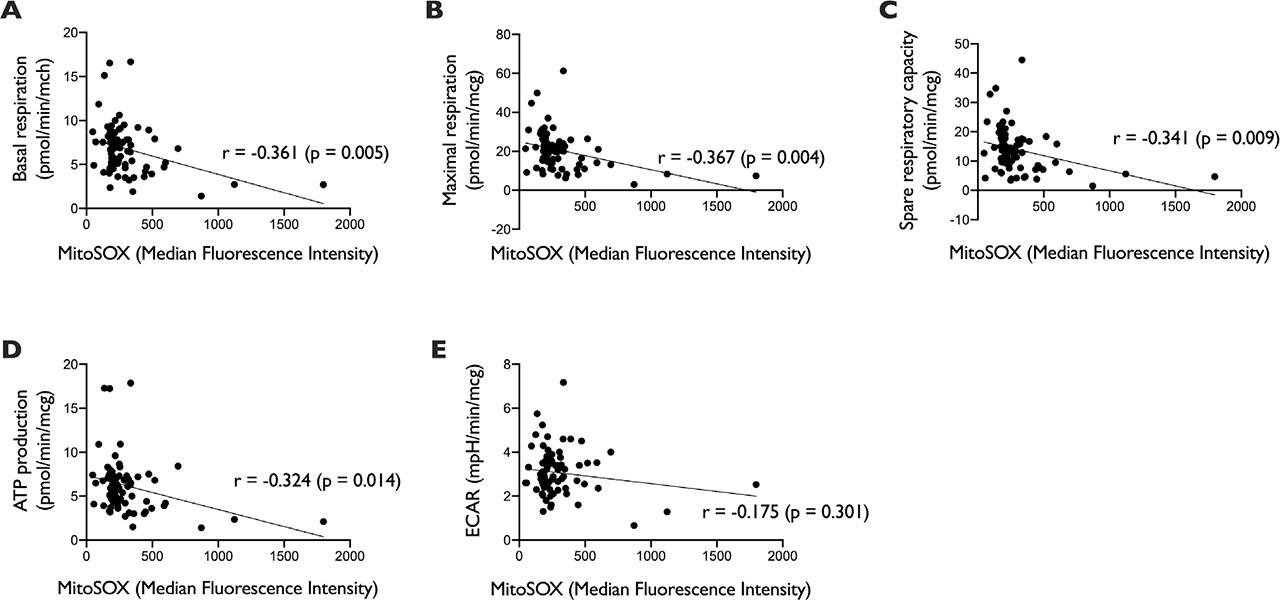
Fig. 3A.
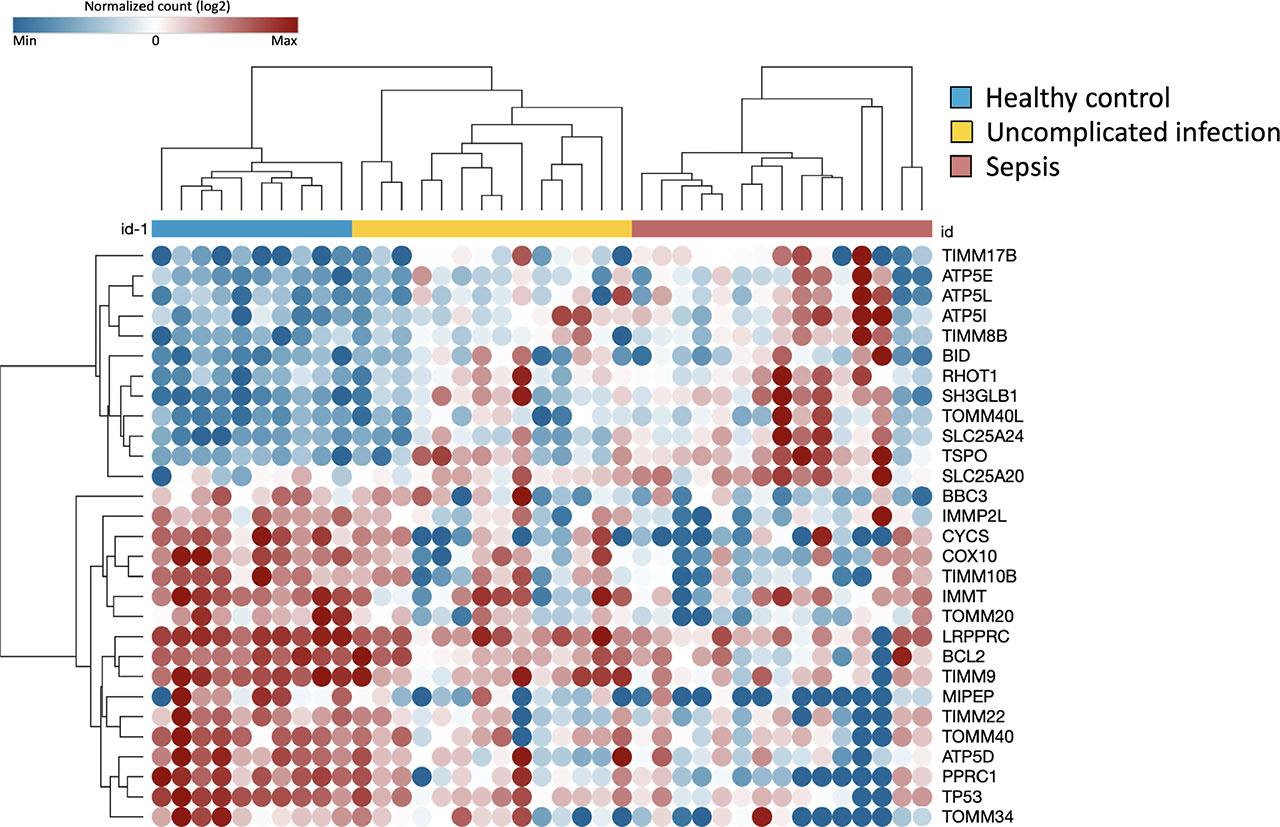
Fig. 3B.
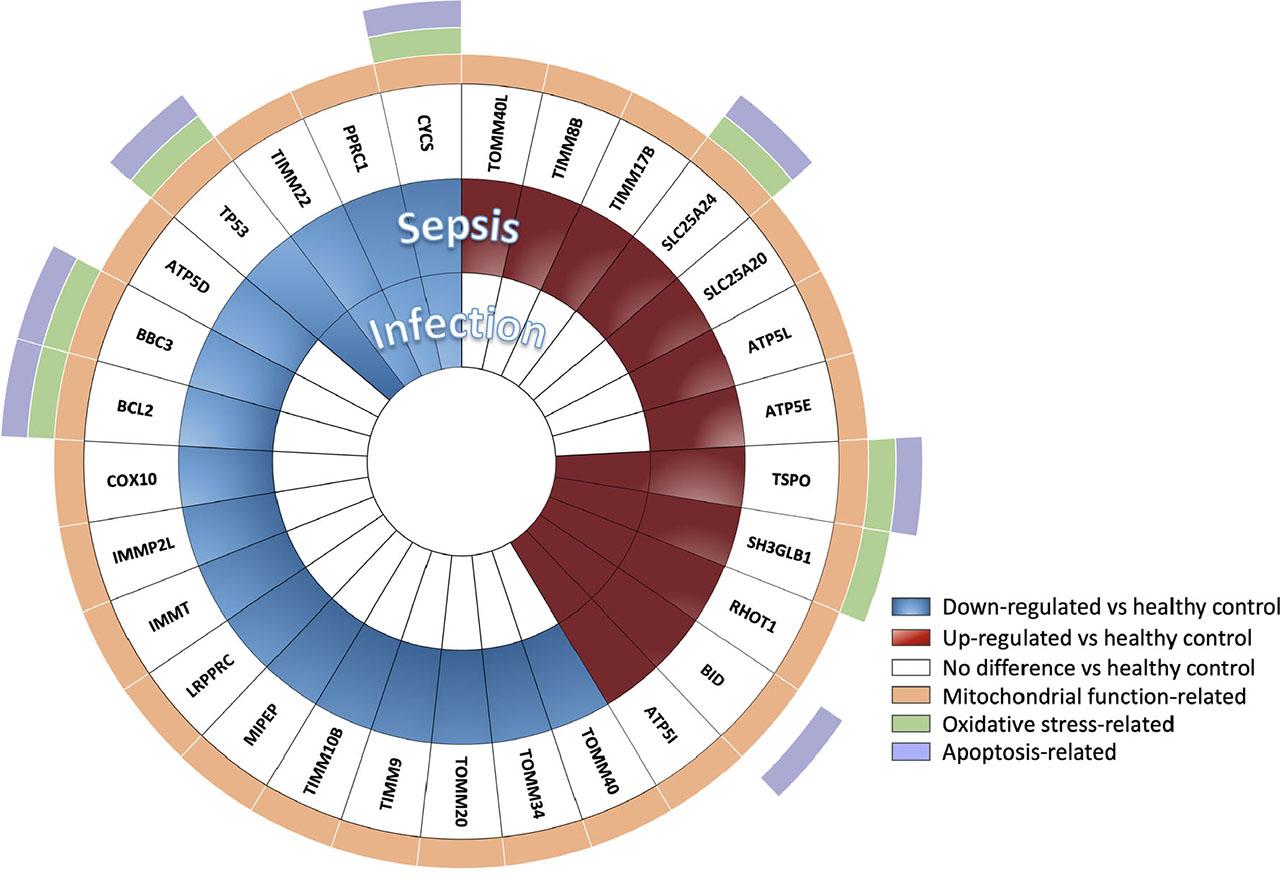
Fig. 4
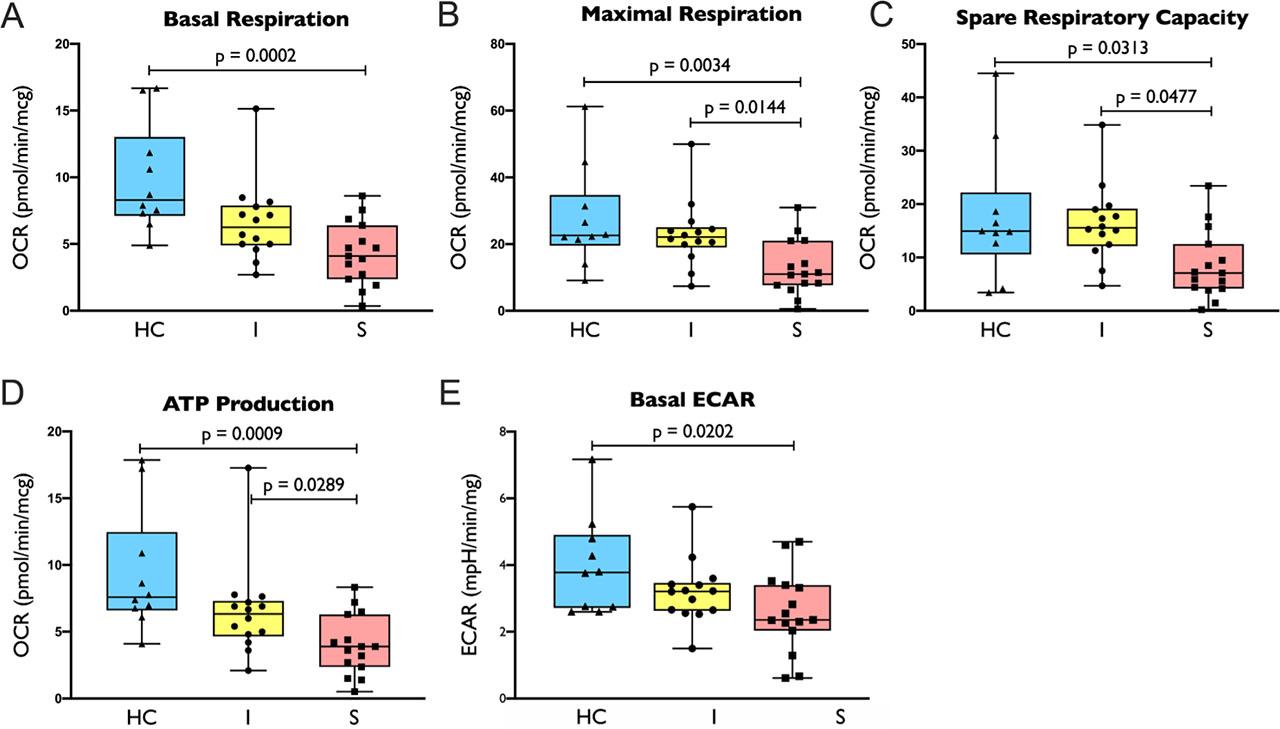
Figure 5
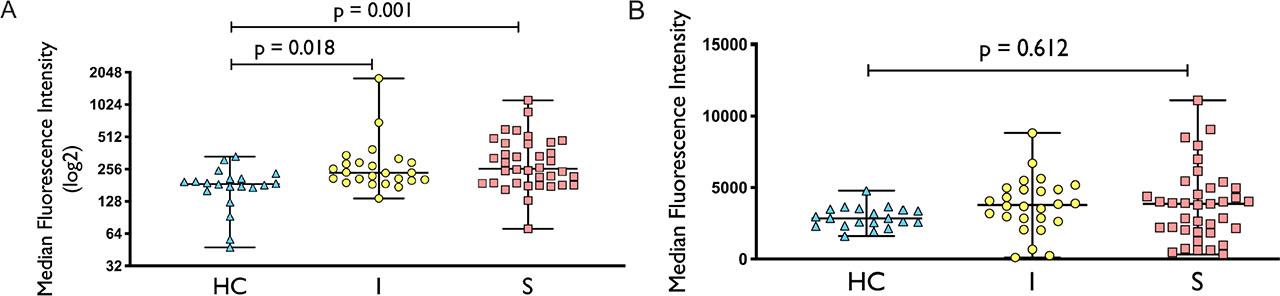
Fig. 6.
Patients Demographic and Clinical Characteristics (n = 67)
| Characteristics | Uncomplicated Infection | Sepsis | P value |
|---|---|---|---|
| N (%) | 27 (40.3) | 40 (59.7) | |
| Age – yr | 56.4 ± 18.12 | 69.1 ± 13.83 | 0.002 |
| Male sex – no. (total no., %) | 19 (70.4) | 20 (50) | 0.099 |
| Source of infection | |||
| Respiratory tract (%) | 12 (44.4) | 20 (50) | 0.6551 |
| Urinary tract (%) | 4 (14.8) | 12 (30) | 0.1554 |
| Abdominal, liver and biliary tract (%) | 5 (18.5) | 5 (12.5) | 0.5022 |
| Skin and soft tissue (%) | 4 (14.8) | 5 (12.5) | 0.7881 |
| Cardiovascular (%) | 0 (0) | 1 (2.5) | 0.4113 |
| Bone and joint (%) | 1 (3.7) | 1 (2.5) | 0.7787 |
| Unknown | 2 (7.4) | 1 (2.5) | 0.3450 |
| Comorbidities (%) | 21 (77.8) | 39 (97.5) | 0.0150 |
| Cardiovascular disease (%) | 15 (55.6) | 30 (75) | 0.0997 |
| Respiratory disease (%) | 7 (25.9) | 13 (32.5) | 0.5654 |
| Diabetes mellitus (%) | 6 (22.2) | 15 (37.5) | 0.1887 |
| Malignancy (%) | 4 (14.8) | 13 (32.5) | 0.1050 |
| Chronic kidney disease (%) | 3 (11.1) | 6 (15) | 0.6485 |
| Septic shock (%) | NA | 10 (25.0) | NA |
| ICU admission (%) | 0 (0) | 9 (22.5) | 0.0086 |
| Hospital readmission – 28 day (%) | 2 (7.4) | 3 (7.5) | 0.9879 |
| Length of stay (day) | 5 (1–68) | 8 (1–106) | 0.073 |
| In-hospital mortality (%) | 0 (0) | 3 (7.5) | 0.1484 |
| Improving SOFA score on 3–5 days (%) | 8/9 (88.9) | 15/17 (88.2) | 0.9585 |
| Leukocyte count (×109/L) | 12.5 ± 3.72 | 14.6 ± 8.62 | 0.188 |
| Neutrophil count (×109/L) | 10.0 ± 3.44 | 12.3 ± 8.17 | 0.124 |
| Lymphocyte count (×109/L) | 1.3 (0.5–5.1) | 0.9 (0.2–4.2) | 0.053 |
| Monocyte count (×109/L) | 0.7 (0.2–2.5) | 0.9 (0.0–4.0) | 0.453 |
| Platelet (×109/L) | 222 (136–701) | 187 (43–414) | 0.038 |
| CRP (mg/L) | 43 (3–295) | 118 (3–390) | 0.026 |
| Lactate (mmol/L) | 1.45 (0.8–2.9) | 2 (0.4–6.5) | 0.017 |
| Positive culture | |||
| From source of infection (%) | 11/24 (45.8) | 20/37 (54.1) | 0.5299 |
| From blood (%) | 6/21 (28.6) | 13/32 (40.6) | 0.3775 |