Fig. 1.
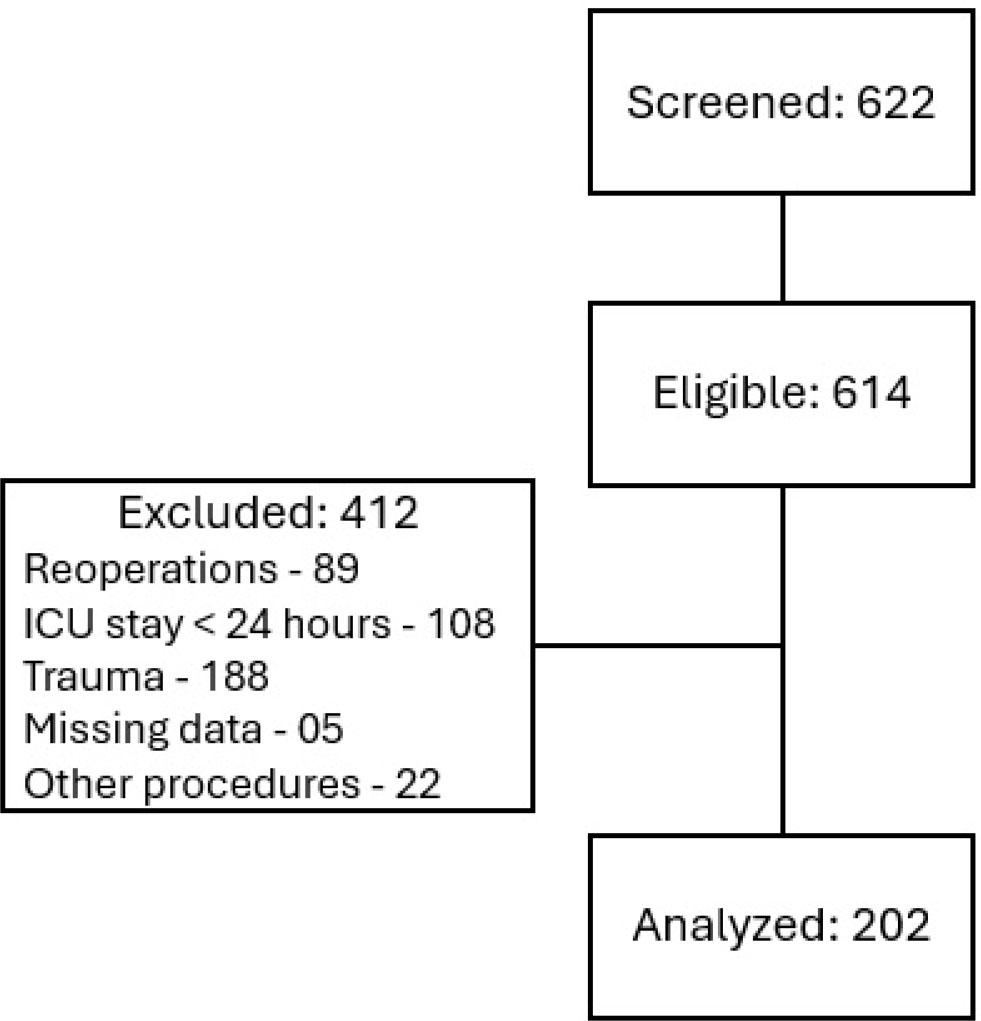
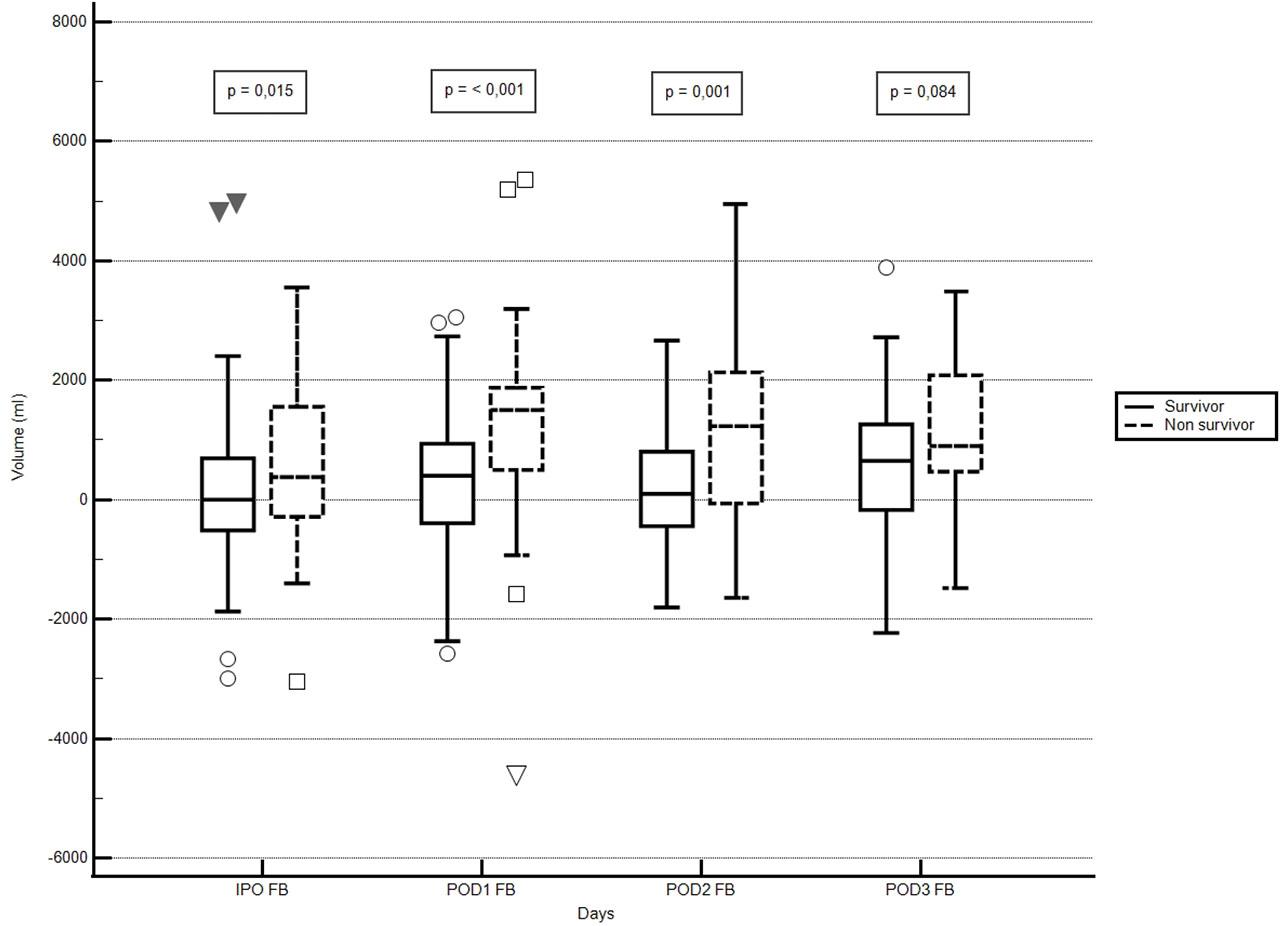
Fig. 2.
Bivariate analysis of risk factors for postoperative complications in patients admitted to the ICU
| Total | Without complications | With complications | p | |
|---|---|---|---|---|
| Postoperative feeding | ||||
| Up to 6 hours | 69 (34.2%) | 19 (27.5%) | 50 (72.5%) | 0.0001* |
| 6 to 12 hours | 41 (20.3%) | 8 (19.5%) | 33 (80.5%) | |
| 12 to 24 hours | 47 (23.3%) | 2 (4.3%) | 45 (95.7%) | |
| 24 to 48 hours | 12 (5.9%) | 1 (8.3%) | 11 (91.7%) | |
| > 48 hours | 16 (7.9%) | 0 | 16 (100.0%) | |
| Did not occur | 17 (8.4%) | 0 | 17 (100.0%) | |
| Intraoperative fluid resuscitation | ||||
| ≤ 30 mL/Kg | 134 (76.1%) | 24 (17.9%) | 110 (82.1%) | 0.3613 |
| > 30 mL/Kg | 42 (23.9%) | 5 (11.9%) | 37 (88.1%) | |
| Fluid resuscitation in the IPO | ||||
| ≤ 30 mL/Kg | 59 (92.2%) | 6 (10.2%) | 53 (89.8%) | 0.4574 |
| > 30 mL/Kg | 5 (7.8%) | 0 | 5 (100.0%) | |
| Intraoperative NV prophylaxis | ||||
| No | 77 (38.1%) | 6 (7.8%) | 71 (92.2%) | 0.0272 |
| Yes | 125 (61.9%) | 24 (19.2%) | 101 (80.8%) | |
| PO NV prophylaxis | ||||
| No | 8 (4.0%) | 1 (12.5%) | 7 (87.5%) | 0.8490 |
| Yes | 194 (96.0%) | 29 (14.9%) | 165 (85.1%) | |
Characteristics of immediate postoperative patients admitted to the ICU
| Variables | Frequency | % |
|---|---|---|
| Male sex | 126 | 62.4 |
| Presence of comorbidities | 176 | 87.1 |
| Hypertension | 120 | 59.4 |
| Diabetes mellitus | 63 | 31.2 |
| Cardiopathy | 62 | 30.7 |
| Cancer | 39 | 19.3 |
| Chronic kidney disease | 24 | 11.9 |
| Stroke | 19 | 9.4 |
| Chronic obstructive pulmonary disease | 18 | 8.9 |
| Peripheral vascular disease | 16 | 7.9 |
| Hypothyroidism | 15 | 7.4 |
| HIV/AIDS | 4 | 2.0 |
| Liver cirrhosis | 4 | 2.0 |
| Habits and addictions | ||
| Smoking | 81 | 40.1 |
| Alcohol consumption | 46 | 22.8 |
| Illicit drug use | 6 | 3.0 |
| Surgical priority | ||
| Urgent | 106 | 52.5 |
| Elective | 96 | 47.5 |
| Surgical complexity | ||
| Major | 140 | 69.3 |
| Moderate | 47 | 23.3 |
| Minor | 15 | 7.4 |
| Contamination potential | ||
| Clean | 78 | 38.6 |
| Potentially contaminated | 54 | 26.7 |
| Contaminated | 47 | 23.3 |
| Infected | 23 | 11.4 |
| Type of anesthesia | ||
| General anesthesia | 151 | 74.8 |
| Neuraxial anesthesia | 33 | 16.3 |
| Combined anesthesia | 18 | 8.9 |
| Surgical procedure | ||
| Digestive system, accessory organs, and abdominal wall surgery | 52 | 25.7 |
| Central and peripheral nervous system surgery | 41 | 20.3 |
| Genitourinary system surgery | 28 | 13.9 |
| Circulatory system surgery | 23 | 11.4 |
| Thoracic surgery | 21 | 10.4 |
| Oncologic surgery | 15 | 7.4 |
| Musculoskeletal system surgery | 10 | 5.0 |
| Other surgeries | 4 | 4.0 |
| Minor surgeries and surgeries involving skin, subcutaneous tissue, and mucosa | 2 | 1.0 |
| Endocrine gland surgery | 2 | 1.0 |
| Ocular system surgery | 2 | 1.0 |
| Oral and maxillofacial surgery | 2 | 1.0 |
Logistic regression model for the analysis of risk factors for death in patients admitted to the ICU in the immediate postoperative period
| Bivariate | Multivariate | |||||
|---|---|---|---|---|---|---|
| Variable | OR | 95% CI | p | OR | 95% CI | p |
| Complications | 27.30 | 1.63 – 454.98 | 0.0212 | |||
| Urgent surgery | 8.11 | 3.57 – 18.42 | < 0.001 | 3.43 | 1.39 – 8.49 | 0.0074 |
| SOFA in the IPO | 1.22 | 1.12 – 1.32 | < 0.001 | |||
| SAPS 3 | 1.07 | 1.05 – 1.10 | < 0.001 | 1.07 | 1.04 – 1.10 | < 0.0001 |
| Age | 1.01 | 0.99 – 1.03 | 0.1039 | |||
| Comorbidities | 0.77 | 0.31 – 1.89 | 0.5744 | |||
| Male sex | 0.72 | 0.38 – 1.36 | 0.3134 | 0.37 | 0.16 – 0.85 | 0.0204 |
Bivariate analysis of postoperative complications as a risk factor for death in patients admitted to the ICU in the immediate postoperative period
| Complications | OR | 95% CI | p |
|---|---|---|---|
| Renal (N = 58) | 14.09 | 6.68 – 29.72 | < 0.0001 |
| Coagulation system (N = 08) | 9.38 | 1.83 – 48.06 | 0.0072 |
| Cardiovascular (N = 108) | 4.80 | 2.29 – 10.04 | < 0.0001 |
| Electrolyte (25) | 4.64 | 2.16 – 9.97 | 0.0001 |
| Infectious (N = 100) | 4.01 | 2.01 – 8.03 | 0.0001 |
| Respiratory (N = 41) | 2.16 | 1.02 – 4.55 | 0.0424 |
| Neurological (N = 28) | 2.13 | 0.85 – 5.34 | 0.1033 |
| Surgical (N = 75) | 1.59 | 0.84 – 3.00 | 0.1541 |
| Gastrointestinal (N = 92) | 1.02 | 0.55 – 1.92 | 0.9268 |