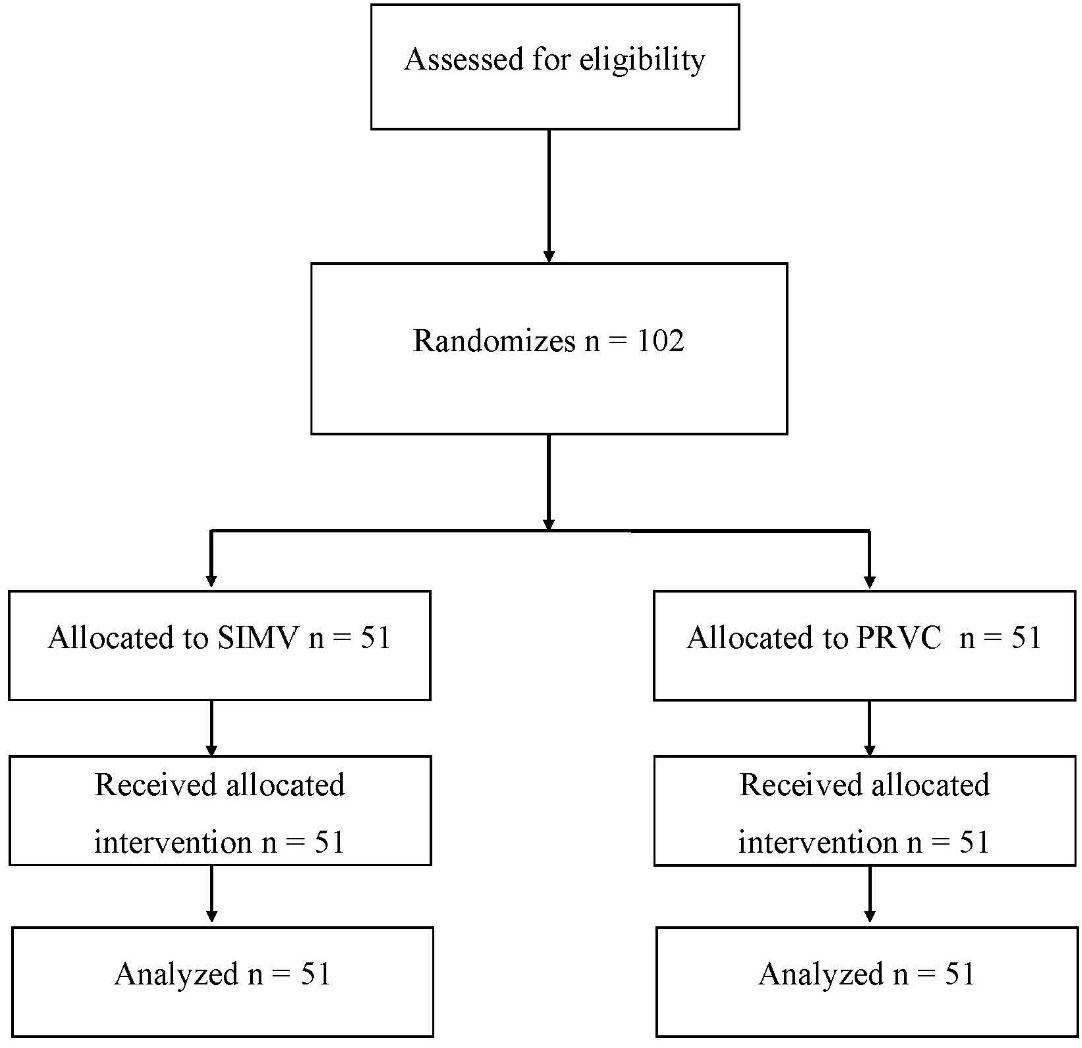
Fig. 1.
Arterial blood gases in Patients of the studied groups
| Variable /Hospitalization hours (h) | Group SIMV (51=n) | Group PRVC (51=n) | P |
|---|---|---|---|
| Arterial blood pH | |||
| 0h | 7.40±0.06 | 7.38±0.07 | 0.166 |
| 12h | 7.38±3.04 | 7.39±0.07 | 0.313 |
| PaCO2 | |||
| 0h | 38.47±6.48 | 39.91±7.28 | 0.293 |
| 12h | 40.85±16.10 | 38.45±6.14 | 0.324 |
| PaO2 | |||
| 0h | 98.35±26.81 | 97.68±26.08 | 0.898 |
| 12h | 95.22±28.43 | 100.91±25.93 | 0.229 |
| HCO3 | |||
| 0h | 24.26±3.09 | 23.72±2.89 | 0.363 |
| 12h | 25.67±12.16 | 24.99±8.55 | 0.746 |
| SpO2 | |||
| 0h | 99.10±1.28 | 98.88±2.08 | 0.529 |
| 8h | 98.86±1.72 | 98.78±1.93 | 0.829 |
| 16h | 98.29±2.59 | 98.84±2.02 | 0.236 |
Heart Rate, Systolic Blood Pressure, and Diastolic Blood Pressure in the Studied Groups
| Variable / Hospitalization hours (h) | Group SIMV (51=n) | Group PRVC (51=n) | P |
|---|---|---|---|
| Heart Rate | |||
| 0h | 86.41±14.11 | 88.88±14.80 | 0.390 |
| 8h | 87.04±14.68 | 88.47±14.49 | 0.621 |
| 12h | 88.20±13.83 | 86.67±13.46 | 0.573 |
| Systolic Blood Pressure | |||
| 0h | 121.79±15.40 | 121.57±19.54 | 0.964 |
| 8h | 121.16±15.39 | 122.14±17.47 | 0.764 |
| 12h | 124.49±15.93 | 133.86±87.91 | 0.455 |
| Diastolic Blood Pressure | |||
| 0h | 50.61±36.59 | 37.10±37.96 | 0.070 |
| 8h | 49.76±35.05 | 44.80±36.59 | 0.486 |
| 12h | 50.20±35.41 | 39.75±35.04 | 0.137 |
| Mean Arterial Pressure | |||
| 0h | 74.34±24.93 | 65.26±26.13 | 0.075 |
| 8h | 73.56±23.53 | 70.58±25.15 | 0.537 |
| 12h | 74.96±23.87 | 71.12±58.88 | 0.669 |