Fig. 1.
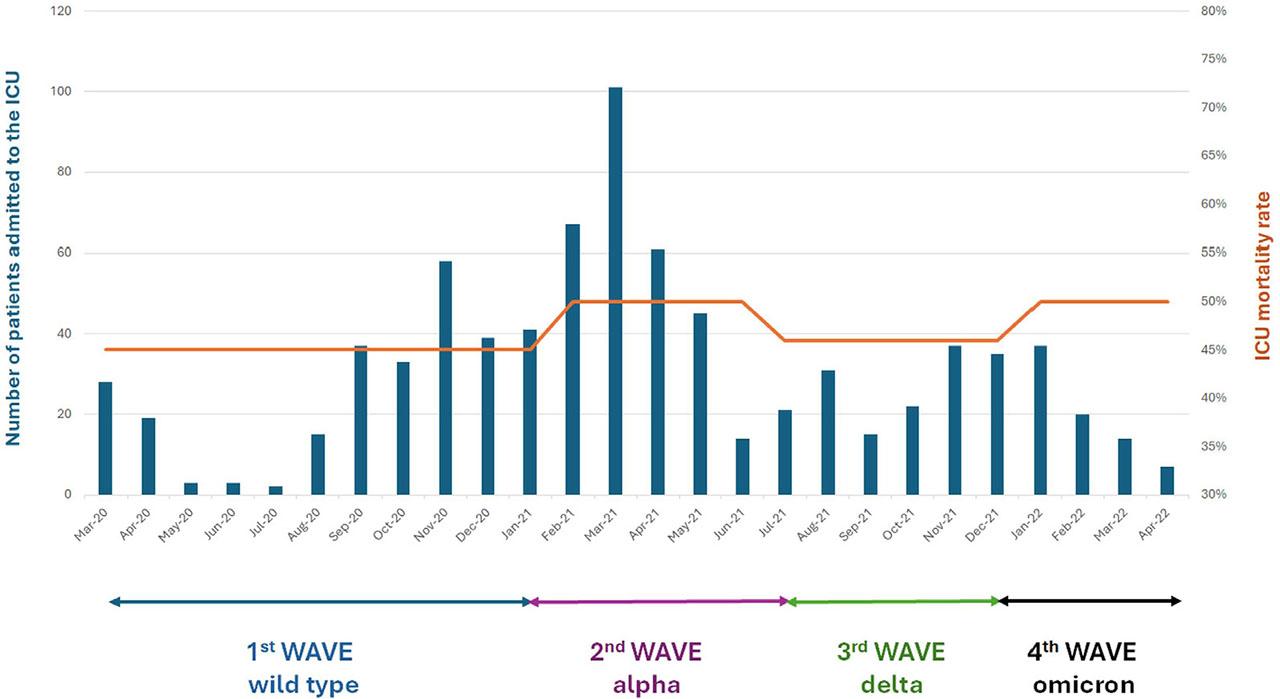
Fig. 2.
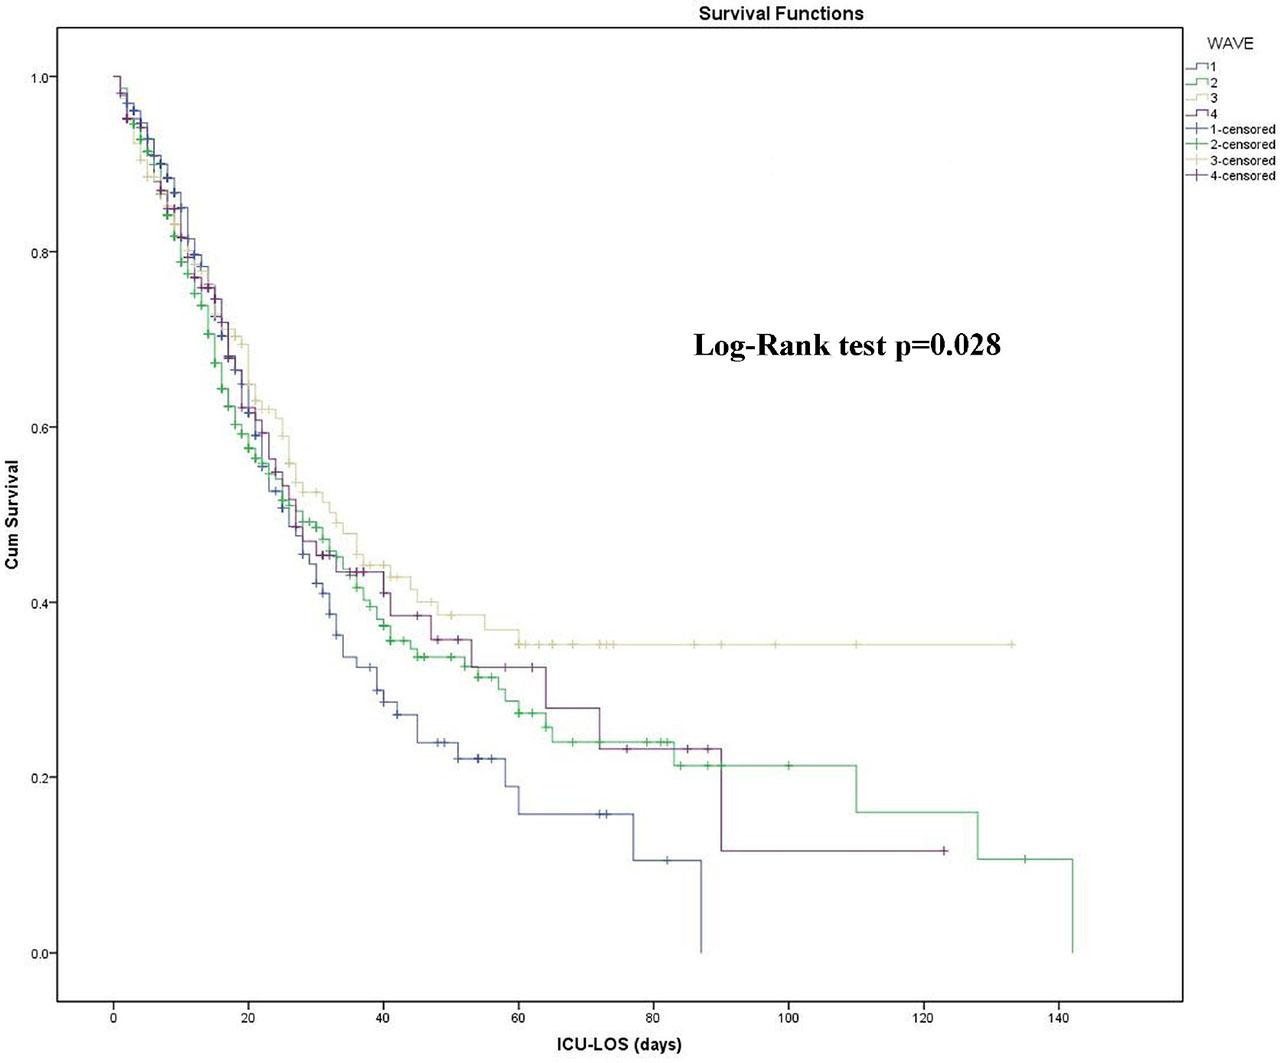
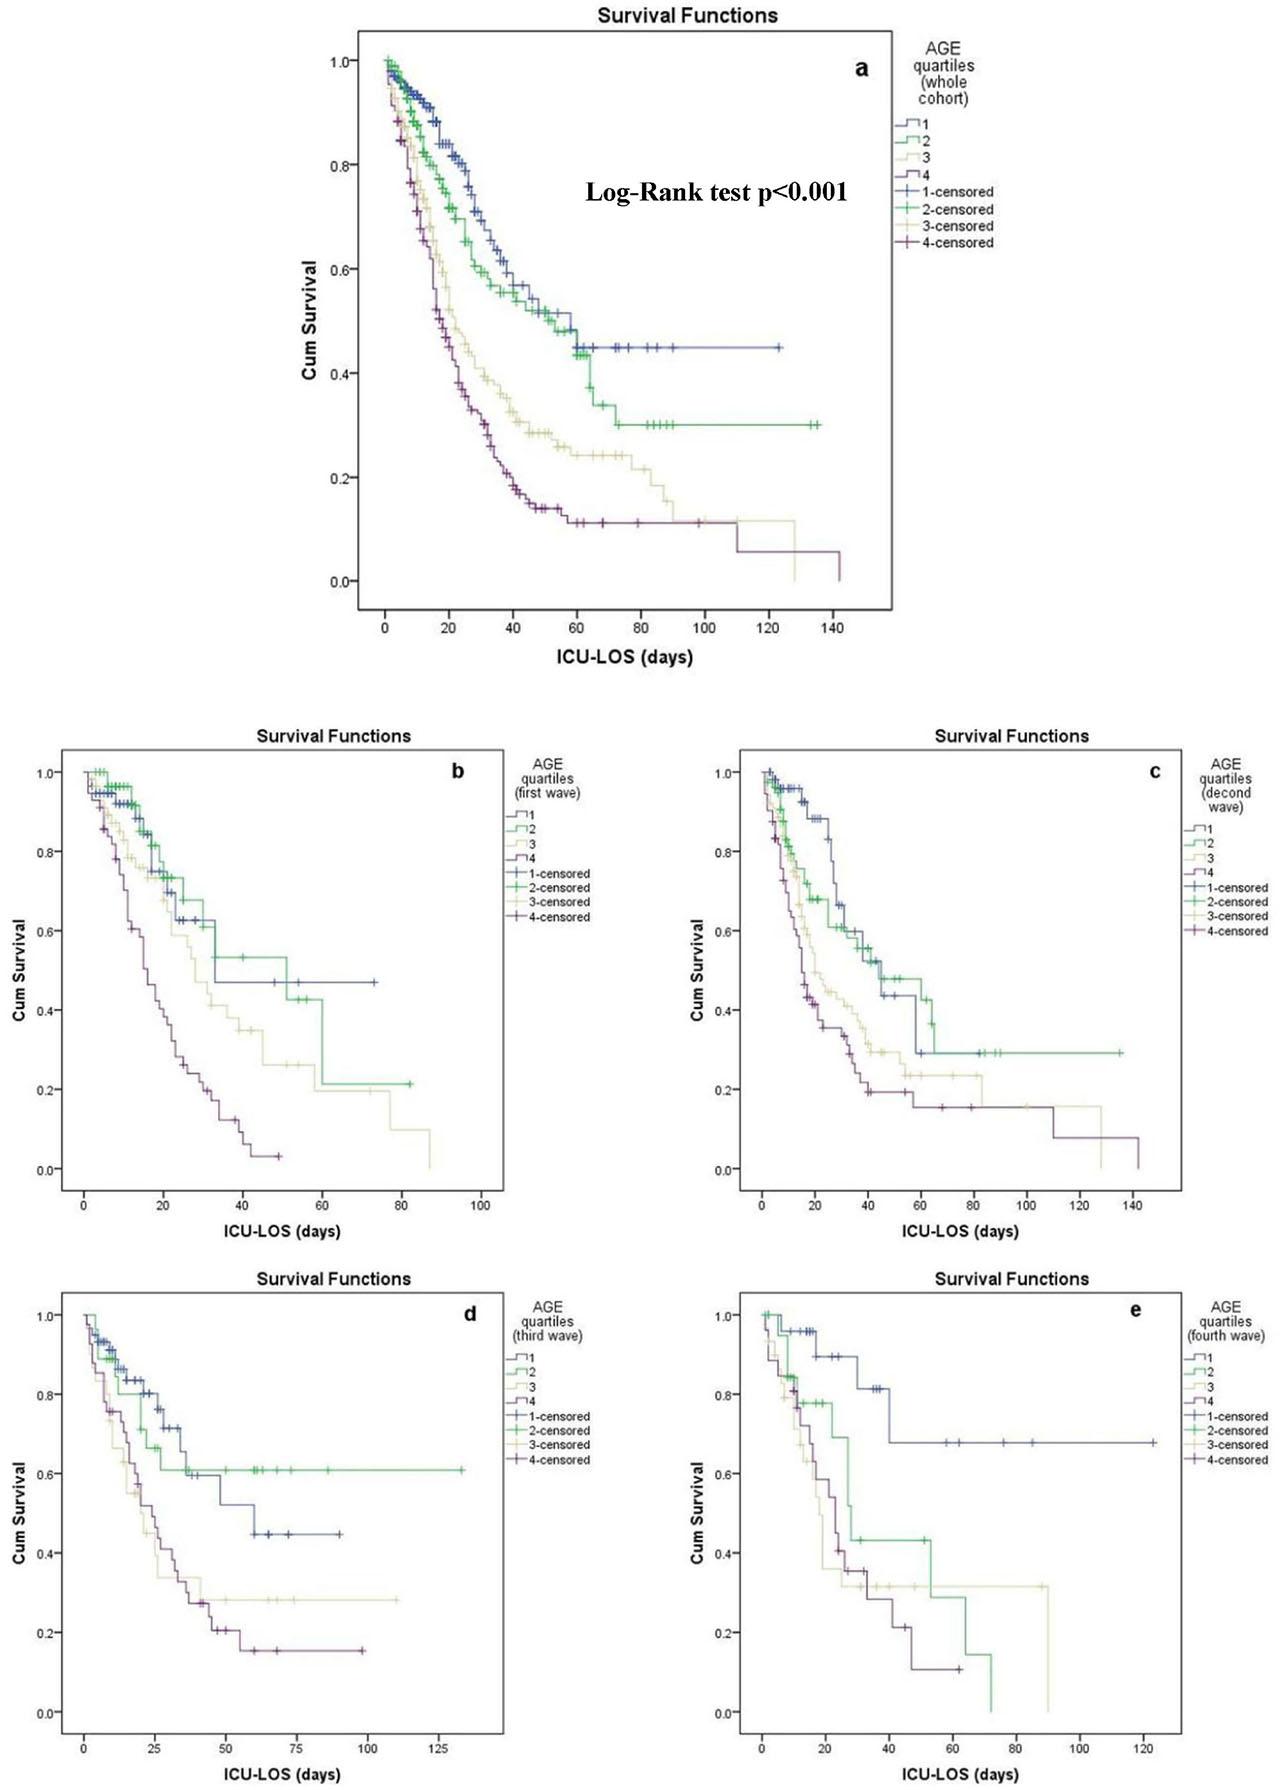
Fig. 3.
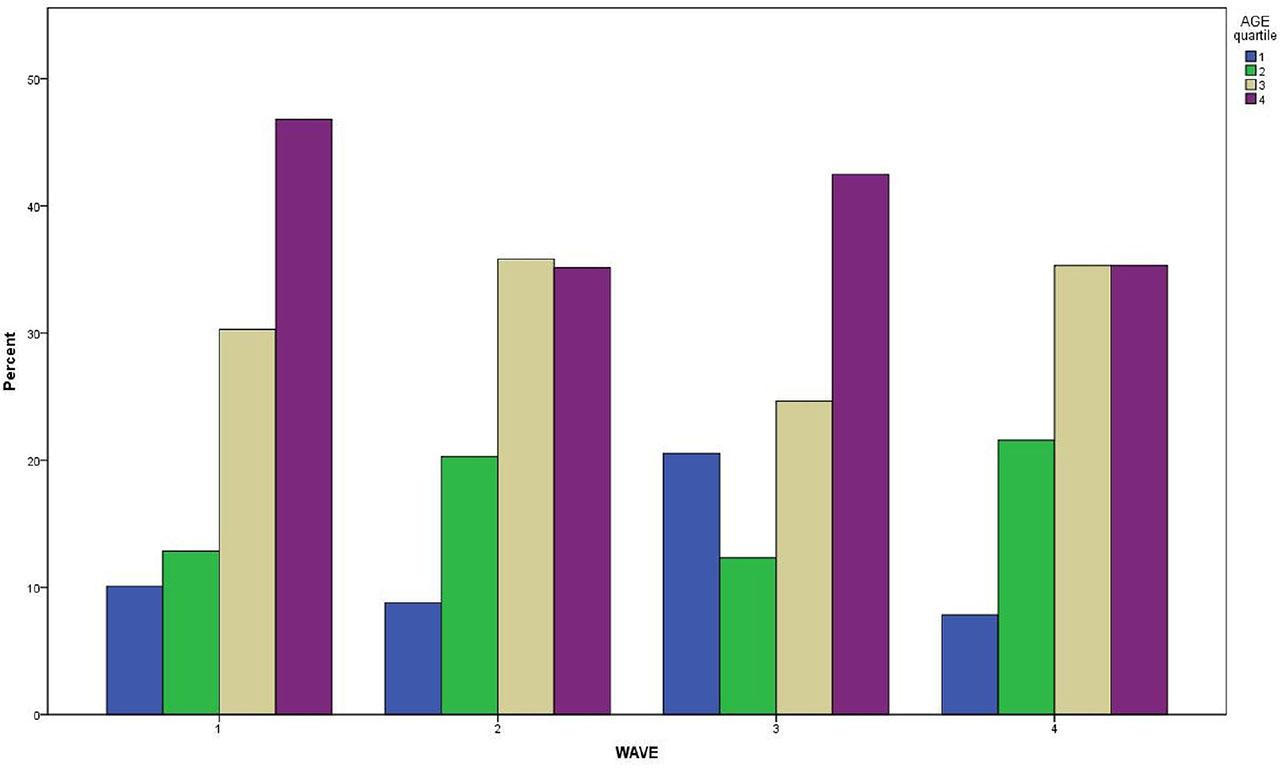
Fig. 4.
Laboratory findings and respiratory parameters on ICU admission
| Total n=805 | 1st wave n=243 | 2nd wave n=300 | 3rd wave n=158 | 4th wave n=104 | P value | ||||
|---|---|---|---|---|---|---|---|---|---|
| Laboratory tests | |||||||||
| WBC count, 109/L | 9.6 | (6.4–13.6) | 10.3 | (7.1–14.2) | 11.8 | (6.9–15.4) | 11.6 | (7.2–16.4) | 0.04 |
| Neutrophil count, 109/L | 8.2 | (5.1–12.1) | 8.7 | (6.0–12.6) | 10.1 | (5.8–13.7) | 10.1 | (6.3–14.7) | 0.04 |
| Lymphocyte count, 109/L | .80 | (.55 –1.17) | .78 | (.50–1.10) | .67 | (.49–0.94) | .76 | (.49–1.16) | 0.08 |
| NLR | 9.7 | (5.5–15.7) | 12.2 | (6.9–19.6) | 13.1 | (8.0–21.5) | 13.4 | (7.9–25) | 0.001 |
| Hemoglobin, g/dL | 12.6 | (11.4–13.7) | 12.1 | (10.3–13.7) | 12.5 | (10.9–13.7) | 12.0 | (10.3–13.4) | 0.12 |
| Platelet count, 109/L | 236 | (182–306) | 247 | (187–317) | 239 | (174–309) | 239 | (169–301) | 0.71 |
| Fibrinogen, mg/dL | 600 | (497–714 | 582 | (485–701) | 551 | (481–679) | 551 | (385–687) | 0.009 |
| D-dimers, mg/L | 1.3 | (.7–2.6) | 1.6 | (.9–4.3) | 1.5 | (.8–3.4) | 2.2 | (1.0–7.2) | 0.003 |
| Ferritin, ng/mL | 718 | (278–1710) | 628 | (318–1941) | 602 | (286–1941) | 491 | (189–1328) | 0.16 |
| Albumin, g/dL | 3.3 | (2.9–3.6) | 3.1 | (2.9–3.5) | 3.2 | (2.8–3.6) | 3.1 | (2.7–3.5) | 0.007 |
| Sodium, mEq/L | 139 | (136–142) | 140 | (137–144) | 140 | (138–144) | 141 | (138–145) | 0.001 |
| Creatinine, mg/dL | .9 | (.7–1.2) | .9 | (.7–1.3) | .8 | (.6–1.3) | .9 | (.7–1.3) | 0.80 |
| AST, IU/L | 44 | (26–70) | 37 | (26–68) | 35 | (23–62) | 35 | (21–54) | 0.08 |
| ALT, IU/L | 36 | (21–54) | 32 | (19–56) | 26 | (16–500 | 30 | (17–61) | 0.09 |
| LDH, IU/L | 438 | (333–610) | 474 | (357–643) | 458 | (348–629) | 463 | (302–591) | 0.29 |
| hs-cTnI, ng/L | 18 | (8–61) | 24 | (11–79) | 24 | (8–62) | 39 | (18–103) | 0.001 |
| Procalcitonin, ng/mL | .30 | (.12–1.17) | .24 | (.11–0.63) | .23 | (.10–0.55) | .20 | (.10–0.54) | 0.19 |
| CRP, mg/dL | 12 | (5–19) | 11 | (6–17) | 9 | (4–17) | 9 | (3–16) | 0.04 |
| Respiratory parameters | |||||||||
| pH | 7.39 | (7.30–7.45) | 7.33 | (7.26–7.40) | 7.34 | (7.26–7.41) | 7.29 | (7.24–7.36) | 0.001 |
| PaCO2, mmHg | 40 | (33–47) | 43 | (35–51) | 41 | (36–47) | 43 | (37–52) | 0.005 |
| Bicarbonate, mEq/L | 23 | (20–26) | 22 | (19–24) | 22 | (20–24) | 21 | (19–24) | 0.007 |
| Lactate, mmol/L | 1.6 | (1.2–2.1) | 1.6 | (1.3–2.2) | 1.6 | (1.2–2.3) | 1.8 | (1.4–2.5) | 0.04 |
| PaO2/FiO2 | 123 | (89–171) | 114 | (84–181) | 137 | (90–180) | 138 | (94–213) | 0.17 |
| Respiratory rate, breaths/min | 24 | (22–27) | 25 | (21–28) | 25 | (23–28) | 25 | (22–28) | 0.22 |
| Tidal volume, mL | 480 | (450–500) | 460 | (420–500) | 450 | (400–480) | 450 | (400–480) | 0.001 |
| PEEP, cm H2O | 12 | (10–15) | 12 | (10–15) | 13 | (10–15) | 13 | (10–16) | 0.22 |
| Plateau pressure, cm H2O | 26 | (24–29) | 26 | (24–28) | 26 | (23–28) | 27 | (24–28) | 0.62 |
| Driving pressure, cm H2O | 13 | (12–15) | 12 | (11–14) | 12 | (10–14) | 12 | (11–14) | 0.10 |
Demographics, comorbidities, treatments and outcomes distribution among the four pandemic waves
| Total n=805 | 1st wave n=243 | 2nd wave n=300 | 3rd wave n=158 | 4th wave n=104 | P value | ||||
|---|---|---|---|---|---|---|---|---|---|
| Demographics | |||||||||
| Sex, male | 176 | (72) | 200 | (67) | 100 | (64) | 71 | (69) | 0.28 |
| Age, years, median (IQR) | 67 | (57–76) | 68 | (59–75) | 65 | 5(0–76) | 68 | (56–76) | 0.21 |
| Severity scores | |||||||||
| Charlson index, median (IQR) | 3 | (2–5) | 3 | (2–5) | 3 | (1–5) | 3 | (2–5) | 0.08 |
| APACHE II score, median (IQR) | 13 | (9–19) | 15 | (12–19) | 14 | (11–19) | 15 | (12–18) | 0.004 |
| SOFA score, median (IQR) | 6 | (2–9) | 7 | (6–9) | 7 | (5–8) | 7 | (6–8) | 0.002 |
| Comorbidities | |||||||||
| Hypertension | 101 | (42) | 131 | (44) | 58 | (37) | 40 | (38) | 0.50 |
| Diabetes | 65 | (27) | 82 | (27) | 33 | (21) | 24 | (23) | 0.42 |
| Obesity | 29 | (12) | 34 | (11) | 26 | (16) | 15 | (14) | 0.42 |
| Cerebrovascular disease | 65 | (27) | 71 | (24) | 34 | (21) | 32 | (31) | 0.32 |
| COPD | 25 | (10) | 51 | (17) | 18 | (11) | 12 | (11) | 0.10 |
| Malignancy | 18 | (7) | 35 | (12) | 16 | (10) | 16 | (15) | 0.14 |
| Chronic kidney disease | 15 | (6) | 31 | (10) | 13 | (8) | 6 | (6) | 0.26 |
| Treatments | |||||||||
| Remdesivir | 78 | (32) | 163 | (54) | 90 | (57) | 60 | (58) | 0.001 |
| Dexamethasone | 150 | (62) | 260 | (87) | 143 | (90) | 84 | (81) | 0.001 |
| Tocilizumab | 0 | (0) | 2 | (1) | 14 | (9) | 20 | (19) | 0.001 |
| MV on admission | 131 | (54) | 249 | (83) | 116 | (73) | 92 | (88) | 0.001 |
| HFNC on admission | 75 | (31) | 41 | (14) | 38 | (24) | 4 | (4) | 0.001 |
| Outcomes | |||||||||
| ICU outcome, death | 109 | (45) | 148 | (50) | 73 | (46) | 52 | (50) | 0.64 |
| Hospital outcome, death | 108 | (47) | 154 | (61) | 73 | (50) | 54 | (63) | 0.003 |
| CRRT need | 67 | (28) | 83 | (28) | 45 | (28) | 43 | (41) | 0.04 |
| MV duration, days, median (IQR) | 9 | (0–17) | 12 | (5–26) | 13 | (4–27) | 13 | (6–25) | 0.001 |
| ICU LOS, days, median (IQR) | 13 | (7–23) | 15 | (8–31) | 19 | (9–36) | 17 | (9–31) | 0.03 |
Log Rank pairwise comparisons between the age quartiles for each pandemic wave
| Age quartiles | 1 | 2 | 3 | 4 | |||||
|---|---|---|---|---|---|---|---|---|---|
| Chi-Square | P value | Chi-Square | P value | Chi-Square | P value | Chi-Square | P value | ||
| Age quartiles | first wave | ||||||||
| 1 | 0.062 | 0.803 | 1.732 | 0.188 | 14.845 | 0.000 | |||
| 2 | 0.062 | 0.803 | 2.727 | 0.099 | 22.948 | 0.000 | |||
| 3 | 1.732 | 0.188 | 2.727 | 0.099 | 11.988 | 0.001 | |||
| 4 | 14.845 | 0.000 | 22.948 | 0.000 | 11.988 | 0.001 | |||
| second wave | |||||||||
| 1 | 0.785 | 0.376 | 7.082 | 0.008 | 15.125 | 0.000 | |||
| 2 | 0.785 | 0.376 | 4.591 | 0.032 | 12.535 | 0.000 | |||
| 3 | 7.082 | 0.008 | 4.591 | 0.032 | 2.530 | 0.112 | |||
| 4 | 15.125 | 0.000 | 12.535 | 0.000 | 2.530 | 0.112 | |||
| third wave | |||||||||
| 1 | 0.005 | 0.941 | 7.056 | 0.008 | 9.876 | 0.002 | |||
| 2 | 0.005 | 0.941 | 4.955 | 0.026 | 7.594 | 0.006 | |||
| 3 | 7.056 | 0.008 | 4.955 | 0.026 | 0.03 | 0.863 | |||
| 4 | 9.876 | 0.002 | 7.594 | 0.006 | 0.03 | 0.863 | |||
| fourth wave | |||||||||
| 1 | 7.484 | 0.006 | 10.813 | 0.001 | 12.182 | 0.000 | |||
| 2 | 7.484 | 0.006 | 0.459 | 0.498 | 1.944 | 0.163 | |||
| 3 | 10.813 | 0.001 | 0.459 | 0.498 | 0.001 | 0.969 | |||
| 4 | 12.182 | 0.000 | 1.944 | 0.163 | 0.001 | 0.969 | |||
Univariate and multivariate Cox proportional hazards models
| B | P-value | Odds Ratio | 95% CI | ||
|---|---|---|---|---|---|
| Lower | Upper | ||||
| Univariate model | |||||
| Wave 1st (reference) | |||||
| Wave 2nd | −.067 | .602 | .935 | .725 | 1.205 |
| Wave 3rd | −.287 | .062 | .750 | .555 | 1.015 |
| Wave 4th | −.135 | .430 | .874 | .625 | 1.221 |
| Multivariate model | |||||
| Sex | .070 | .588 | 1.072 | .833 | 1.381 |
| SOFA score | .145 | .000 | 1.157 | 1.106 | 1.209 |
| Wave 1st (reference) | |||||
| Wave 2nd | −.150 | .297 | .861 | .650 | 1.140 |
| Wave 3rd | −.208 | .227 | .812 | .580 | 1.138 |
| Wave 4th | −.160 | .424 | .852 | .576 | 1.261 |
| Hypertension | −.085 | .467 | .918 | .729 | 1.156 |
| Diabetes | −.153 | .248 | .858 | .662 | 1.112 |
| Obesity | .001 | .996 | 1.001 | .701 | 1.430 |
| Cardiovascular disease | .244 | .062 | 1.277 | .988 | 1.651 |
| COPD | .462 | .002 | 1.588 | 1.178 | 2.141 |
| Malignancy | .424 | .010 | 1.529 | 1.109 | 2.107 |
| Chronic kidney disease | .112 | .568 | 1.118 | .762 | 1.642 |
| Remdesivir | −.215 | .094 | .807 | .627 | 1.037 |
| Dexamethasone | .122 | .449 | 1.129 | .824 | 1.547 |
| Tocilizumab | −.734 | .052 | .480 | .229 | 1.007 |
| Age quartile 1st (reference) | |||||
| Age quartile 2nd | .113 | .596 | 1.119 | .738 | 1.698 |
| Age quartile 3rd | .608 | .002 | 1.838 | 1.239 | 2.724 |
| Age quartile 4th | .849 | .000 | 2.337 | 1.580 | 3.455 |