Fig. 1.
Comparison of Sepsis Etiology, Sources, and Origins by Age Group
| Etiology of sepsis | 65–79 Years old, N (%) | 80 Years and older N (%) | p Value |
|---|---|---|---|
| Bacterial infection | |||
| Gram-positive | 92 (56.8) | 46 (51.7) | 0.437 |
| Gram-negative | 67 (41.4) | 43 (48.3) | 0.288 |
| Fungal infection | 34 (21.0) | 31 (34.8) | 0.017 |
| Viral infection | 1 (0.6) | 0 (0) | 0.458 |
| Source of sepsis | |||
| Pulmonary | 89 (54.9) | 53 (59.6) | 0.481 |
| Urinary | 21 (13.0) | 19 (21.3) | 0.083 |
| Intra-abdominal | 47 (29.0) | 20 (22.5) | 0.262 |
| Bloodstream | 10 (6.2) | 8 (9.0) | 0.408 |
| Soft tissue | 7 (4.3) | 4 (4.5) | 0.949 |
| Central nervous system | 6 (3.7) | 0 (0) | 0.066 |
| Origin of sepsis | 0.329 | ||
| Community | 59 (36.4) | 38 (42.7) | |
| Hospital | 103 (63.6) | 51 (57.3) | |
Factors Predicting Mortality in Very Elderly Patients with Sepsis
| Factor | Univariate OR (95% CI) | P * | Multivariate OR (95% CI | P * |
|---|---|---|---|---|
| Severity of disease | ||||
| SOFA | 1.22 (1.05, 1.42) | 0.006 | 1.24 (1.04–1.49) | 0.017 |
| APACHE | 1.10 (1.04, 1.18) | <0.001 | ||
| Laboratory | ||||
| PCO2, mmHg | 1.03 (1.01, 1.06) | 0.021 | ||
| Comorbidity | ||||
| Malignancy | 2.14 (1.15, 3.99) | 0.016 | 1.63 (1.02–2.46) | 0.026 |
| Organ support | ||||
| IMV | 2.14 (1.41, 3.25) | <0.001 | ||
| Vasopressor/Inotrope | 1.66 (1.20, 2.30) | 0.002 | ||
| Etiology of sepsis | ||||
| Fungal infection | 1.59 (1.03, 2.44) | 0.034 | 1.45 (1.01–2.08) | 0.045 |
| Origin of sepsis | ||||
| Hospital acquired | 2.01 (1.34, 3.00) | <0.001 | 1.88 (1.11–3.20) | 0.022 |
| Events | ||||
| Acute kidney injury | 2.28 (1.30, 4.00) | 0.003 | 2.12 (1.18–3.79) | 0.007 |
Factors Predicting Mortality in Elderly Patients with Sepsis
| Factor | Univariate OR (95% CI) | P * | Multivariate OR (95% CI | P * |
|---|---|---|---|---|
| Severity of disease | ||||
| SOFA | 1.23 (1.17,1.42) | <0.001 | 1.26 (1.07, 1.48) | 0.005 |
| APACHE | 1.11 (1.06,1.15) | <0.001 | ||
| Laboratory | ||||
| Lactate, mmol/L | 1.28 (1.04, 1.59) | 0.022 | ||
| Comorbidity | ||||
| Malignancy | 1.46 (1.11, 1.92) | 0.007 | 1.38 (1.04, 2.10) | 0.039 |
| Organ support | ||||
| IMV | 2.26 (1.59, 3.20) | <0.001 | ||
| Vasopressor/Inotrope | 1.82 (1.31, 2.50) | <0.001 | ||
| Etiology of sepsis | ||||
| Fungal infection | 1.67 (1.12, 2.47) | 0.011 | 1.53 (1.01, 2.33) | 0.046 |
| Origin of sepsis | ||||
| Hospital acquired | 2.12 (1.51, 2.97) | <0.001 | 1.74 (1.02, 3.08) | 0.019 |
| Events | ||||
| Acute kidney injury | 2.39 (1.72, 3.31) | <0.001 | 2.18 (1.29, 3.72) | 0.003 |
Comparison of Clinical, Laboratory, and Outcome Parameters in Elderly (65–79 Years) and Very Elderly (80+ Years) Septic Patients
| Parameters | 65–79 Years, N=162 | 80+ Years, N=89 | P value |
|---|---|---|---|
| Gender, N (%) | |||
| Male | 99 (61.1) | 49 (55.1) | 0.351 |
| Female | 63 (38.9) | 40 (44.9) | |
| Comorbidities, N (%) | |||
| Diabetes Mellitus | 63 (38.9) | 27 (30.3) | 0.177 |
| Hypertension | 66 (40.7) | 28 (31.5) | 0.146 |
| Chronic kidney disease | 23 (14.2) | 22 (24.7) | 0.057 |
| End stage kidney disease | 7 (4.3) | 2 (2.2) | 0.498 |
| Chronic pulmonary disease | 20 (12.3) | 15 (16.9) | 0.426 |
| Congestive heart failure | 27 (16.7) | 22 (24.7) | 0.17 |
| Coronary artery disease | 47 (29.0) | 28 (31.5) | 0.685 |
| Cerebrovascular disease | 11 (6.8) | 16 (18.0) | 0.012 |
| İmmobility | 4 (2.5) | 10 (11.2) | 0.007 |
| Dementia | 11 (6.8) | 23 (25.8) | <0.001 |
| Liver disease | 10 (6.2) | 6 (6.7) | 0.893 |
| Rheumatic disease | 8 (4.9) | 1 (1.1) | 0.165 |
| Malignancy | 99 (61.1) | 24 (27.0) | < 0.001 |
| Chalrlson Comorbidity Index, mean (SD) | 4.10 (2.30) | 3.2 (2.10) | <0.001 |
| Laboratory, median (IQR) | |||
| CRP, mg/L | 141.53 (87.02–209.54) | 125.00 (83.52–195.54) | 0.179 |
| Procalcitonin, ng/mL | 2.94 (0.62–16.03) | 2.40 (0.52–8.01) | 0.180 |
| WBC, 1000/µL | 12.33 (7.60–17.71) | 13.02 (10.04–18.01) | 0.280 |
| Hb, g/Ll | 9.42 (8.43–10.90) | 10.03 (9.04–11.02) | 0.009 |
| PLT, 1000/µL | 149.13 (70.53–246.54) | 200.34 (110.21–293.40) | 0.011 |
| Crea, mg/dL | 1.81 (0.94–2.91) | 1.63 (1.12–2.92) | 0.599 |
| PH | 7.38 (7.30–7.44) | 7.39 (7.28–7.45) | 0.487 |
| PCO2, mmHg | 40.03 (34.02–49.31) | 40.04 (34.03–54.01) | 0.585 |
| Lactate, mmol/L | 2.11 (1.42–3.30) | 2.04 (1.51–3.11) | 0.859 |
| Organ Support, N (%) | |||
| IMV | 72 (44.4) | 55 (61.0) | 0.009 |
| Vasopressor/Inotrope | 127 (78.4) | 76 (85.4) | 0.238 |
| HD | 46 (28.4) | 20 (22.5) | 0.308 |
| Severity of disease, mean (SD) point | |||
| SOFA | 10.50 (3.90) | 9.80 (3.20) | 0.149 |
| APACHE II | 25.80 (8.10) | 25.20 (7.60) | 0.863 |
| Outcomes | |||
| IMV LOS, median (IQR) day | 2.00 (0.00–7.00) | 4.00 (1.00–9.00) | 0.090 |
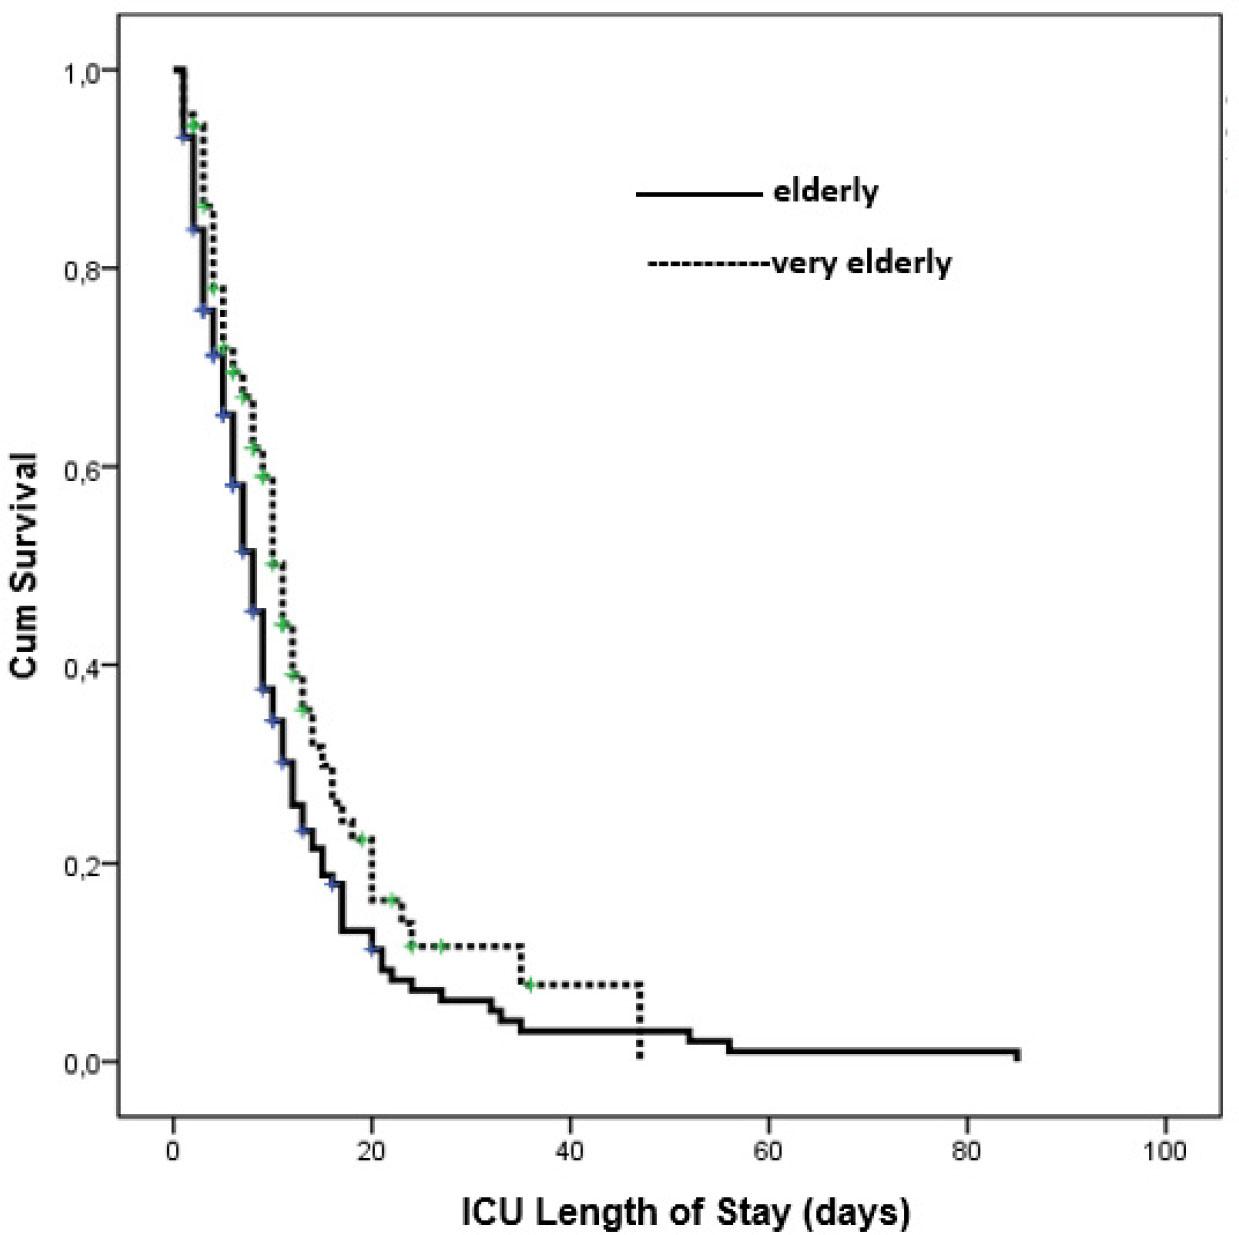
| ICU LOS, median (IQR) day | 6.00 (3.00–11.00 | 8.00 (4.00–13.00) | 0.027 |
| ICU mortality, N (%) | 133 (82.1) | 63 (70.8) | 0.056 |