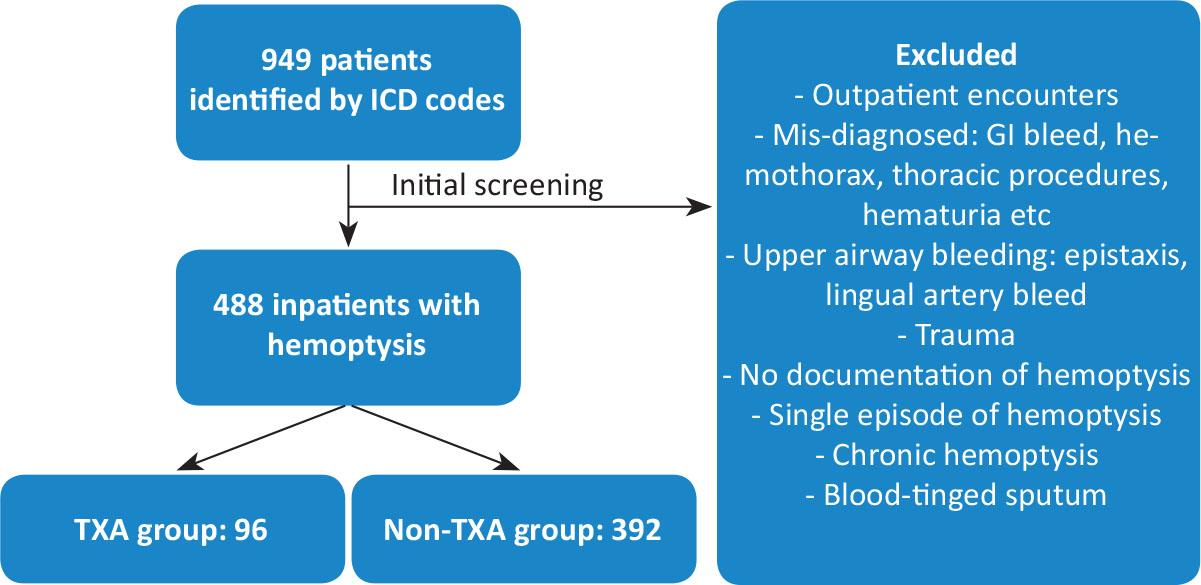
Fig. 1.
Outcomes of all patients
| Outcomes | All patients (N = 488) | TXA (N = 96) | No TXA (N = 392) | p-value |
|---|---|---|---|---|
| ICU admission | [N=224] 50% | [N=72] 75% | [N=151] 38.5% | <0.01 |
| Average ICU LOS | 10.5 (16.5) | 16.9 (17.6) | 7.3(14.9) | <0.01 |
| Mechanical ventilation | 155 (31.8%) | 64 (66.7%) | 91 (23.2%) | <0.01 |
| Bronchoscopy | 245 (50.2%) | 76 (79.2%) | 169 (43.1%) | <0.01 |
| IR | 29 (5.9%) | 8 (8.3%) | 21 (5.4%) | 0.27 |
| Average Hospital LOS | 12.8 (17.1) | 24.4 (27.8) | 10 (11.6) | <0.01 |
| Expired/Hospice | 194 (39.8%) | 56 (59%) | 138 (35.2%) | <0.01 |
| Diagnosis | ||||
| Alveolar bleeding | 82 (16.8%) | 29 (30.2%) | 53 (13.5%) | <0.01 |
| Infection | 161 (33%) | 26 (27.1%) | 135 (34.4%) | 0.17 |
| Pulmonary edema | 33 (6.8%) | 3 (3.1%) | 30 (7.6%) | 0.11 |
| Malignancy | 73 (15%) | 11 (11.5%) | 62 (15.8%) | 0.28 |
| Coagulopathy | 15 (3.1%) | 4 (4.2%) | 11 (2.8%) | 0.51 |
| Tracheal/bronchial bleeding | 91 (18.7%) | 16 (16.7%) | 75 (19.1%) | 0.58 |
| Vascular abnormality | 21 (4.3%) | 3 (3.1%) | 18 (4.6%) | 0.78 |
| Undetermined | 12 (2.5%) | 4 (4.2%) | 8 (2.1%) | 0.26 |
Demographic information of all patients
| Demographic information | All patients (N = 488) | TXA (N = 96) | No TXA (N = 392) | p-value |
|---|---|---|---|---|
| Gender: | ||||
| Female | 177 (36.3%) | 41 (42.7%) | 136 (34.7%) | 0.14 |
| Male | 311 (63.7%) | 55 (57.3%) | 256 (65.3%) | |
| Mean Age (SD) | 56.8 (16.7) | 58.0 (15.5) | 56.6 (17.0) | 0.44 |
| Smokers | 110 (22.5%) | 14 (14.6%) | 96 (24.5%) | 0.04 |
| AC/AP use | 313 (64.1%) | 75 (78.1%) | 238 (60.7%) | <0.01 |
| INR >= 1.5 | 108 (22.1%) | 23 (24%) | 85 (21.7%) | 0.63 |
| Median Platelet count (q1-q3) | 196 (84–277) | 197 (84–282) | 192.5 (78–258.5) | 0.36 |
| Underlying condition | ||||
| Liver disease | 42 (8.6%) | 6 (6.3%) | 36 (9.2%) | 0.19 |
| Bronchiectasis | 45 (9.2%) | 7 (7.3%) | 38 (9.7%) | |
| Lung cancer/metastasis | 58 (11.9%) | 9 (9.4%) | 49 (12.5%) | |
| Head/Neck cancer | 16 (3.3%) | 7 (7.3%) | 9 (2.3%) | |
| Hematological cancer | 30 (6.2%) | 7 (7.3%) | 23 (5.9%) | |
| Other cancer | 31 (6.3%) | 8 (8.3%) | 23 (5.9%) | |
| None of the above | 266 (54.5%) | 52 (54.2%) | 214 (54.6%) | |
Demographic information of all ICU patients
| Demographic information | ALL ICU (N = 223) | ICU + TXA (N = 72) | ICU + No TXA (N = 151) | p-value |
|---|---|---|---|---|
| Gender: | ||||
| Female | 84 (37.7%) | 31 (43.1%) | 53 (35.1%) | 0.25 |
| Male | 139 (62.3%) | 41 (56.9%) | 98 (64.9%) | |
| Average Age | 58.4 (16.3) | 58.1 (16.1) | 58.6 (16.4) | 0.85 |
| Smokers | 46 (20.6%) | 12 (16.7%) | 34 (22.5%) | 0.31 |
| AC/AP use | 169 (75.8%) | 59 (81.9%) | 110 (72.9%) | 0.14 |
| INR >= 1.5 | 55 (24.7%) | 17 (23.6%) | 38 (25.2%) | 0.80 |
| Median Platelet count (q1-q3) | 178.5 (84–262) | 165.5 (78–246) | 181 (85–268) | 0.64 |
| Underlying condition | ||||
| Liver disease | 26 (11.7%) | 5 (6.9%) | 21 (13.9%) | 0.64 |
| Bronchiectasis | 8 (3.6%) | 3 (4.2%) | 5 (3.3%) | |
| Lung cancer/metastasis | 22 (9.9%) | 5 (6.9%) | 17 (11.3%) | |
| Head/Neck cancer | 10 (4.5%) | 4 (5.6%) | 6 (4%) | |
| Hematological cancer | 11 (4.9%) | 3 (4.2%) | 8 (5.3%) | |
| Other cancer | 18 (8.1%) | 6 (8.3%) | 12 (8%) | |
| None of the above | 128 (57.4%) | 46 (63.9%) | 82 (54.3%) | |
Propensity score analysis for death
| Variable | Odds Ratio | Confidence Intervals | p-value |
|---|---|---|---|
| TXA Use: | |||
| Yes | 2.51 | 1.56–4.02 | <0.01 |
| No | Reference | ||
Outcomes of ICU patients
| Outcomes | ALL ICU (N = 223) | ICU + TXA (N = 72) | ICU + No TXA (N = 151) | p-value |
|---|---|---|---|---|
| Median APACHE II scores | 17.6 (8.5) | 18.7 (9.1) | 17.1 (8.1) | 0.17 |
| MV | 147 (65.9%) | 59 (81.9%) | 88 (58.3%) | <0.01 |
| Bronchoscopy | 155 (69.5%) | 61 (84.7%) | 94 (62.3%) | <0.01 |
| IR | 17 (7.6%) | 6 (8.3%) | 11 (7.3%) | 0.78 |
| Average ICU LOS | 10.3 (16.4) | 16.6 (17.5) | 7.3 (15) | <0.01 |
| Average Hospital LOS | 16.5 (18.3) | 23.7 (19.9) | 13.1 (16.5) | <0.01 |
| Expired/Hospice | 113 (50.9%) | 44 (62%) | 69 (45.7%) | 0.02 |
| Diagnosis | ||||
| Alveolar bleeding | 60 (26.9%) | 25 (34.7%) | 35 (23.2%) | 0.07 |
| Infection | 68 (30.5%) | 20 (27.8%) | 48 (31.8%) | 0.54 |
| Pulmonary edema | 12 (5.4%) | 1 (1.4%) | 11 (7.3%) | 0.11 |
| Malignancy | 25 (11.2%) | 6 (8.3%) | 19 (12.6%) | 0.50 |
| Coagulopathy | 8 (3.6%) | 1 (1.4%) | 7 (4.6%) | 0.44 |
| Tracheal/bronchial bleeding | 33 (14.8%) | 14 (19.4%) | 19 (12.6%) | 0.18 |
| Vascular abnormality | 10 (4.5%) | 2 (2.8%) | 8 (5.3%) | 0.51 |
| Undetermined | 7 (3.1%) | 3 (4.2%) | 4 (2.6%) | 0.68 |
TXA sources
| Code | Source |
|---|---|
| 81284-0611-10 | PROVEPHARM INC GWSA |
| 67457-0197-10 | MYLAN INSTITUTIONAL LLC |
| 39822-1000-01 | XGEN PHARM DJB INC |
| 55150-0188-10 | EUGIA US LLC |
| 83634-0401-10 | AVENACY INC GWSA |
| 72485-0510-10 | ARMAS PHARMACEUTICALS INC |
| 00013-1114-21 | PFIZER USPG |
| 60505-6169-01 | APOTEX CORPORATION |
| 67850-0041-10 | AVET PHARMACEUTICALS INC |
| 61990-0611-02 | PROVEPHARM INC GWSA |
| 00517-0960-10 | AMERICAN REGENT INC |
| 47781-0601-91 | ALMAJECT INC |
| 72611-0760-10 | ALMAJECT INC |
| 70860-0400-10 | ATHENEX PHARMACEUTICAL DIVISION |
| 70860-0407-10 | ATHENEX PHARMACEUTICAL DIVISION |