Fig. 1.
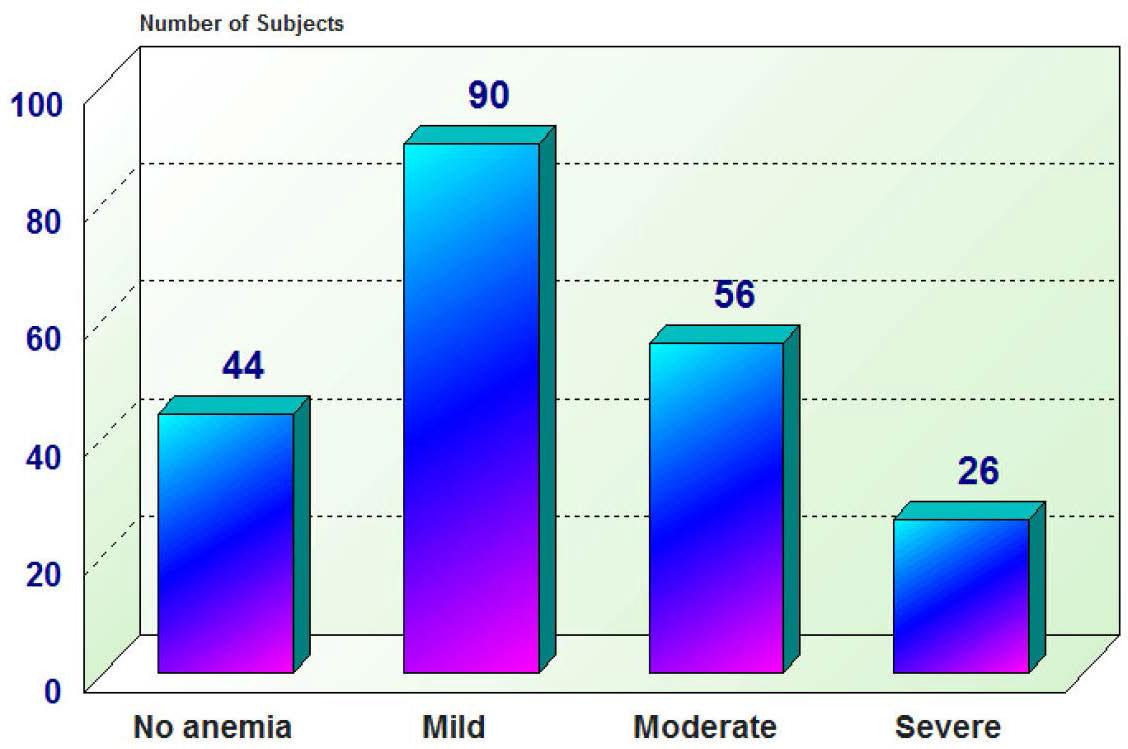
Fig. 2.
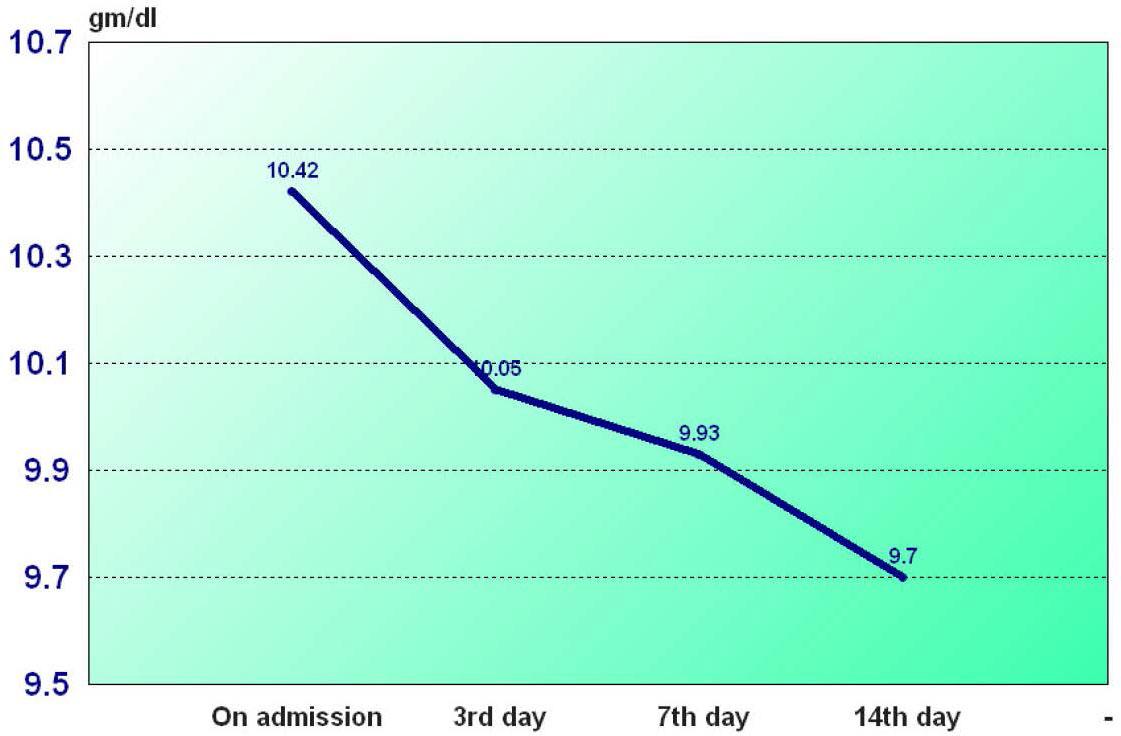
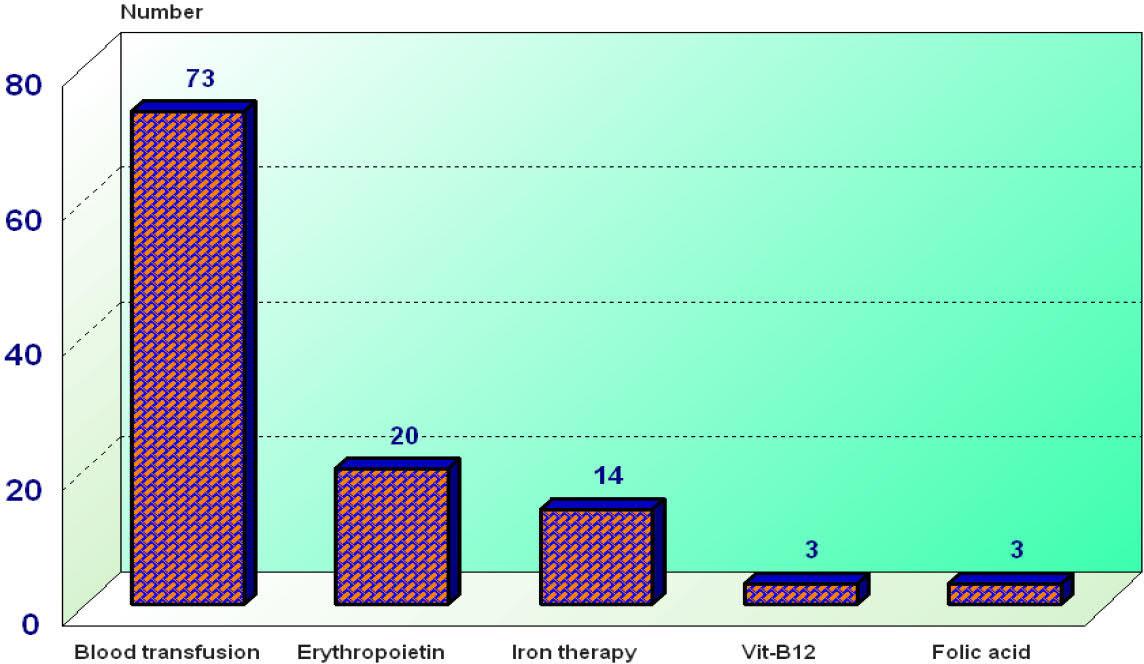
Fig. 3.
Comparison between anemic and non-anemic groups as regard hemodynamic support, mechanical ventilation and outcomes
| Anemic (n=172) (Mean±SD) (±SEM) | Non anemic (n=44) (Mean±SD) (±SEM) | Student’s “t”/Z | P(sign.) | |
|---|---|---|---|---|
| Outcomes: | ||||
| Length of stay (LOS)(Days) | 8.42±0.46 | 7.68±0.97 | “t”= 0.71 | 0.04 <0.05(S) |
Description of outcomes among studied patients
| Outcomes | All patients (n=216) | % |
|---|---|---|
| In hospital mortality (30 day mortality) | 94 | 43.5 |
Linear regression analysis for factors affecting of mortality in ICU
| Unstandardized B | Coefficients Std. Error | Standardized Coefficients Beta | t | P-value (Sign.) | |
|---|---|---|---|---|---|
| Age | 0.006 | 0.004 | 0.088 | 1.51 | 0.13(NS) |
| Smoking | 0.113 | 0.044 | 0.146 | 2.53 | 0.012(S) |
| Previous ICU admission | −0.006 | 0.069 | −0.005 | −0.08 | 0.93(NS) |
| Anemia(past history) | −0.144 | 0.085 | −0.10 | −1.68 | 0.09(NS) |
| Anemia on admission | 0.137 | 0.092 | 0.111 | 1.48 | 0.14(NS) |
| Grades of anemia | −0.6 | 0.04 | −0.124 | −1.45 | 0.14(NS) |
| Hospital acquired anemia | 0.100 | 0.117 | 0.064 | 0.85 | 0.39(NS) |
| Mechanical ventilation | 0.33 | 0.092 | 0.24 | 3.62 | 0.00(HS) |
| Vasopressor | 0.175 | 0.09 | 0.14 | 1.94 | 0.05(S) |
| Blood transfusion | 0.184 | 0.07 | 0.17 | 2.48 | 0.01(S) |
| CRP | 0.001 | 0.00 | 0.12 | 2.19 | 0.02(S) |
| Platelets | 0.00 | 0.00 | 0.143 | −2.88 | 0.00(HS) |
| MPM72 hours | 0.01 | 0.005 | 0.44 | 2.07 | 0.04(S) |
Demographics, premorbid comorbidities and Charsoln comorbidity index among studied subjects (n=216)
| Quantitative: | Mean±SD | Range |
|---|---|---|
| Age(yrs) | 75.00±7.84 | 60–98 |
Comparison between anemic and non-anemic groups as regard age, sex, severity of illness and predictors of mortality tools
| Anemic (n=172) (Mean+SD) (+SEM) | Non anemic (n=44) (Mean+SD) (+SEM) | Student’s “t”/Z | P (Sign.) | |
|---|---|---|---|---|
| Age (yrs) | 74.99+7.78 | 75.05+8.15 | “t”= 0.04 | (0.97) >0.05(NS) |
Comparison between anemic and non-anemic as regard Comorbidity data and Charlson Comorbidity index
| Comorbidities | Anemic (n=172) No (%) | Non-anemic (n=44) No(%) | X2 | P(Sign) |
|---|---|---|---|---|
| Neurological diseases1 | 49(83.1%) | 10(16.9%) | 4.23 | (0.44)>0.05(NS) |
| Hypertension | 101(61.5%) | 21(17.2%) | 1.72 | (0.18)>0.05(NS) |
| Pulmonary diseases1 | 28(90.3%) | 3(9.7%) | 2.55 | (0.11)>0.05(NS) |
| COVID 19 infection | 10(76.9%) | 3(23.1%) | 0.06 | (0.8)>0.05(NS) |
| Diabetes Mellitus | 67 (81.7%) | 15(18.3%) | 0.35 | (0.55)>0.05(NS) |
| Cardiac disease3 | 69 (82.1%) | 15 (17.9%) | 0.53 | (0.46)>0.05(NS) |
| Renal disease4 | 35 (92.1%) | 3 (7.9%) | 4.42 | (0.03)<0.05(S) |
| Hepatic diseases5 | 23(88.5%) | 3(11.5%) | 1.42 | (0.23)>0.05(NS) |
| Premorbid Anemia | 30(96.8%) | 1(3.2%) | 6.55 | (0.01)<0.05(S) |
| Dementia | 56 (76.7%) | 17 (23.3%) | 0.57 | (0.44)>0.05(NS) |
| Malignancy | 29(90.6%) | 3(9.4%) | 2.80 | (0.09) >0.05(NS) |
| Previous ICU admission | 47(94%) | 3(6%) | 8.28 | (0.004)<0.05(S) |
| Charlson Comorbidity Index | ||||
| <7 | 105(75%) | 35(25%) | 5.25 | (0.02)<0.05(S) |
| >7 | 67(88.2%) | 9(11.8%) | ||