
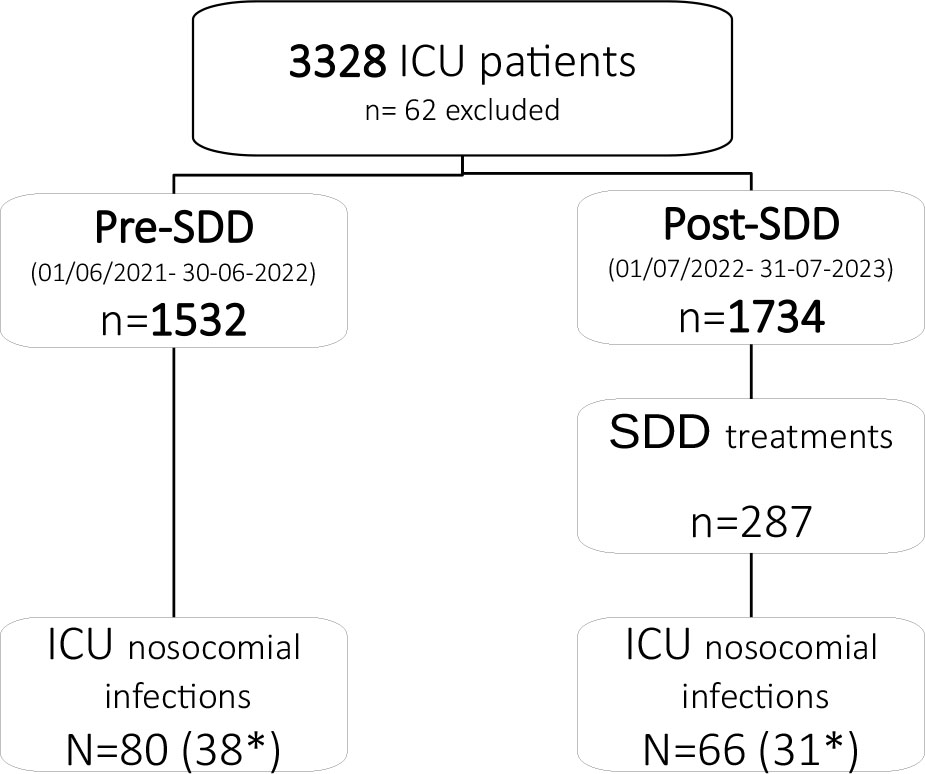
Fig. 1.
Study flowchart. SDD: Selective digestive decontamination. ICU: Intensive care unit. * ICU nosocomial infection ENVIN type
Table 1.
Baseline clinical characteristics of patients.
| Pre SDD (n=1532) | Post SDD (n=1734) | p | |
|---|---|---|---|
| Sex (M/F) (%) | 67.4/32.6 | 65.3/34.7 | 0.38 |
| Age (years); (Mean ± SD) | 61.5 ± 16.1 | 63.1 ± 15.5 | 0.135 |
| Diabetes (%) | 25.8 | 25.4 | 0.49 |
| Chronic kidney failure (%) | 11.4 | 11.3 | 0.5 |
| Chronic obstructive pulmonary disease (%) | 11.8 | 11.5 | 0.48 |
| Cirrhosis (%) | 3.5 | 3.9 | 0.41 |
| Inmunocompromised (%) | 8.7 | 8.9 | 0.46 |
| APACHE II; (Mean ± SD) | 14.7 ± 9.4 | 15.7 ± 9.8 | 0.44 |
| SOFA admission; (Mean ± SD) | 6.7 ± 3.2 | 6.3 ± 4.1 | 0.81 |
| Admission Diagnosis (%) | |||
| Cardiological | 41.3 | 40.5 | |
| Medical | 38.9 | 41.5 | 0.75 |
| Surgical | 16.1 | 14.3 | |
| Trauma | 3.7 | 3.7 | |
| Septic Shock (%) | 5.2 | 6.1 | 0.08 |
| Use of vasoactive medication (%) | 42.1 | 43.7 | 0.35 |
| Non-invasive MV (%) | 8.3 | 8.7 | 0.40 |
| Invasive MV (%) | 20.4 | 19.5 | 0.30 |
| Enteral or parenteral nutritional support (%) | 25.2 | 23.4 | 0.42 |
| Renal replacement therapies (%) | 4.1 | 4.6 | 0.33 |
| Communitary infection (%) | 18.5 | 24.6 | 0.021* |
| Nosocomial ICU infection (%) | 4.5 | 3.8 | 0.16 |
| Nosocomial out of ICU infection (%) | 6.1 | 6.0 | 0.95 |
| Nosocomial infection from another hospital (%) | 1.4 | 1.2 | 0.50 |
| Length of MV (median, IQR) | 4.1 (2 – 8) | 4.5 (2 – 9) | 0.45 |
| Length of ICU stay (median, IQR) | 4.5 ± 7.6 | 4.1 ± 6.3 | 0.28 |
| Mortality rate (%) | 10.4 | 12.6 | 0.08 |
Table 2.
ENVIN type infections
| Infections | Pre-SDD (n=1532) | Post-SDD (n=1734) |
|---|---|---|
| Nosocomial infection ENVIN type (n) | 38 | 31 |
| Ventilator-associated pneumonia (VAP) | 6 | 8 |
| Bacteremia (primary and CLABSI) | 11 | 2 |
| Primary bacteremia | 3 | 2 |
| Secondary bacteremia | 6 | 4 |
| Catheter associated urinary tract infection (CAUTI) | 15 | 17 |
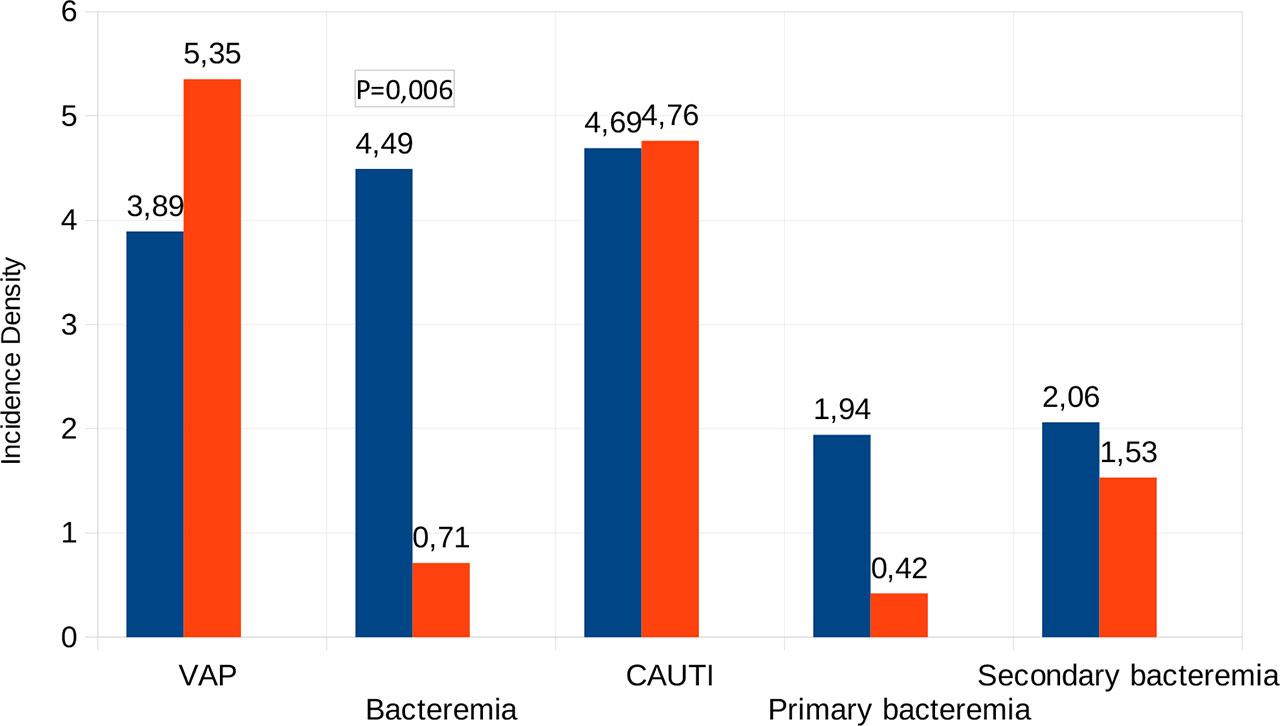
Fig. 2.
Distribution of device-associated infection in both periods. VAP: ventilator associated pneumonia. Bacteremia is the sum of primary and catheter line associated bloodstream infection (CLABSI). Incidence density is expressed as number per thousand days of use of device, except fo secondary bacteremia (per days of ICU stay)
Table 3.
Colonization incidence density and MDRO between periods
| Post-SDD | Pre-SDD | RR (CI95%) | p | |
|---|---|---|---|---|
| Colonization ID | 2,36 | 3,26 | 0.724 (0.467–1.117) | 0.127 |
| Colonization at admission ID | 1,73 | 1,95 | 0.884 (0.515–1.517) | 0.633 |
| Colonization during ICU stay ID | 0,63 | 1,31 | 0.486 (0.210–1.064) | 0.053 |
| Surveillance samples (n) | 1645 | 1831 | ||
| Positive samples (n) | 54 | 161 | ||
| Colonized patients (n) | 41 | 50 | ||
| MDRO (n) | 43 | 67 | ||
| Positive samples (%) | 3,28 | 8,79 | 0.37 (0.25–7.08) | <0.0001 |
| Colonized patients (%) | 2,67 | 2,88 | 0.92 (0.75–1.13) | 0.7064 |
| MDRO (%) | 2,41 | 3,32 | 0.71 (0.45–8.3) | 0.07 |
| MARSA (n) | 2 | 2 | ||
| Betalactamases (ESBLs) (n) | 31 | 23 | ||
| Carbapenemases (n) | 7 | 37 | ||
| Pseudomonas MDR | 2 | 3 | ||
| Acinetobacter spp MDR | 3 | 0 |