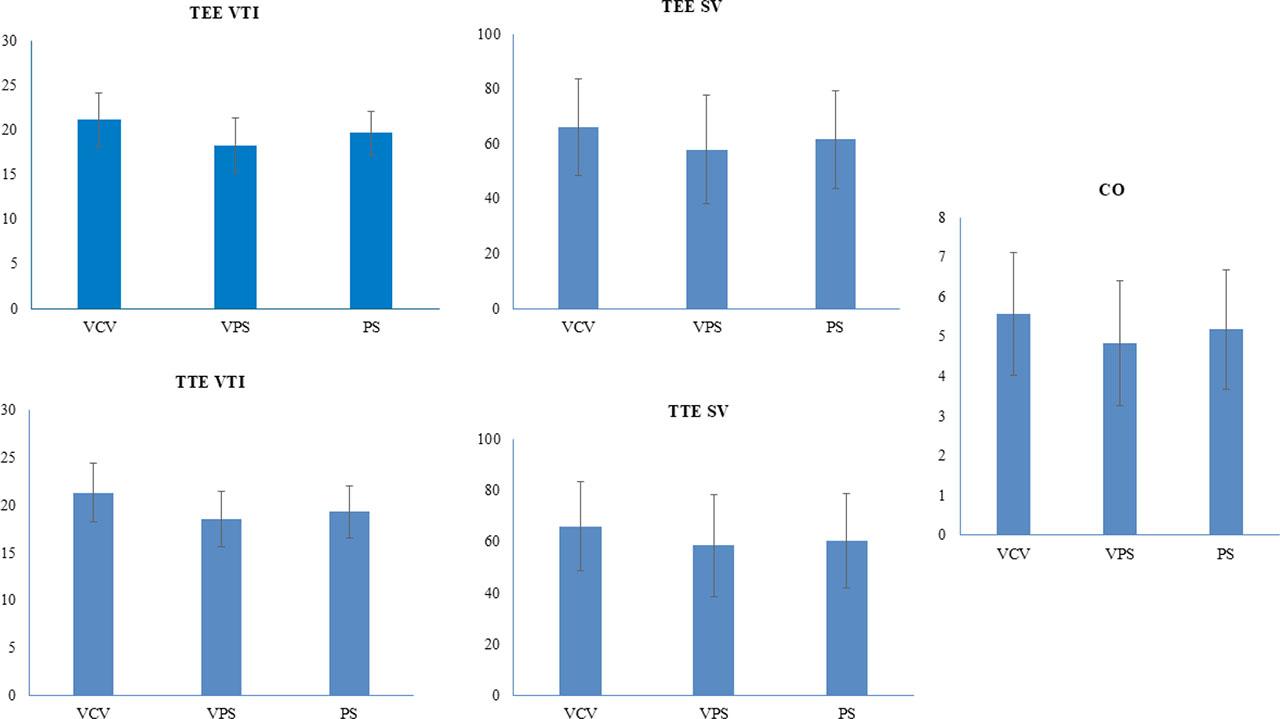
Fig. 1.
Analysis of TTE and TEE
| Ventilation mode | Parameter | TEE (mean ± S.D) | TTE (mean ± S.D) | p-value |
|---|---|---|---|---|
| VCV | VTI | 21.11±3.03 | 21.30±3.08 | 0.313 |
| SV | 65.95±17.66 | 65.95±17.37 | 1 | |
| PS | VTI | 19.65±2.48 | 19.33±2.74 | 0.202 |
| SV | 61.58±17.87 | 60.45±18.54 | 0.356 | |
| VPS | VTI | 18.30±3.07 | 18.53±2.95 | 0.108 |
| SV | 57.93±19.73 | 58.48±19.88 | 0.079 | |
The Outcomes Statistics of the hemodynamic assessment between the two arms
| Outcomes | Arm-A (VPS group) | Arm-B (PS group) | p-value | |
|---|---|---|---|---|
| Ventilator days (mean ± S.D) | 9.05± 4.56 | 9.30± 5.97 | 0.882 | |
| Length of stay (mean ± S.D) | 16.20±6.92 | 17.25±7.64 | 0.651 | |
| Weaning trial | Yes (n, %) | 12 (60%) | 10 (50%) | 0.525 |
| No (n, %) | 8 (40%) | 10 (50%) | ||
| Survival | Yes (n, %) | 10 (50%) | 8 (40%) | 0.525 |
| No (n, %) | 10 (50%) | 12 (60%) | ||
Inter-statistical comparison between the three modes in both arms
| Parameter | VCV (mean ± SD) | VPS (mean ± SD) | p-value |
|---|---|---|---|
| TEE VTI | 21.11±3.03 | 18.30±3.07 | 0.02 |
| TTE VTI | 21.30±3.08 | 18.53±2.95 | 0.04 |
| TEE SV | 65.95±17.66 | 57.93±19.73 | 0.03 |
| TTE SV | 65.95±17.37 | 58.48±19.88 | 0.05 |
| CO | 5.57±1.54 | 4.83±1.58 | 0.01 |
| Parameter | VCV (mean ± S.D) | PS (mean ± S.D) | p-value |
| TEE VTI | 21.11±3.03 | 19.65±2.48 | 0.04 |
| TTE VTI | 21.30±3.08 | 19.33±2.74 | 0.05 |
| TEE SV | 65.95±17.66 | 61.58±17.87 | 0.03 |
| TTE SV | 65.95±17.37 | 60.45±18.54 | 0.02 |
| CO | 5.57±1.54 | 5.18±1.50 | 0.04 |
| Parameter | VPS (mean ± S.D) | PS (mean ± S.D) | p-value |
| TEE VTI | 18.30±3.07 | 19.65±2.48 | 0.004 |
| TTE VTI | 18.53±2.95 | 19.33±2.74 | 0.05 |
| TEE SV | 57.93±19.73 | 61.58±17.87 | 0.002 |
| TTE SV | 58.48±19.88 | 60.45±18.54 | 0.059 |
| CO | 4.83±1.58 | 5.18±1.50 | 0.04 |
Patient characteristics and data during the study
| Data | Arm-A (VPS group) | Arm-B (PS group) | p-value | |
|---|---|---|---|---|
| Gender | Male | 13 (65%) | 13 (65%) | 1 |
| Female | 7 (35%) | 7 (35%) | ||
| Co-morbidities | ||||
| Hypertension | 13 (65%) | 8 (40%) | 0.113 | |
| Diabetes Mellitus | 10 (50%) | 4 (20%) | 0.047 | |
| Chronic Kidney Diseases | 2 (10%) | 5 (25%) | 0.407 | |
| Ischemic Heart disease | 4 (20%) | 3 (15%) | 1 | |
| Chronic obstructive pulmonary disease | 3 (15%) | 2 (10%) | 1 | |
| Clinical Data (mean± S.D) | ||||
| HR | 88.35±19.98 | 882.65±13.55 | 0.298 | |
| MAP | 73.40±7.76 | 70.20±7.17 | 0.183 | |
| Echocardiographic Data (mean± S.D) | ||||
| LVOT diameter (cm) | 2.05±0.33 | 1.93±0.30 | 0.20 | |
| TEE VTI (VCV) | 20.50±2.74 | 21.70±3.26 | 0.223 | |
| TTE VTI (VCV) | 20.50±2.91 | 22.10±3.11 | 0.101 | |
| TEE SV (VCV) | 67.95±18.63 | 63.95±16.87 | 0.481 | |
| TTE SV (VCV) | 68.00±18.17 | 63.90±16.74 | 0.463 | |
| CO (VCV) | 5.74±1.34 | 5.39±1.73 | 0.473 | |