Fig. 1.
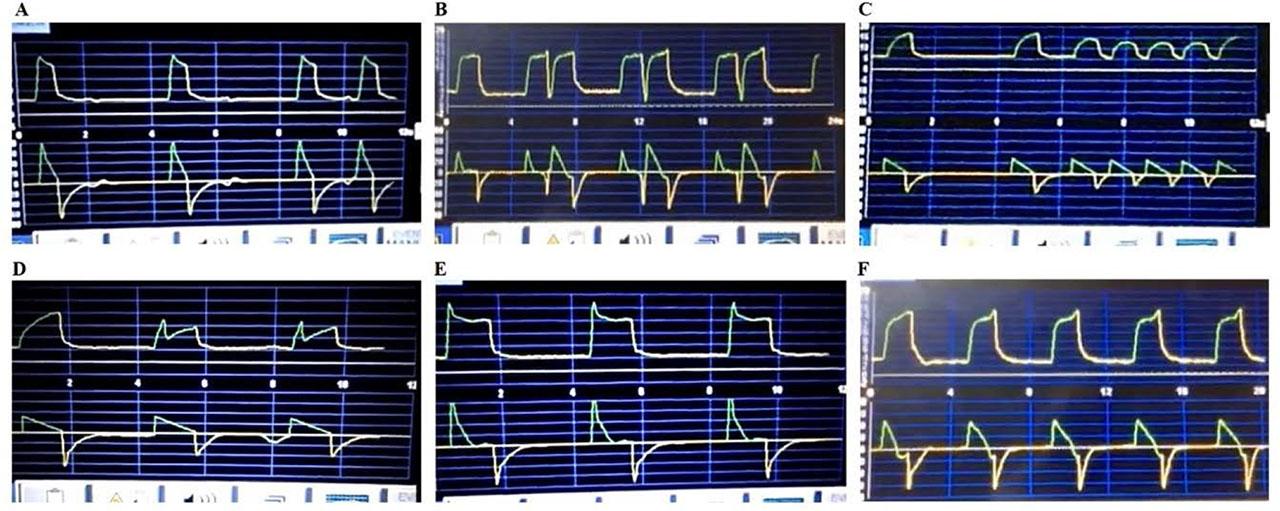
Fig. 2.
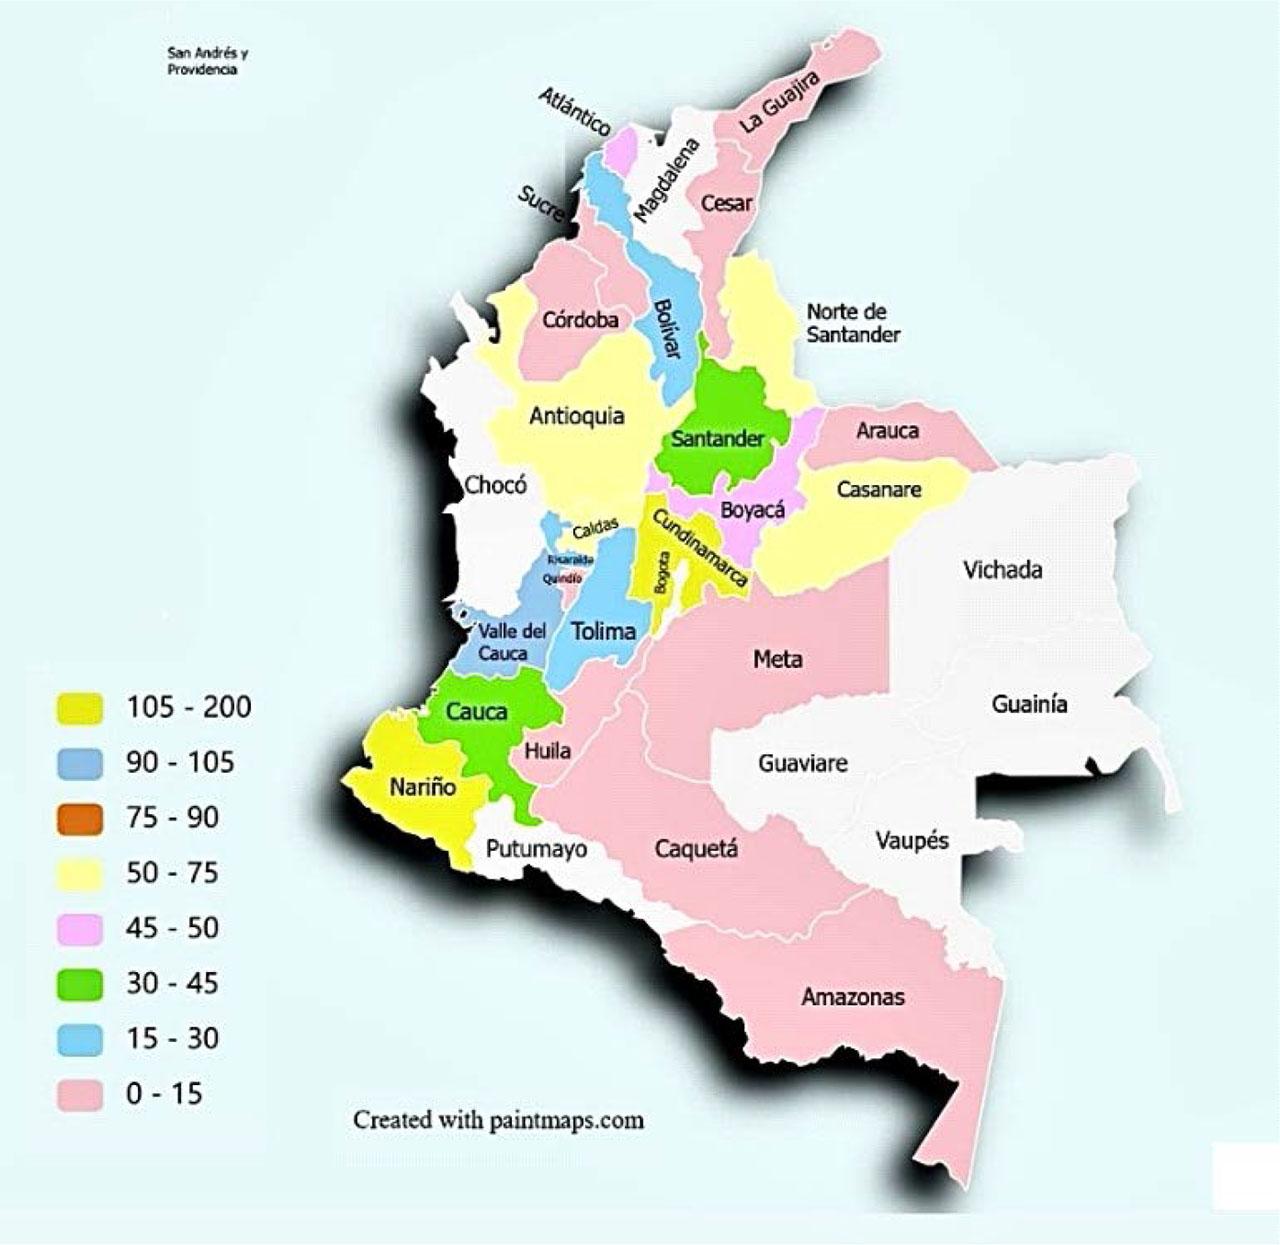
Fig. 3.
Factors associated with proper identification of all PVAs (Simple logistic regression)_
| Variable | OR (CI 95%) |
|---|---|
| Profession | |
| Physiotherapy | 1 |
| Medicine | 0.44 (0.15 – 1.28) |
| Respiratory therapy | 0.51 (0.19 – 1.36) |
| Nursing | 0.54 (0.07 – 4.07) |
| Work experience (year) | 0.99 (0.94 – 1.05) |
| Mixed ICU | 2.59 (1.10 – 4.79)* |
| Population served | |
| Adult | 1 |
| Paediatrics | 0 (0 - ∞) |
| Neonates | 3.18 (1.17 – 8.63)* |
| Frequency of waveform monitoring in MV, n (%) | |
| 1 time during a 6-hour shift | 1 |
| 1 time during a 12-hour shift | 0 (0 - ∞) |
| 2 times during a 6-hour shift | 0.53 (0.11 – 2.55) |
| 2 times during a 12-hour shift | 0.63 (0.13 – 3.03) |
| 3 times during a 12-hour shift | 0.33 (0.04 – 2.68) |
| Every 1 hour | 0.95 (0.28 – 3.23) |
| Every 2 hours | 1.38 (0.53 – 3.59) |
| Every 3 hours | 1.39 (0.47 – 4.12) |
| Do not waveform analysis VM | 0 (0 - ∞) |
| Number of beds | 1.03 (0.99 – 1.06) |
| Patients in MV per day | 1.02 (0.96 – 1.09) |
| Postgraduate training, n (%) | |
| Specialty | 1 |
| Course | 0.46 (0.11 – 2.02) |
| Training | 0 (0 - ∞) |
| Graduate | 0.50 (0.22 – 1.14) |
| Master | 1.15 (0.33 – 4.03) |
| PhD | 0 (0 - ∞) |
| Specific PVA training, n (%) | 2.38 (1.18 – 4.76)* |
Characteristics of study participants_
| Variable | Result (n = 900) |
|---|---|
| Female, n (%) | 536 (59.56) |
| Age (years), median (IQR) | 32 (28 – 38) |
| Profession, n (%) | |
| Nursing | 38 (4.22) |
| Physiotherapy | 478 (53.11) |
| Medicine | 185 (20.56) |
| Respiratory therapy | 199 (22.11) |
| Private institution, n (%) | 531 (59) |
| Postgraduate training, n (%) | |
| Course | 80 (8.89) |
| Graduate | 299 (33.22) |
| PhD | 1 (0.11) |
| Training | 60 (6.67) |
| Specialty | 381 (42.33) |
| Master | 50 (5.56) |
| None | 29 (3.22) |
| Clinical postgraduate training, n (%) | 850 (94.44) |
| Work experience (year), median (IQR) | 6 (3 – 11) |
| Mixed ICU, n (%) | 426 (47.33) |
| Specific PVA training, n (%) | 286 (31.78) |
| Population served, n (%) | |
| Adults | 811 (90.11) |
| Neonates | 49 (5.44) |
| Paediatrics | 40 (4.44) |
| Number of beds, median (IQR) | 13 (10 – 20) |
| Patients in MV per day, median (IQR) | 6 (4 – 9) |
| MV adjustment frequency, n (%) | |
| 1–2 times during the workday | 564 (62.67) |
| 3–4 times during the workday | 185 (20.56) |
| 5–6 times during the workday | 39 (4.33) |
| 7–8 times during the workday | 11 (1.22) |
| 9–10 times during the workday | 5 (0.56) |
| More than 10 times during the workday | 8 (0.89) |
| I do not make adjustments | 80 (8.89) |
| I do not feel confident making adjustments | 8 (0.89) |
| Frequency of waveform monitoring in MV, n (%) | |
| 1 time during a 6-hour shift | 184 (20.44) |
| 1 time during a 12-hour shift | 26 (2.89) |
| 2 times during a 6-hour shift | 85 (9.44) |
| 2 times during a 12-hour shift | 72 (8) |
| 3 times during a 12-hour shift | 68 (7.56) |
| Every 1 hour | 97 (10.78) |
| Every 2 hours | 169 (18.78) |
| Every 3 hours | 101 (11.22) |
| Do not waveform analysis MV | 98 (10.89) |
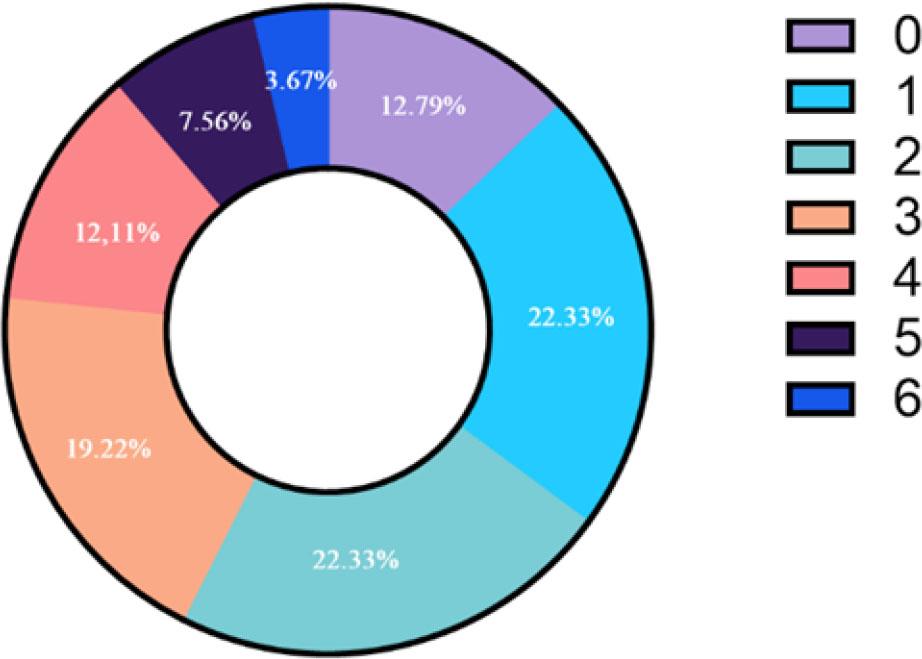
Proportion of professionals who correctly identified each of the PVAs_
| PVA | Proper identification, n (%) |
|---|---|
| Double triggering | 675 (75) |
| Late cycling | 206 (22,89) |
| Auto-triggering | 380 (42,22) |
| Insufficient flow | 296 (32,89) |
| Ineffective triggering | 261 (29) |
| Excessive flow | 278 (30,89) |
Factors associated with proper identification of all PVAs (multiple logistic regression)_
| Variable | OR (CI 95%) |
|---|---|
| Mixed ICU | 2.59 (1.19 – 5.54) |
| Population served (Neonates) | 5.19 (1.77 – 15.20) |
| Specific PVA training, n (%) | 2.38 (1.16 – 4.76) |