Fig.1.
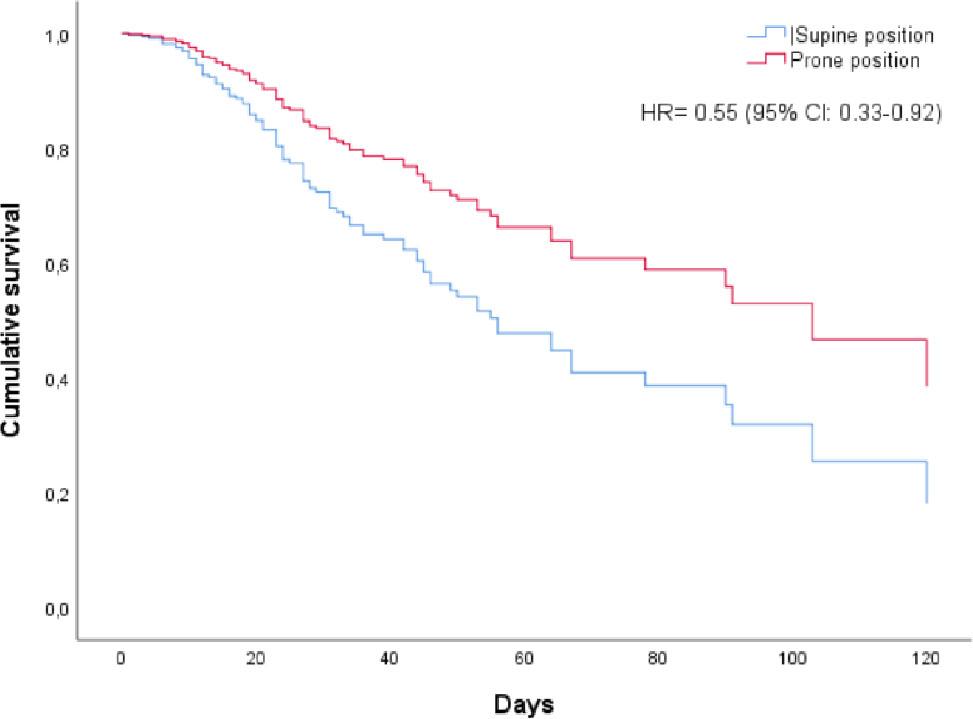
Cox regression analysis with factors associated with mortality in patients with covid 19
| Exp (B) | Wald | p | 95% CI for EXP (B) | ||
|---|---|---|---|---|---|
| Involvement pulmonary | 1.299 | 1.295 | 0.255 | 0.828 | 2.040 |
| SAPS-3 | 1.005 | 0.607 | 0.436 | 0.992 | 1.018 |
| NIV time | 0.988 | 0.620 | 0.431 | 0.958 | 1.019 |
| Age | 1.016 | 3.442 | 0.064 | 0.999 | 1.034 |
| Gender | 1.523 | 3.702 | 0.054 | 0.992 | 2.338 |
| Time of onset of symptoms | 1.008 | 0.146 | 0.703 | 0.969 | 1.048 |
| Chronic arterial disease | 0.966 | 0.009 | 0.925 | 0.469 | 1.991 |
| Awake Prone position | 0.558 | 5.216 | 0.022 | 0.338 | 0.921 |
General characteristics of patients admitted to the ICU with COVID-19
| Variables | Supine position (n=437) | Awake prone position (n=289) | p |
|---|---|---|---|
| Age, years | 63.5 ± 17.4 | 56.8 ± 13.7 | 0.001* |
| Gender, male, n (%) | 259.0 (59.4) | 200.0 (69.2) | 0.007* |
| Comorbidities | |||
| Diabetes Mellitus, n (%) | 142.0 (32.6) | 87.0 (30.1) | 0.472 |
| Systemic arterial hypertension, n (%) | 218.0 (50.0) | 129.0 (55.4) | 0.157 |
| Chronic heart failure, n (%) | 28.0 (6.4) | 15.0 (5.0) | 0.238 |
| Dyslipidemia, n (%) | 94.0 (21.6) | 52.0 (18.0) | 0.241 |
| COPD, n (%) | 28.0 (6.4) | 18.0 (6.2) | 0.917 |
| Chronic arterial disease, n (%) | 35.0 (8.0) | 11.0 (3.0) | 0.020* |
| Obesity, n (%) | 104.0 (23.9) | 95.0 (32.9) | 0.080 |
| Onset of symptoms, days | 7.0 (4.0–9.0) | 8.0 (6.0–10.0) | 0.001* |
| SAPS-3 | 52.0 (32.5–63.5) | 45.0 (29.0–53.0) | 0.001* |
| Involvement pulmonary on chest tomography | 0.001* | ||
| 0–25% changes, n (%) | 150.0 (34.5) | 51.0 (17.7) | |
| 25–50% changes, n (%) | 214.0 (49.2) | 185.0 (64.2) | |
| >50% changes, n (%) | 71.0 (16.3) | 52.0 (18.1) | |
Variables analyzed during the ICU stay in patients with COVID-19
| Variables | Supine position (n=437) | Awake prone position (n=289) | p |
|---|---|---|---|
| Non-invasive ventilation, n (%) | 284.0 (65.0) | 225.0 (77.9) | 0.001* |
| Non-invasive ventilation, days | 2.0 (1.0–5.0) | 3.0 (2.0–5.0) | 0.008* |
| High flow therapy, n (%) | 221.0 (50.6) | 228.0 (78.9) | 0.001* |
| High flow therapy, days | 3.0 (2.0–6.0) | 4.0 (2.0–6.0) | 0.006* |
| Mechanical ventilation, n (%) | 219.0 (50.1) | 141.0 (48.8) | 0.727 |
| Mechanical ventilation, days | 13.0 (7.0–23.5) | 12.0 (7.0–28.0) | 0.475 |
| Moderate or severe ARDS in the first 24 hours after intubation (PaO2/FiO2 ratio <200) | 122.0 (27.9) | 82.0 (28.3) | 0.896 |
| Prone in Mechanical Ventilation, n (%) | 88.0 (20.3) | 52.0 (18.0) | 0.655 |
| Tracheostomized in the ICU, n (%) | 69.0 (15.8) | 46.0 (15.9) | 0.963 |
| Hemodialysis, n (%) | 87.0 (19.9) | 44.0 (15.2) | 0.258 |
| ICU time, days | 20.0 (12.0–34.5) | 17.0 (12.0–30.0) | 0.120 |
| Length of hospital stay, days | 27.0 (12.0–36.0) | 23.0 (11.50–33.5) | 0.730 |
| Mortality, n (%) | 118.0 (27.1) | 40.0 (13.9) | 0.001* |