Fig. 1.
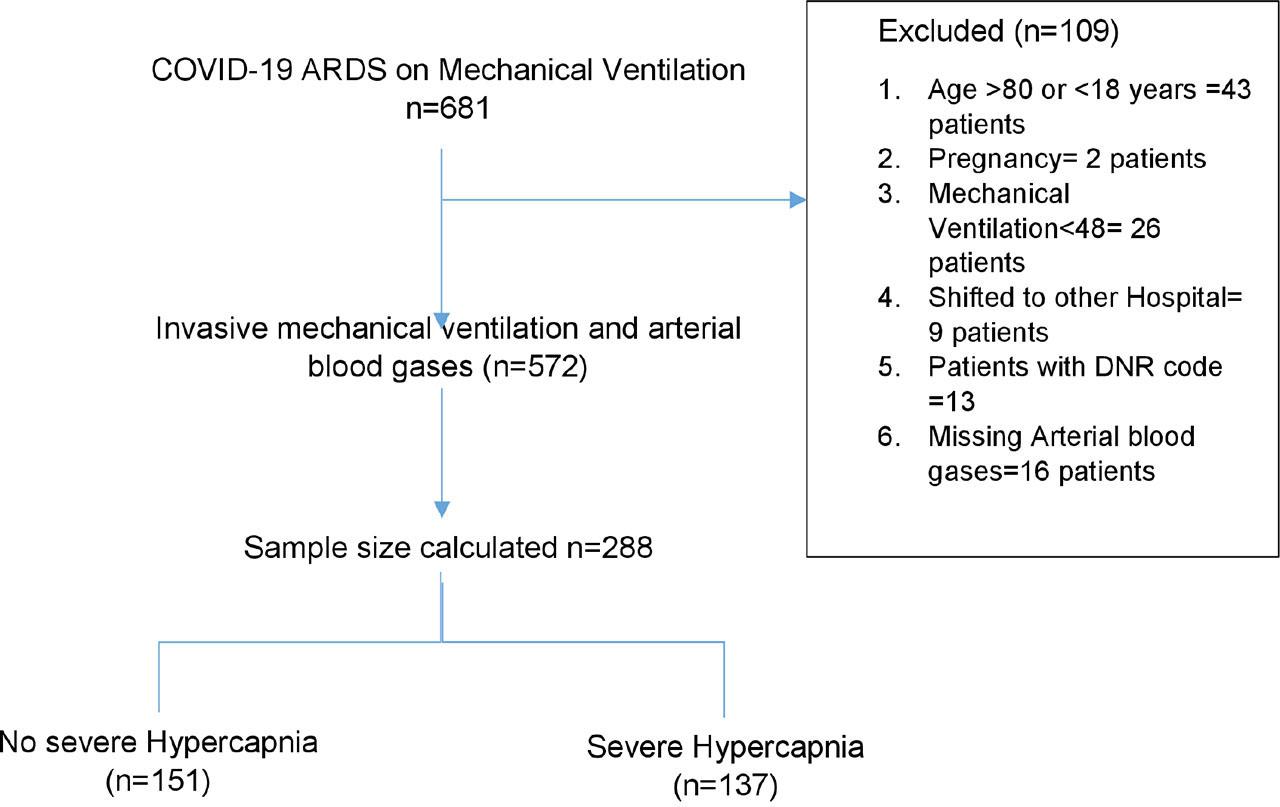
Fig. 2.
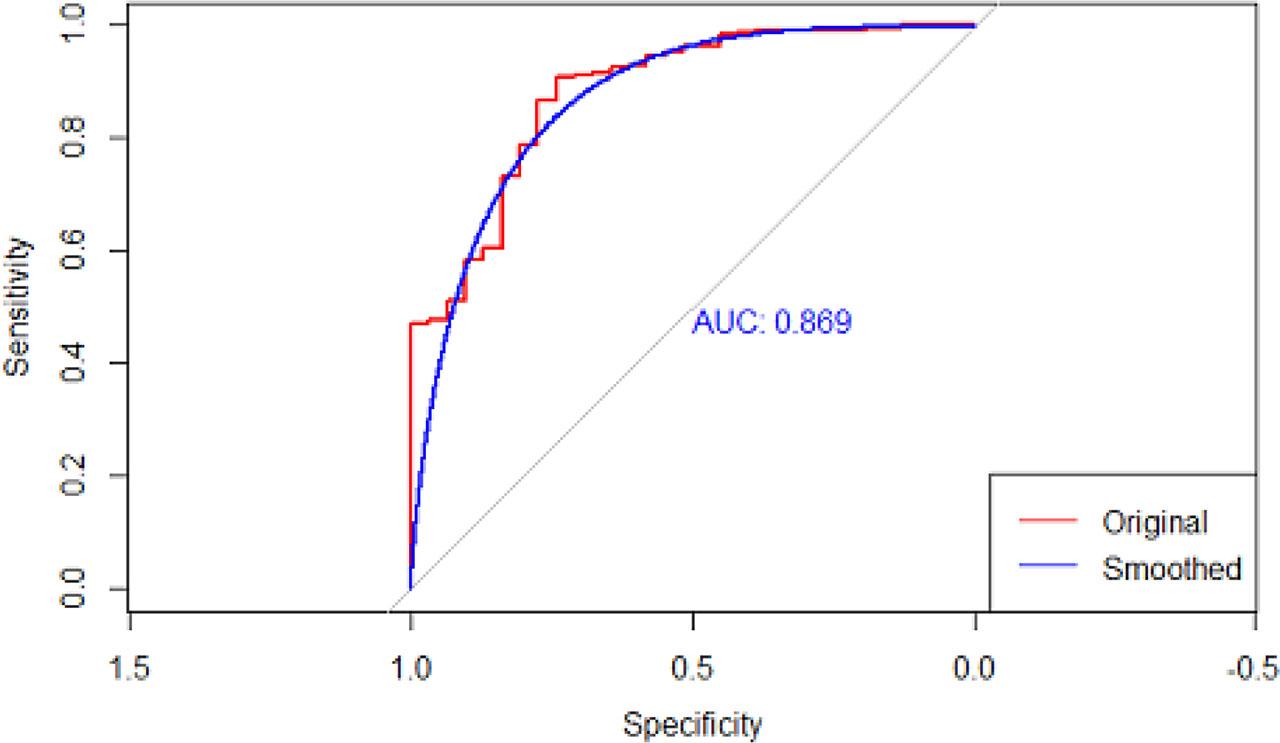
Multivariable Analysis (ROC=0_88)
| OR | 95% CI | p-value | |
|---|---|---|---|
| Severe hypercapnia | 1.08 | 0.28–3.48 | 0,993 |
| SAPS II | 1.1347 | 1.05–1.22 | 0.001 |
| Prone positioning | 0.4574 | 0.15–1.38 | 0.165 |
| Hospital-acquired infections | 1.4012 | 0.52–3.75 | 0.503 |
| Hemodynamic instability | 7.2308 | 2.49–20.9 | 0.000 |
| Dead space | 1.2778 | 1.01–1.60 | 0.033 |
| Minute ventilation | 1.3399 | 0.94–1.89 | 0.100 |
| Plateau Pressure | 0.9100 | 0.76–1.07 | 0.272 |
| Predicted body weight | 0.9182 | 0.85–0.98 | 0.012 |
| PaO2/FiO2 ratio | 0.9922 | 0.98–1.00 | 0.125 |
| Charlson Comorbidity Index | 0.8413 | 0.53–1.31 | 0.451 |
Clinical characteristics of patients with severe hypercapnia and no severe hypercapnia
| No severe hypercapnia (n=151) | Severe hypercapnia (n=137) | p-value | |
|---|---|---|---|
| Age (years) | 60 [50.5–69.0] | 61 [53, 65] | 0.90 |
| Male sex (n (%)) | 85 (56) | 84(61) | 0.45 |
| Predicted body weight (kg) | 67 [62–72] | 64 [58–70] | 0.01 |
| Charlson comorbidity index (points) | 2 [1–3] | 2 [2–3] | 0.99 |
| Simplified Acute Physiology Score II (points) | 38 [32–42] | 38 [33–42] | 0.97 |
| Co-morbid | |||
| Hypertension (n (%)) | 86 (57.0) | 87 (63.5) | 0.31 |
| Asthma (n (%)) | 9 (6.0 | 5 (3.6) | 0.52 |
| Chronic obstructive lung disease (n (%)) | 4 (2.6) | 7 (5.1) | 0.43 |
| Restrictive lung disease (n (%)) | 1(0.7) | 0 | 1.00 |
| Diabetes mellitus (n (%)) | 75 (49.7) | 66 (48.2) | 0.89 |
| Treatment during ICU stay | |||
| Prone positioning (n (%)) | 65(43) | 8(58.4) | 0.01 |
| Remdesivir (n (%)) | 114(75) | 108 (78) | 0.59 |
| Tocilizumab (n (%)) | 50(33) | 56(40) | 0.21 |
| Neuromuscular block (n (%)) | 138 (93.9) | 137 (97.2) | 0.28 |
| Steroid (n (%)) | 141 (95.9) | 138 (97.9) | 0.53 |
| NIV use (n (%)) | 117(77) | 125(91) | 0.002 |
| Recruitment (n (%)) | 11 (7.3) | 11 (8) | 0.98 |
| Arterial blood gases (a day before intubation) | |||
| pH | 7.3 (7.3–7.4) | 7.4 (7.3_7.4) | 0.01 |
| PaCO2 (mmHg) | 36 [31–41] | 39.9 [35–48] | 0.0001 |
| PaO2 (mmHg) | 69.1 [56.1–88.0] | 63.5 [55–76] | 0.03 |
| PaO2/FiO2 (ratio) | 79 [63–124] | 70 [57–86] | 0.000 |
| Lactate | 1.8(1.2–2.5) | 2(1.2–1.4) | 0.73 |
| Arterial blood gases (after 24 hours of mechanical ventilation) | |||
| pH | 7.3(7.3_7.4) | 7.3(7.2–7.4) | 0.00 |
| PaCO2 (mmHg) | 40(35–45) | 54(48–60) | 0.00 |
| PaO2 (mmHg) | 80.2 [68.9, 103] | 73 [65, 86.2] | 0.002 |
| Lactate | 1.8(1.2–2.5) | 2(1.3–2.2) | 0.98 |
| PaO2/FiO2 (ratio) | 122[ 88–182] | 93[ 73–123] | 0.001 |
| Tidal volume(ml/kg) | 6.1(5.9–6.5) | 6(5.8–5.6) | 0.08 |
| Tidal volume(ml) | 400 [400, 440] | 400 [350, 420] | 0.000 |
| Set respiratory rate | 28 [25–30] | 30 [28–35] | 0.0001 |
| Minute ventilation | 11.2 [ 9.6–12.6] | 12 [10–12] | 0.07 |
| Applied peep | 10.5 (8–12) | 10 (8–10) | 0.45 |
| Plateau pressure | 29 [28, 30] | 30 [28, 30] | 0.003 |
| Driving pressure | 18 [16, 20] | 19 [16, 21] | 0.03 |
| Static compliance | 22 [18–27] | 23 [19, 25.0] | 0.41 |
| Corrected minute ventilation | 11 [ 9.2, 13.4] | 16[13, 18.3] | 0.00 |
| MAP | 92(85–100) | 92(85–102) | 0.63 |
| Heart rate | 100(90–110) | 101(90–114) | 0.10 |
| Mortality | 127(84) | 130(94) | 0.04 |
Univariate Regression Analysis
| OR (95%CI) | p-value | |
|---|---|---|
| Severe hypercapnia | 3.5096 (1.4605, 8.4333) | 0.005 |
| Age | 1.05 (1.02, 1.09) | 0.003 |
| Gender, male | 0.84 (0.40, 1.80) | 0.6 |
| Predicted body weight | 0.96 (0.92, 1.01) | 0.11 |
| SAPSII | 1.11 (1.06, 1.17) | <0.001 |
| Charlson Comorbidity Index | 1.14 (1.06, 1.91) | 0.022 |
| Non-invasive ventilation before intubation | 2.29 (0.94, 5.20) | 0.056 |
| Prone positioning | 0.50 (0.22, 1.07) | 0.082 |
| Use of steroid | 7.47 (1.76, 29.9) | 0.004 |
| Use of Tociluzumab | 0.79 (0.37, 1.71) | 0.5 |
| Use of Remdisivir | 0.79 (0.28, 1.90) | 0.6 |
| Use of neuromuscular block | 8.57 (2.58, 27.8) | <0.001 |
| PaO2/FiO2 ratio before mechanical ventilation | 1.00 (0.99, 1.00) | 0.2 |
| After 24-h of ventilation | ||
| PaO2/FiO2 ratio | 0.99 (0.99, 1.00) | 0.009 |
| Tidal volume, ml | 1.00 (0.99, 1.00) | 0.3 |
| Tidal volume, ml/kg | 1.18 (0.70, 2.10) | 0.5 |
| Minute ventilation | 1.19 (1.01, 1.41) | 0.042 |
| Respiratory rate | 1.09 (1.02, 1.17) | 0.011 |
| Driving pressure | 0.94 (0.86, 1.03) | 0.2 |
| Compliance | 1.02 (0.96, 1.08) | 0.6 |
| Plateau pressure | 1.01 (0.90, 1.14) | 0.8 |
| Dead space | 1.25 (1.12, 1.41) | <0.001 |
| Applied peep | 1.13 (1.00, 1.29) | 0.054 |
| Duration of hospital stay | 0.94 (0.91, 0.98) | <0.001 |
| Duration of mechanical ventilation | 1.02 (0.94, 1.11) | 0.7 |
| Acidosis | 2.25 (1.06, 4.88) | 0.036 |
| Hospital-acquired infections | 1.93 (0.88, 4.12) | 0.092 |
| Hemodynamic instability | 6.36 (2.87, 14.2) | <0.001 |
Secondary outcome in severe hypercapnia and no severe hypercapnia
| Severe hypercapnia | No severe hypercapnia | p-value | |
|---|---|---|---|
| Hemodynamic instability | 125(82) | 115(83) | 0.91 |
| Arrhythmia | 31 (21) | 25 (17.7) | 0.79 |
| Acute coronary syndrome | 40 (27.2) | 32 (22.7) | 0.63 |
| Impair liver enzyme | 11 (7.2) | 8 (5.0) | 0.79 |
| Emphysema | 15 (9) | 23 (16.3) | 0.22 |
| Renal replacement therapy | 48(31) | 29(28) | 0.05 |
| Pneumothorax | 8 (5) | 11 (8) | 0.48 |
| Deep vein thrombosis | 2 (1.3) | 1 (1.4) | 1.00 |
| Hospital Acquired Infection | 99 (65) | 107 (75.9) | 0.03 |
| Pulmonary embolism | 3(2) | 5 (2) | 0.13 |
| Ventilator duration | 7 [ 4, 10] | 6 [ 4, 10] | 0.19 |
| Hospital length of stay | 11 [ 8, 15] | 14 [ 9, 21] | 0.04 |
| Ventilator duration in survivals(days) | 11(6–21) | 6.3(4.5–5.75) | 0.065 |
| Hospital length of stay in survivals(days) | 34(29–33) | 17(14–11) | 0.005 |