Fig. 1.
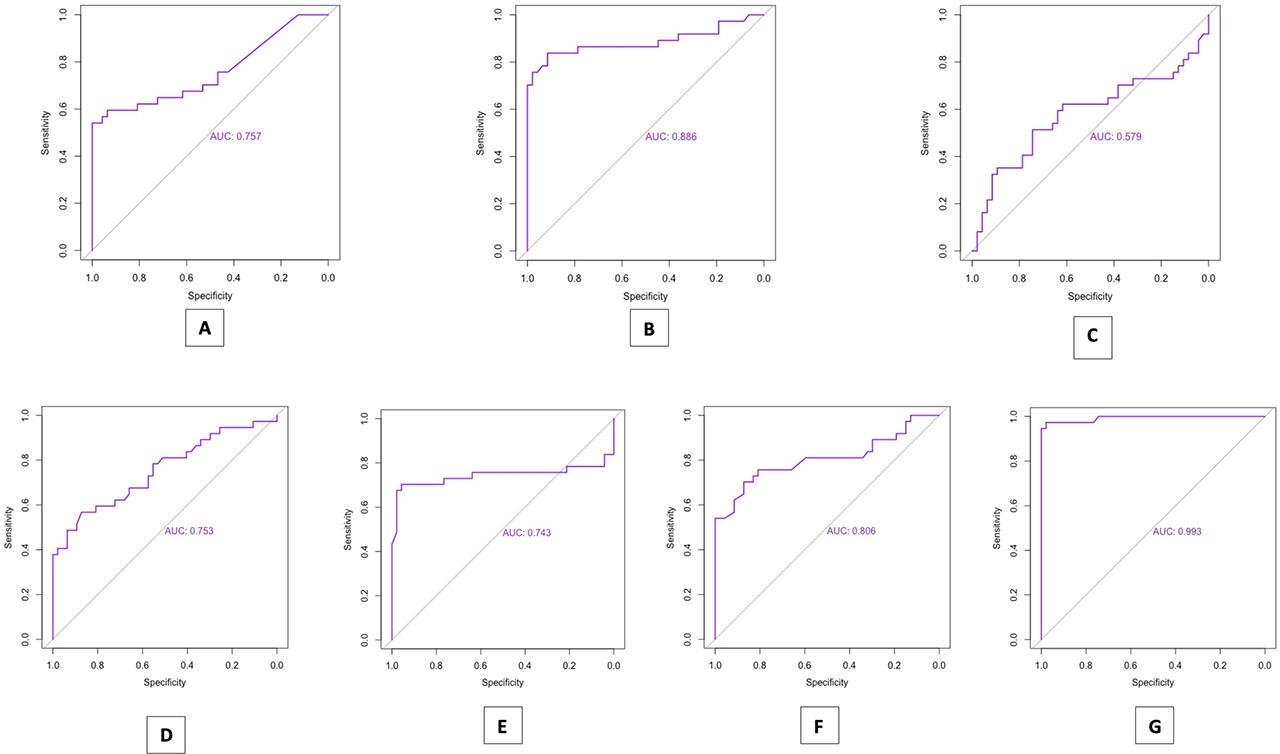
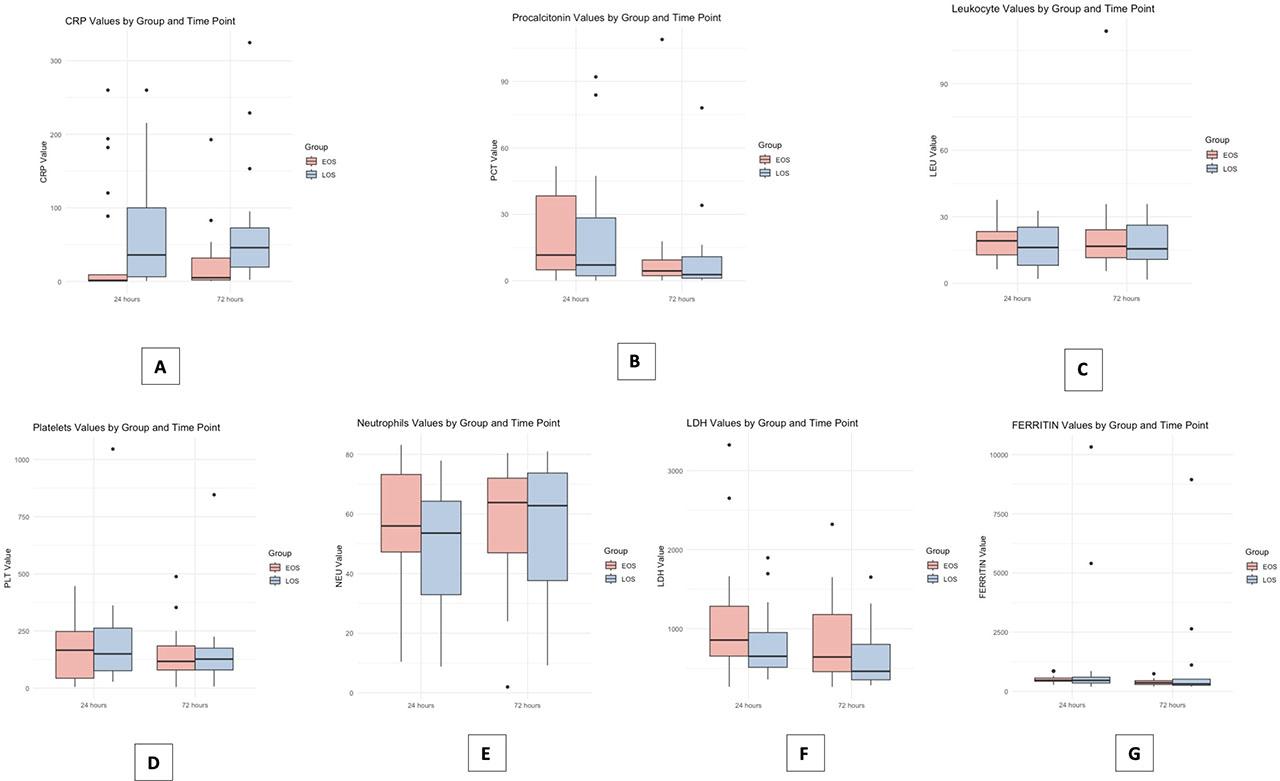
Fig. 2.
Comparing the second values (at 24 hours after onset) using the two-sample Wilcoxon signed rank test_ Presented are the p-values_
| Variables | EOS vs Control (p-value) | LOS vs Control (p-value) | EOS vs LOS (p-value) |
|---|---|---|---|
| CRP | 0.0015 | 0.000005 | 0.00001 |
| Procalcitonin | 0.00005 | 0.00001 | 0.741 |
| Leukocyte | 0.4655 | 0.254 | 0.926 |
| Neutrophils | 0.00001 | 0.000001 | 0.668 |
| Platelets | 0.0076 | 0.0008 | 0.956 |
| LDH | 0.0009 | 0.0006 | 0.130 |
| Ferritin | 0.00001 | 0.000001 | 0.063 |
Comparing the first and last measured values for continuous variables using the two-sample Wilcoxon signed rank test_ Presented are the p-values_
| Variables | EOS (p-value) | LOS (p-value) | Control (p-value) |
|---|---|---|---|
| CRP | 0.787 | 0.798 | 0.029 |
| Procalcitonin | 0.081 | 0.934 | 0.739 |
| Leukocyte | 0.740 | 0.214 | 0.002 |
| Neutrophils | 0.245 | 0.942 | 0.144 |
| Platelets | 0.342 | 0.364 | 0.00001 |
| LDH | 0.006 | 0.00001 | 0.061 |
| Ferritin | 0.0002 | 0.0038 | 0.529 |
Descriptive statistics for patients with confirmed culture results_
| Variables | EOS | LOS | Overall |
|---|---|---|---|
| Negative blood culture | 17 (48.57%) | 4 (10.25%) | 21 |
| Positive blood culture | 18 (51.43%) | 35 (89.75%) | 53 |
| Microorganism for BC+ (positive blood culture) | |||
| Klebsiella spp | 8 (44.4%) | 15 (42.85%) | 23 |
| Escherichia coli | 5 (27.78%) | 4 (11.42%) | 9 |
| Staphyloccocus aureus | 2 (11.12%) | 2 (5.71%) | 4 |
| Enterobacter | 1 (5.55%) | 2 (5.71%) | 3 |
| Serratia marcescens | 2 (11.12%) | 6 (17.14%) | 8 |
| Enterococcus | 0 (0%) | 3 (8.57%) | 3 |
| Pseudomonas aeruginosa | 0 (0%) | 2 (5.71%) | 2 |
| Others | 0 (0%) | 1 (2.85%) | 1 |
Descriptive statistics
| Variables | EOS | LOS | Control | Overall |
|---|---|---|---|---|
| n= | 35 (28.92%) | 39 (32.23%) | 47 (38.84%) | 121 |
| Delivery mode: | ||||
| Vaginal | 17 (24.6%) | 13 (18.8%) | 39 (56.5%) | 69 |
| Cesarian section | 18 (35.3%) | 25 (49.0%) | 8 (15.7%) | 51 |
| GA | ||||
| 24–28 weeks | 4 (44.4%) | 4 (44.4%) | 1 (11.1%) | 9 |
| 29–32 weeks | 8 (30.7%) | 6 (23.1%) | 12 (46.2%) | 26 |
| 33–37 weeks | 21 (33.8%) | 19 (30.7%) | 22 (35.5%) | 62 |
| >38 weeks | 2 (8.3%) | 10 (41.7%) | 12 (50.0%) | 24 |
| Onset of sepsis1 | 18.3 (14.0) hours | 13.0 (7.1) days | ||
Relationship among the categorical variables_ The association between surgical intervention and the necessity of oxygen supplementation for LOS patients_
| Variable | Surgical interventions in LOS group (n=) | p-value | ||
|---|---|---|---|---|
| No | Yes | |||
| Oxygen therapy | No | 6 | 2 | 1 |
| Yes | 22 | 9 | ||
| High flow nasal canula | No | 21 | 10 | 0.397 |
| Yes | 7 | 1 | ||
| nCPAP | No | 27 | 9 | 0.189 |
| Yes | 1 | 2 | ||
| nIPPV/nCPAP | No | 27 | 11 | 1 |
| Yes | 1 | 0 | ||
| SIMV | No | 19 | 3 | 0.0344 |
| Yes | 9 | 8 | ||