
Fig. 1.
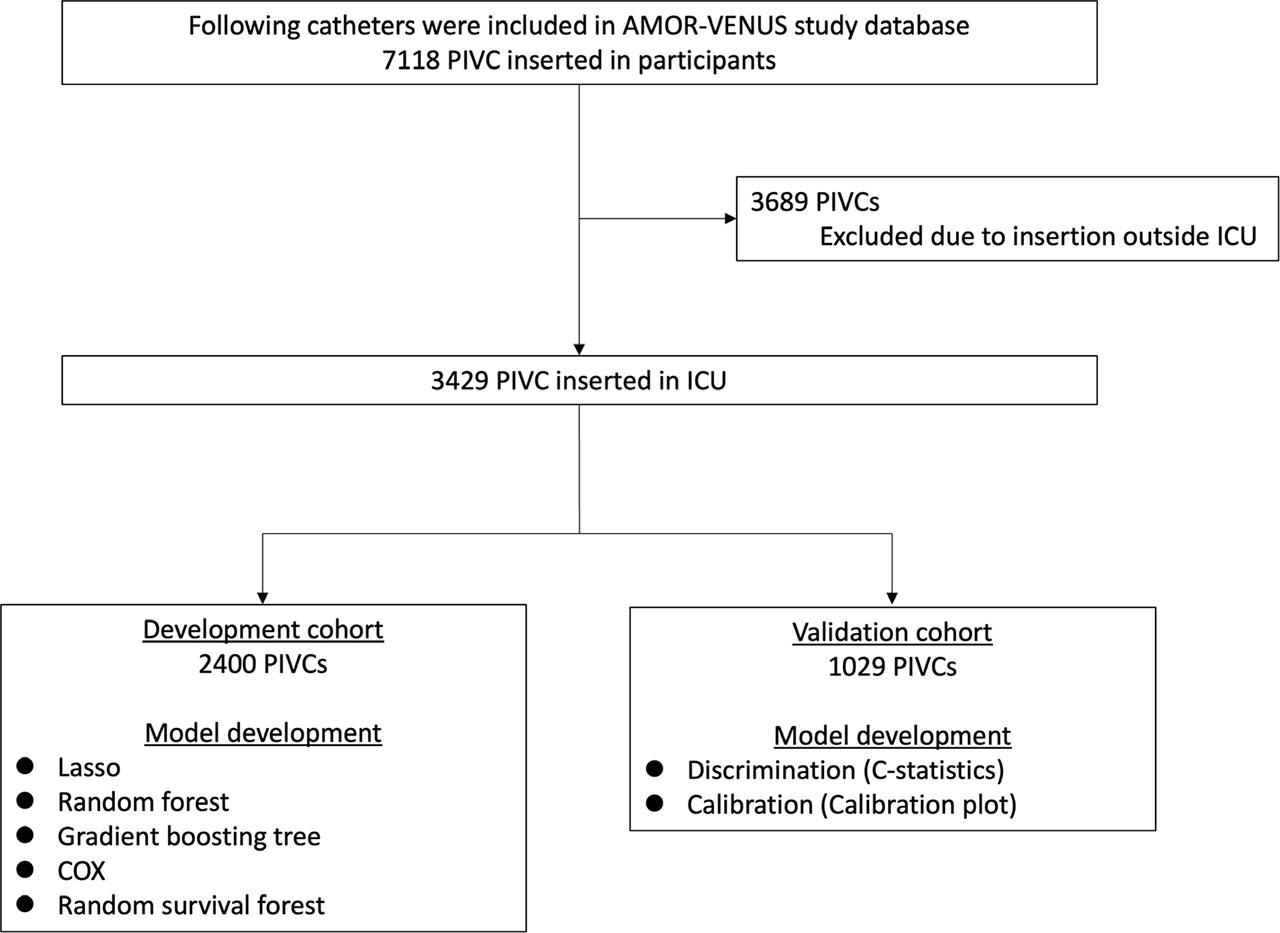
Fig. 2.
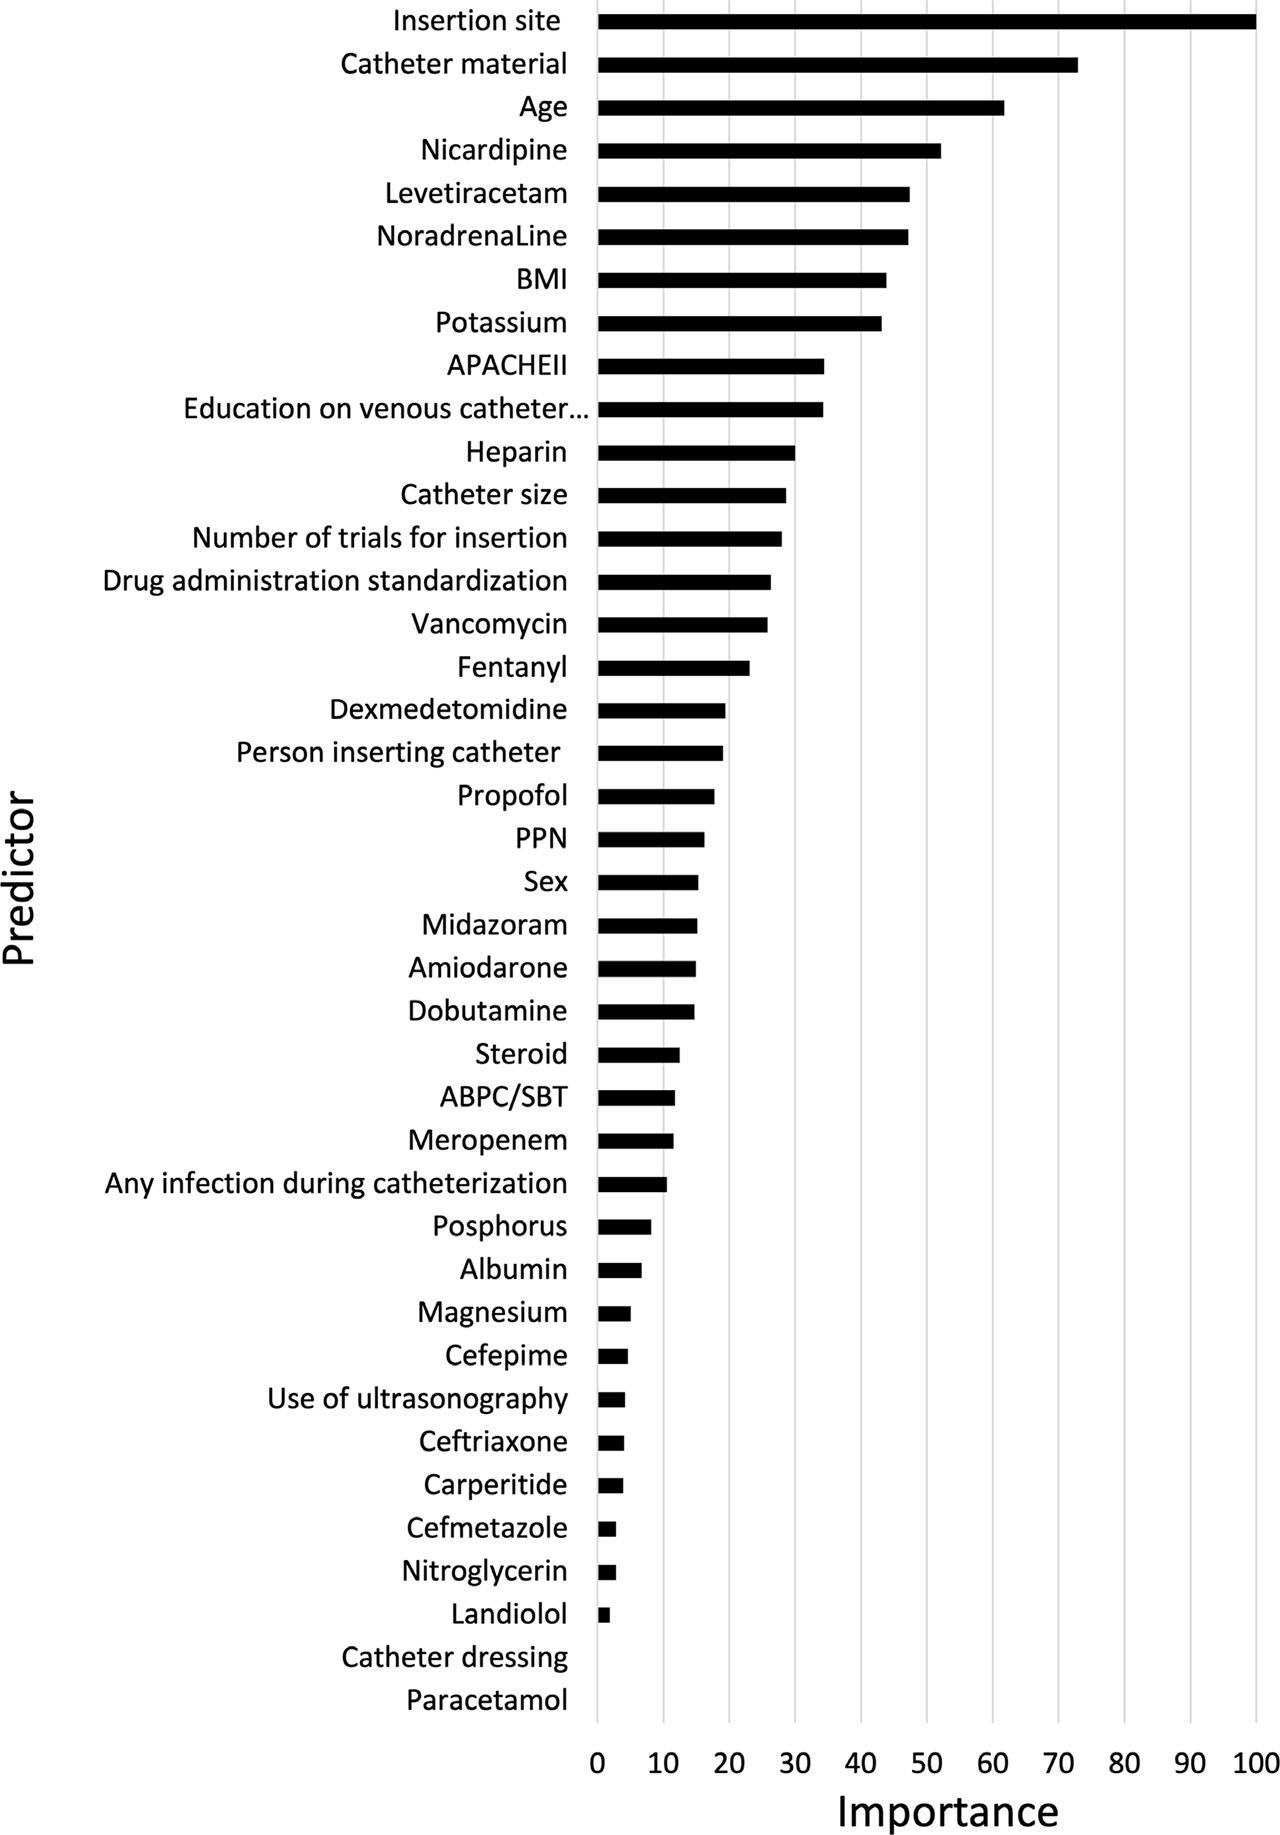
Fig. 3.
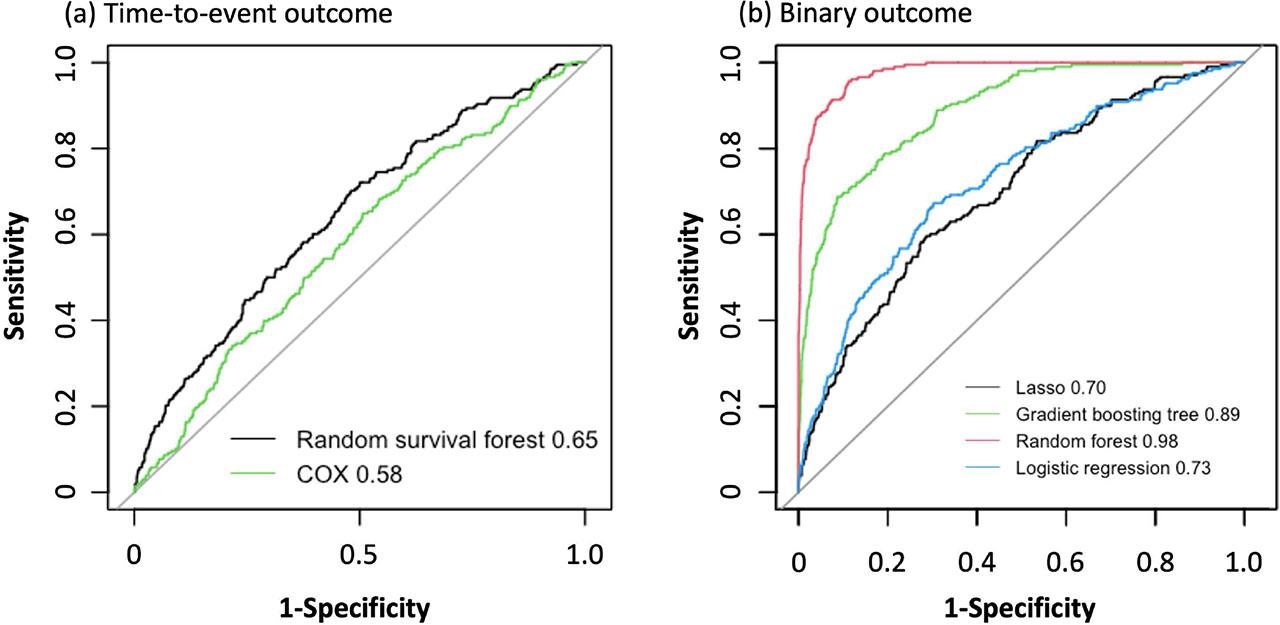
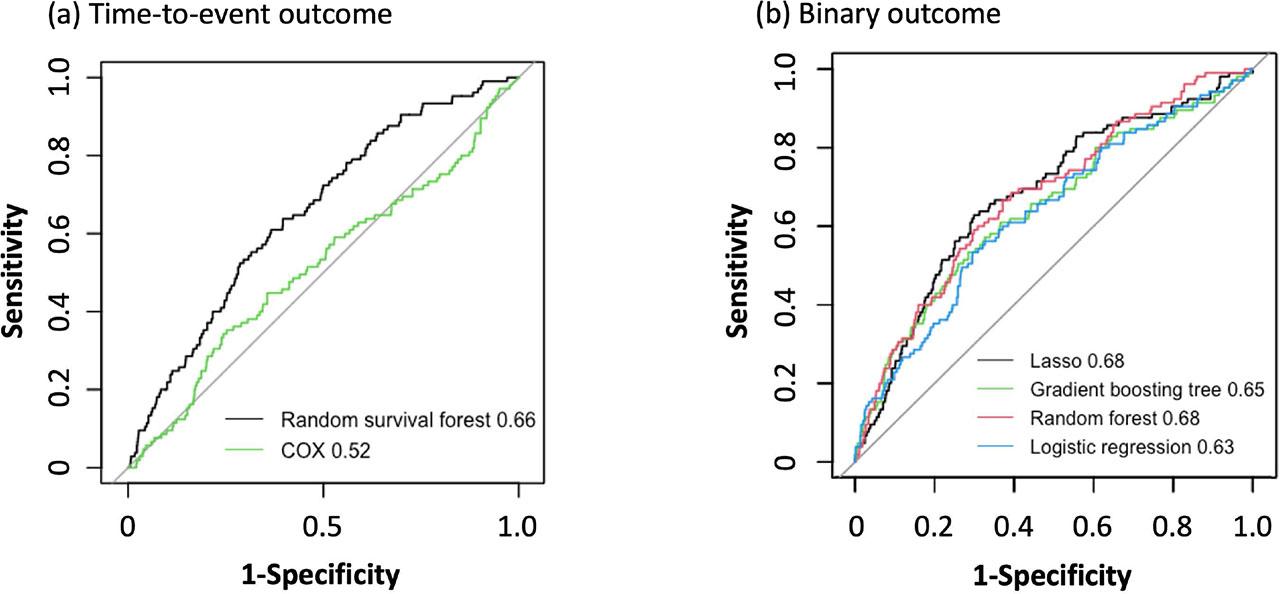
Fig. 4.
Patient characteristics of the development and validation cohorts at ICU admission
| Variables | Development cohort (N = 2,400) | Validation cohort (N = 1,029) |
|---|---|---|
| Age, mean (SD), years | 68.1 (15.2) | 67.9 (15.0) |
| Sex, male (n, %) | 1485 (61.9) | 637 (61.9) |
| Body height, mean (SD), cm | 161 (9.6) | 161 (9.6) |
| Body weight, mean (SD), kg | 59.9 (15.4) | 60.1 (14.9) |
| BMI, mean (SD) | 23.0 (4.7) | 23.1 (4.5) |
| APACHE II, mean (SD) | 19.2 (8.3) | 19.2 (8.2) |
| SAPS II, mean (SD) | 44.0 (19.5) | 44.3 (19.0) |
| SOFA, mean (SD) | 6.8 (3.7) | 6.7 (3.7) |
| Charlson comorbidity index, mean (SD) | 4.2 (2.6) | 4.2 (2.6) |
| ICU admission from (n, %) | ||
| Operation room | 921 (38.4) | 427 (41.5) |
| Emergency room | 965 (40.2) | 404 (39.3) |
| General ward | 363 (15.1) | 142 (13.8) |
| Outpatients | 18 (0.8) | 2 (0.2) |
| Transfer from other hospital | 133 (5.5) | 54 (5.3) |
| Type of admission to the ICU (n, %) | ||
| Elective surgical | 478 (19.9) | 214 (20.8) |
| Emergency surgical | 443 (18.5) | 213 (20.7) |
| Medical | 1479 (61.6) | 602 (58.5) |
| ICU admission category (n, %) | ||
| Cardiology | 860 (35.8) | 341 (33.1) |
| Pulmonary | 350 (14.6) | 160 (15.6) |
| Gastrointestinal | 243 (10.1) | 100 (9.7) |
| Neurology | 455 (19.0) | 212 (20.6) |
| Trauma | 95 (4.0) | 41 (4.0) |
| Urology | 21 (0.9) | 10 (1.0) |
| Gynaecology | 16 (0.7) | 8 (0.8) |
| Skin/tissue | 33 (1.4) | 17 (1.7) |
| Others | 327 (13.6) | 140 (13.6) |
| Sepsis at ICU admission (n, %) | 495 (20.6) | 209 (20.3) |
| Mechanical ventilation within 24 hours after admission to ICU (n, %) | 1433 (59.7) | 631 (61.3) |
PIVC characteristics during the insertion of the development and validation cohorts
| Variables | Development cohort (N = 2,400) | Validation cohort (N = 1,029) |
|---|---|---|
| Catheter inserted by (n,%) | ||
| Doctor | 203/1,879 (10.8) | 81/801 (10.1) |
| Nurse | 1,673/1,879 (89.0) | 720/801 (89.9) |
| Inserted Site (n, %) | ||
| Upper arm | 245/2,378 (10.3) | 111/1,021 (10.9) |
| Forearm | 1,303/2,378 (54.8) | 546/1,021 (53.5) |
| Elbow | 113/2,378 4.8) | 50/1,021 (4.9) |
| Wrist | 118/2,378 5.0) | 44/1,021 (4.3) |
| Hand | 341/2,378 (14.3) | 166/1,021 (16.3) |
| Lower leg | 152/2,378 (6.4) | 73/1,021 (7.1) |
| Dorsal foot | 106/2,378 (4.5) | 31/1,021 (3.0) |
| Catheter material | ||
| PEU-Vialon* | 777/2,400 (32.4) | 310/1,029 (30.1) |
| Polyurethane | 658/2,400 (27.4) | 320/1,029 (31.1) |
| Polyethylene | 0/2,400 (0) | 0/1,029 (0) |
| Tetrafluoroethylene | 910/2,400 (37.9) | 382/1,029 (37.1) |
| Others | 55/2,400 (2.3) | 17/1,029 (1.7) |
| Catheter gauge (n,%) | ||
| 14G | 1/2,357 (0.04%) | 0/1,011 (0) |
| 16G | 51/2,357 (2.2) | 22/1,011 (2.2) |
| 18G | 56/2,357 (2.4) | 33/1,011 (3.3) |
| 20G | 612/2,357 (26.0) | 276/1,011 (27.3) |
| 22G | 1,592/2,357 (67.5) | 662/1,011 (65.5) |
| 24G | 45/2,357 (1.9) | 17/1,011 (1.7) |
| Antiseptic solution before catheterisation (n,%) | ||
| None | 5/1,863 (0.3) | 3/802 (0.4) |
| Alcohol | 1,817/1,863 (97.5) | 782/802 (97.5) |
| 0.2% chlorhexidine alcohol | 14/1,863 (0.8) | 7/802 (0.9) |
| 0.5% chlorhexidine alcohol | 10/1,863 (0.5) | 5/802 (0.6) |
| 1.0% chlorhexidine alcohol | 12/1,863 (0.6) | 5/802 (0.6) |
| 10% povidone iodine | 2/1,863 (0.1) | 0/802 (0) |
| other | 3/1,863 (0.2) | 0/802 (0) |
| Use of ultrasonography (n,%) | 36/1,844 (1.9) | 22/792 (2.8) |
| Number of trials for insertion (n,%) | ||
| 1 | 1,501/1,834 (81.8) | 618/785 (79.7) |
| 2 | 221/1,834 (12.1) | 92/785 (11.7) |
| ≥3 | 112/1,834 (6.1) | 75/785 (9.6) |
| Difficulties with the insertions (n, %) | ||
| Easy | 882/1,811 (48.7) | 350/783 (44.7) |
| Slightly easy | 535/1,811 (29.5) | 237/783 (30.3) |
| Slightly difficult | 306/1,811 (16.9) | 150/783 (19.2) |
| Difficult | 88/1,811 (4.9) | 46/783 (5.9) |
| Glove (n,%) | ||
| Sterile | 14/1,836 (0.8) | 5/794 (0.6) |
| Non-sterile | 1,738/1,836 (94.7) | 758/794 (95.5) |
| Nothing | 84/1,836 (4.6) | 31/794 (3.9) |
| Dressing (n,%) | ||
| Chlorhexidine-impregnated dressing chrolehexidne | 0/2,377 (0) | 0/1,019 (0) |
| Sterile polyurethane dressing | 2,338/2,377 (98.4) | 989/1,019 (97.1) |
| Non-sterile polyurethane dressing polyuretane | 35/2,377 (1.5) | 25/1,019 (2.5) |
| Gauze dressing | 0/2,377 (0) | 1/1,019 (0.1) |
| Tape dressing | 4/2,377 (0.2) | 4/1,019 (0.4) |
| Any infection during catheter dwell (n, %)** | 550/2,400 (22.9) | 253/1,029 (24.6) |
| Duration of catheter dwell, median (IQR), hour | 44.7 (20.7–79.1) | 41.5 (21.0–76.5) |
| Phlebitis (n,%) | 208/2,400 (8.7) | 105/1,029 (10.2) |
Difference of c-statistics in each model in the validation cohort
| Model | C-statistics (95%CI) |
|---|---|
| Binary outcome models | |
| LASSO | 0.680 (0.625–0.735) |
| Random forest | 0.677 (0.622–0.731) |
| Gradient boosting tree | 0.646 (0.587–0.706) |
| Logistic regression model | 0.633 (0.575–0.691) |
| Survival outcome models | |
| Random survival forest | 0.655 (0.603–0.708) |
| Cox proportional hazards model | 0.516 (0.454–0.578) |
Difference of c-statistics in each model in the development cohort
| Model | C-statistics (95% CI) |
|---|---|
| Binary outcome models | |
| LASSO | 0.699 (0.662–0.736) |
| Random forest | 0.980 (0.973–0.986) |
| Gradient boosting tree | 0.892 (0.870–0.914) |
| Logistic regression model | 0.725 (0.688–0.762) |
| Survival outcome models | |
| Random survival forest | 0.645 (0.606–0.684) |
| Cox proportional hazards model | 0.581 (0.542–0.621) |