
Fig. 1.
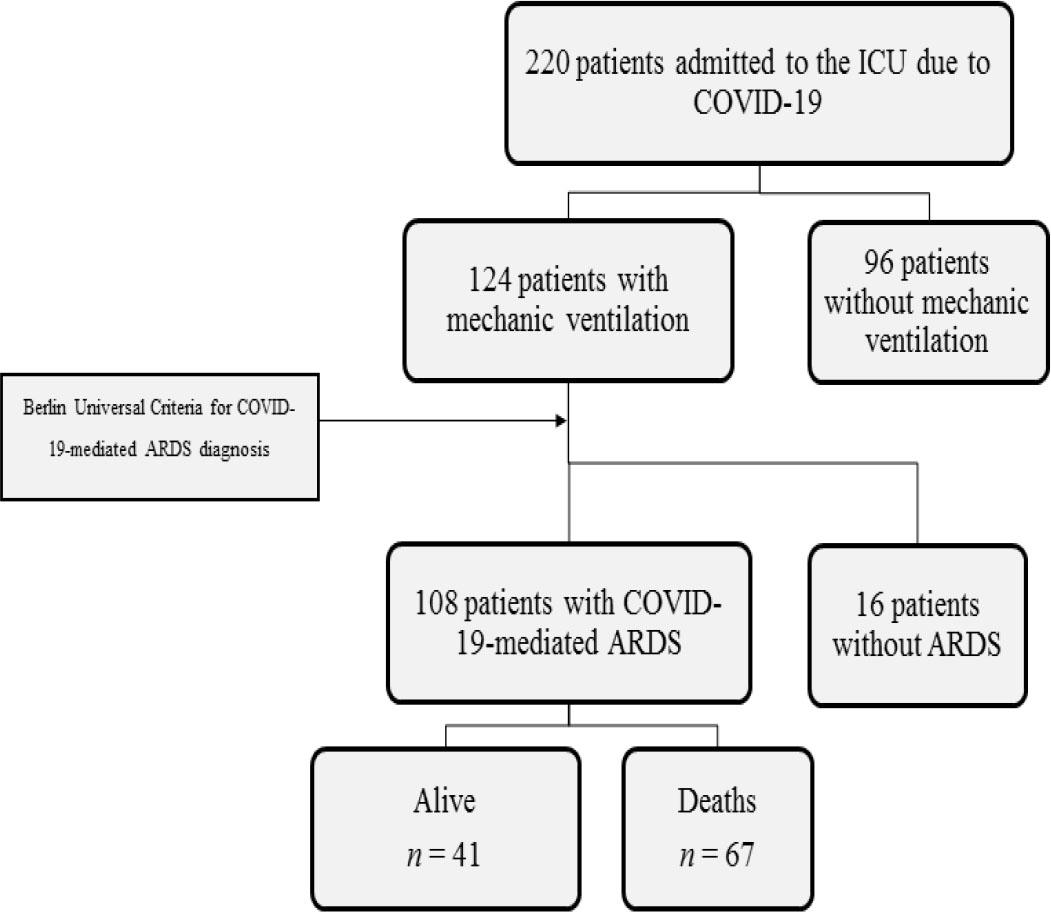
Fig. 2.
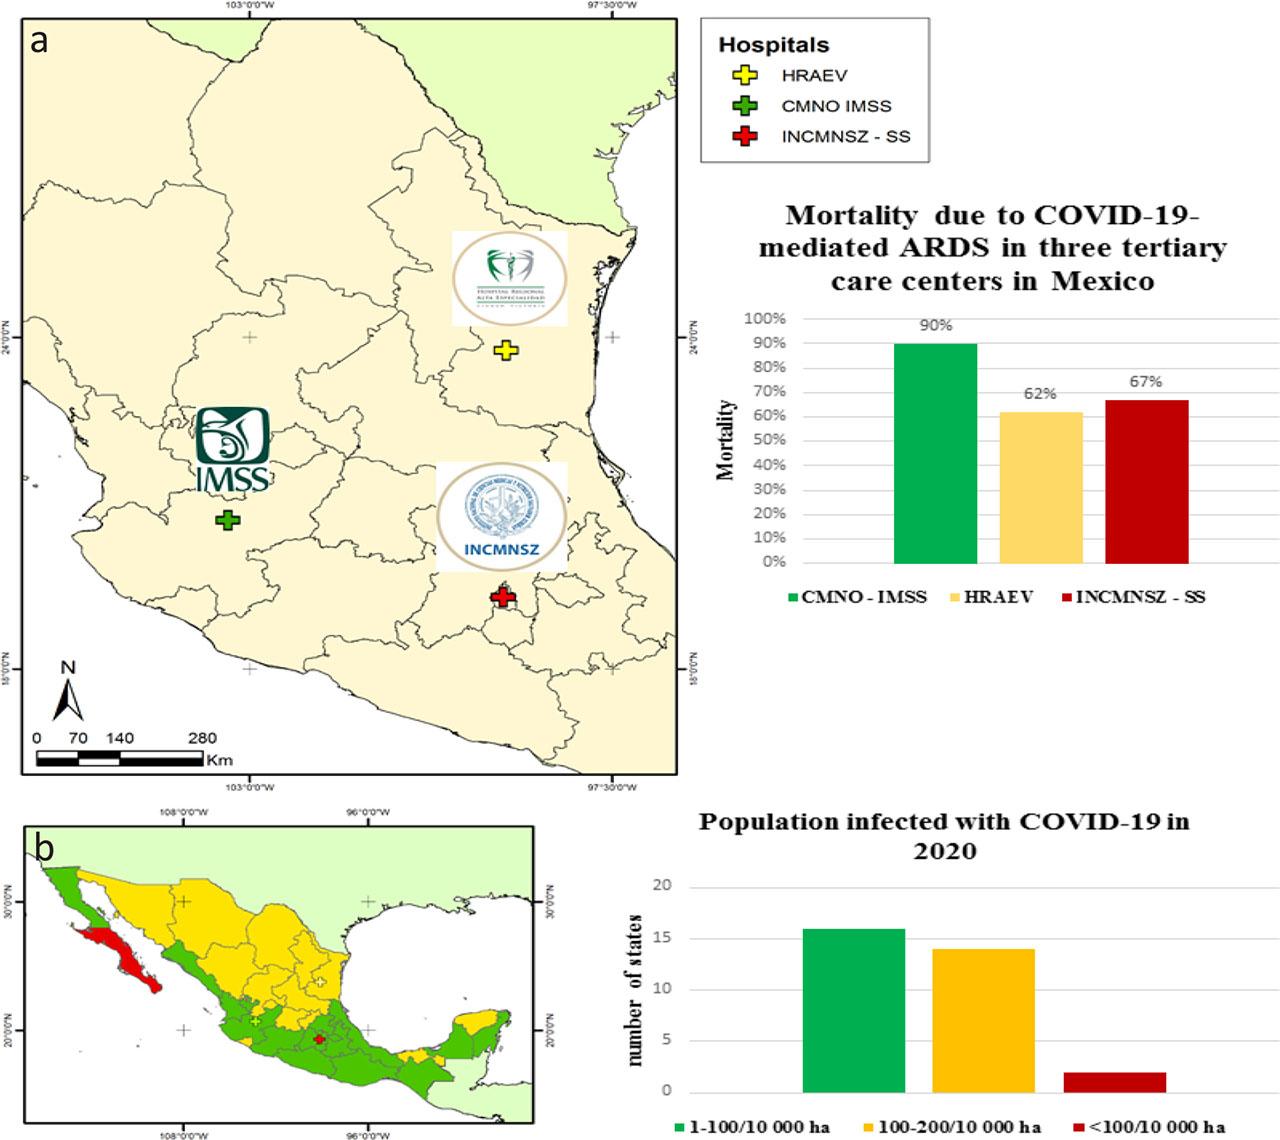
Incidence and mortality parameters of patients with ARDS due to COVID-19 in three tertiary care hospitals in the Mexican Republic_ (N = number of patients infected by COVID-19) *[22] **[21]
| Hospital | N | ARDS (%) | Chi-2 Test | Mortality (%) | Chi-2 Test | Average age | Beds | COVID-19 Specialists | Comorbidity |
|---|---|---|---|---|---|---|---|---|---|
| HRAEV | 220 | 108 (49%) | X2 =3255.13 | 67 (62%) | X2 =45.04 | 59 | 50 | 13 | Diabetes |
| *CMNO – IMSS | 1010 | 408 (40%) | df=2 | 364 (90%) | df=2 | 58 | 249 | ≈50 | Hypertension |
| **INCMNSZ | 800 | 241 (30%) | p < 0.05 | 159 (66%) | p < 0.05 | 52 | 168 | ≈36 | Obesity |
Respiratory variables in patients who developed ARDS due to COVID-19
| Ventilatory parameters | All (n=) | Live patients (N=) | Deceased patients (N=) | p value |
|---|---|---|---|---|
| Days from symptom onset to mechanical ventilation | 14±4.8 | 11±5.2 | 17±6.7 | 0.005** |
| Days on mechanical ventilation since IUC admission | 23±8 | 19±5 | 27±11 | 0.004** |
| PaCO2 (mmHg) | 55±14 | 48±11(45–87) | 65±14 (55–105) | 0.048* |
| FiO2 % | 62±13 (50–90) | 55±12 (35–70) | 70±15 (50–100) | 0.061 |
| Plateau pressure (cm/H2O) | 28.2±6.2 | 27.3±5(15–38) | 29.5±7.3(16–49) | 0.072 |
| PaO2/FiO2 (mmHg) | 115±66 | 153±57(66–304) | 126±77(43–400) | 0.045* |
| PEEP (cm/H2O) | 13.6±2 | 13±1.7(8–14) | 13±3.2(8–18) | 0.781 |
| Driving pressure cm/H2O | 15±4 (11–38) | 13±5(11–22) | 18±7(11–38) | 0.05* |
| Distensibility (ml-cm/H2O) | 49±17 (13–76) | 48±13 (36–76) | 25±18(13–43) | 0.061 |
| Vt-predicted weight | 7.2±1.7 | 6.8±1.2(5.5–7.1) | 6.5±0.8(5.6–6.8) | 0.23 |
| TAC (pattern %) *. targeted | *70% | 85% | *50% | 0.24 |
| Ç. CONsolidated | Ç50% | 30% | Ç75% | 0.067 |
Patient diagnostic data, vital signs, and laboratory values at baseline
| Vital signs | All (n=) | Live Patients (N=) | Deceased Patients (N=) | p value |
|---|---|---|---|---|
| Mean blood pressure, mmHg | 80±7 | 82±9 (65–88) | 75±8(59–78) | 0.12 |
| Heart rate, bpm | 97±12 (78–123) | 97±11 (78–125) | 0.83 | |
| Laboratory findings | ||||
| Ferritin (ng/mL) | 576±59 | 597±27 (345–789) | 965±32 (489–1450) | 0.01** |
| 3739±1214 | 2905±975 | 6642±1868 | 0.01** | |
| CRP (mg/dL) | 107±23 | 89±35 (34–123) | 116±45 (78–230) | 0.07 |
| Lymphocytes (%) | 08±04 (01–16) | 12±04 (05–19) | 06±03 (01–20) | 0.05* |
| Leukocytes (109/L) | 19.4±23.7 | 17.6±18.5 (12–28) | 24.5±23.7 (13–34) | 0.10 |
Patient demographics and comorbidities at baseline
| Variable | All (n= 108) | Live Patients (N=) | Deceased Patients (N=) | p-value |
|---|---|---|---|---|
| Age (N) | 59±13 | 52±12.6 | 66±11.5 | 0.00** |
| Male | 72 (67%) | 27 (25%) | 45 (42%) | 0.88 (NS) |
| Female | 36 (33%) | 14 (13%) | 22 (20%) | |
| Body mass index, kg/m2 (n) | 32.8±6.2 | 32±6.8 | 32±5.9 | 0.79 (NS) |
| Systemic Arterial Hypertension | 62 (57%) | 23 (21%) | 39 (36%) | 0.05 (NS) |
| Diabetes Mellitus 2 | 56 (52%) | 19 (17%) | 37 (34%) | 0.04* |
| Heart Disease | 12 (11%) | 5 (4%) | 7 (6%) | 0.78 (NS) |
| Chronic Renal Failure | 6 (5.6%) | 2 (1%) | 4 (3%) | 0.67 (NS) |
| Number of patients with COPD (Chronic obstructive pulmonary disease) | 52/108 | 17/42 | 35/66 | |
| Scores | ||||
| NUTRIC-2 | 6.5±2.5 | 6.0±1.5 | 7±2 | 0.17 (NS) |
| SOFA | 9±3 | 6.8±3.1 | 10.4±2.3 | 0.06 (NS) |
| APACHE II | 23±7 | 18±7.6 | 26±5.3 | 0.017* |