
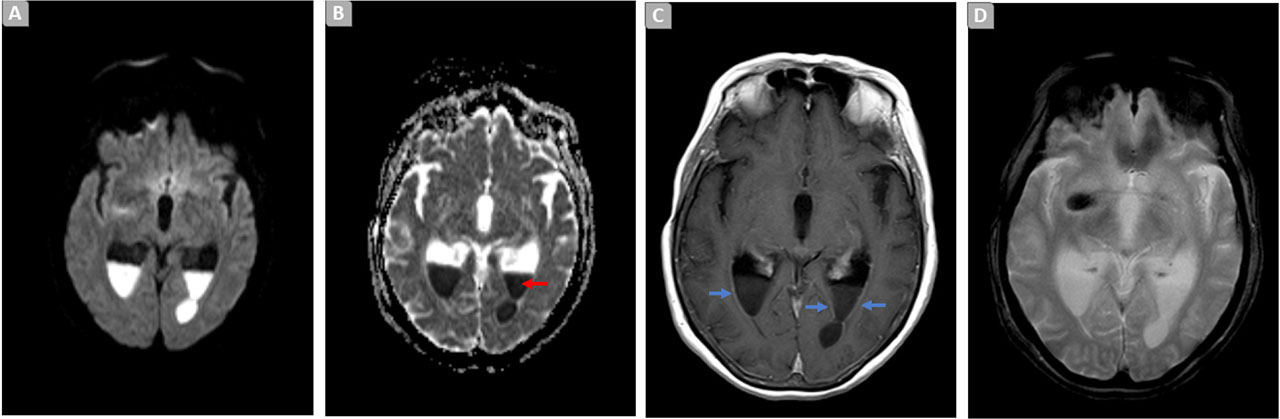
Fig. 1.
Brain MRI. Axial diffusion weighted image (A), ADC map (B), T1 SE post-contrast (C), and T2*-GRE (D), demonstrating signs of ventriculitis manifested by an increase in dimensions and ‘tension’ of the walls in the occipital and temporal horns of the ventricular system [C, blue arrows]. Content with restricted diffusion and a liquid level in the occipital horns: indicating purulent content [A–B: red arrow]. There is no significant blooming in T2* suggestive of hemorrhage [D].
Table 1.
Evolution of Pseudomonas Aeruginosa susceptibility testing.
| Antibiogram | CSF (day 25) | BRS (day 25) | BRS (day 48) |
|---|---|---|---|
| Piperacillin-tazobactam | R | R | R |
| Amikacin | - | - | - |
| Aztreonam | R | R | R |
| Cefepime | R | R | SIE |
| Ceftazidime | R | R | R |
| Ciprofloxacin | R | R | R |
| Imipenem | R | R | R |
| Meropenem | R | R | R (>32 mg/l) |
| Tobramycin | S | S | S |
| Levofloxacin | R | R | R |
| Colistin | S | S (1.0 mg/l) | S (2.0 mg/l) |
| Ceftazidime-avibactam | R | R | R (>256 mg/l) |
| Ceftolozane-tazobactam | S | S | R |
| Imipenem-cilastin-relebactam | R (6.0 mg/l) | R | R (4.0 mg/l) |
| Meropenem-varobactam | - | - | - |
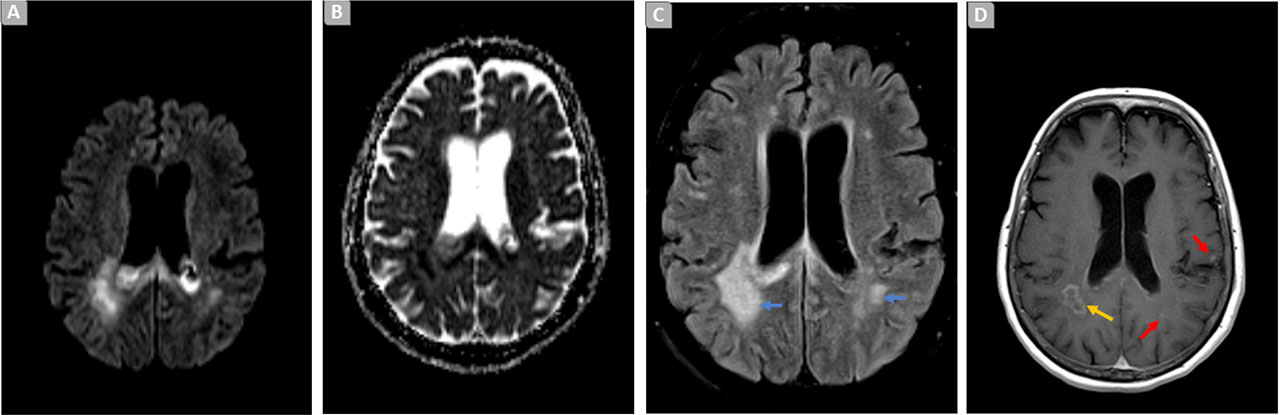
Fig. 2.
Brain MRI. Axial diffusion weighted image (A), ADC map (B), T2/FLAIR (fluid-attenuation-inversion-recovery) (C) and T1 SE post contrast (D), showing increased signal in T2iFLAIR image at the adjacent bilateral periventricular parenchyma [C, blue arrows], with restricted diffusion [A-B] and anomalous contrast enhancement [D], exhibiting signs of loculation in the right parietal white matter [D, yellow arrow] and some focal contralateral nodules [I), red arrows].
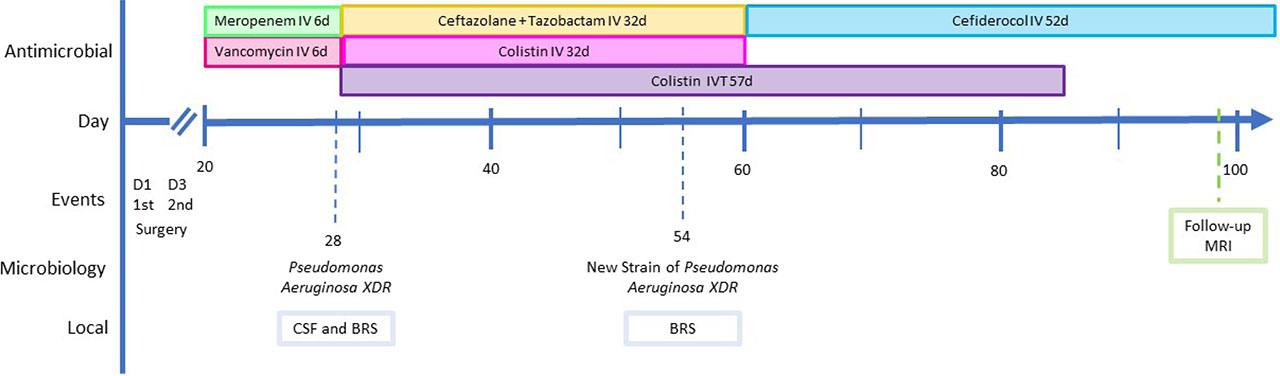
Fig. 3.
Timeline of events, microbiological findings, and antimicrobial periods. Abbreviations: BRS- bronchial respiratory sample: CSF- cerebral spinal fluid d- days: I, intravenous: IVT- intraventricular: Nal- Magnetic resonance imaging: XDR- Extensively drug-resistant.