
Fig. 1.
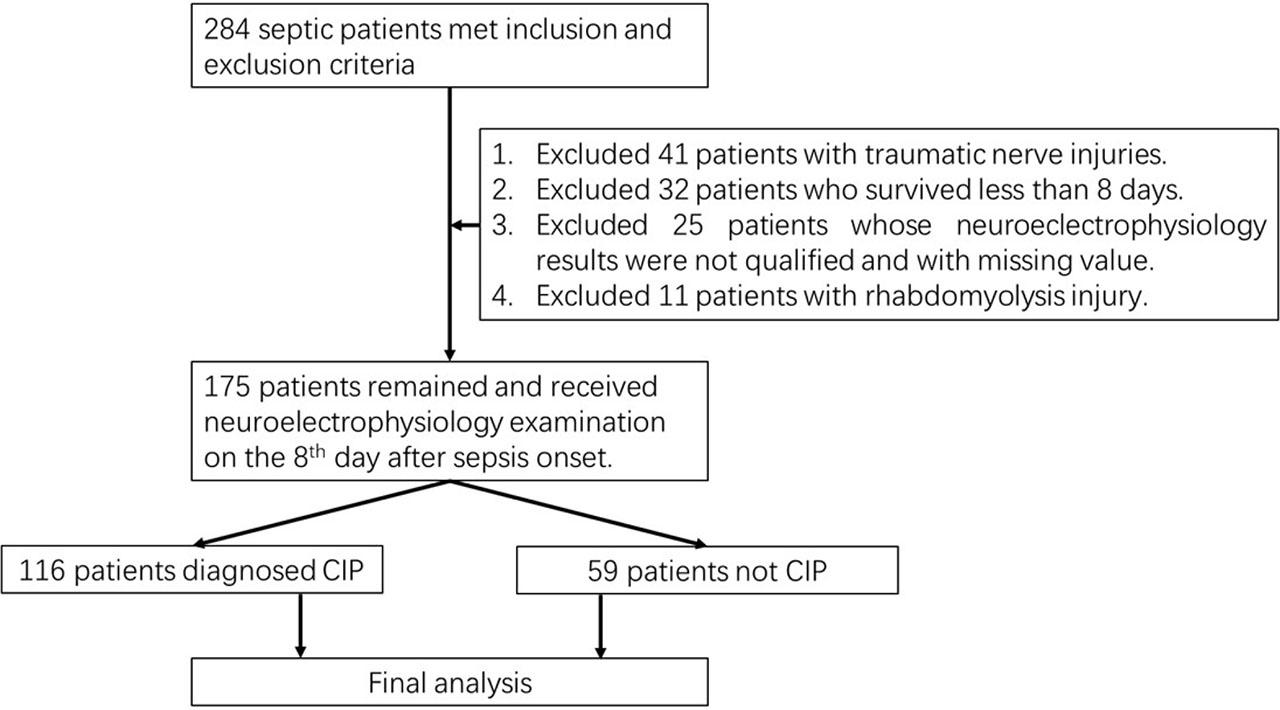
Fig. 2.
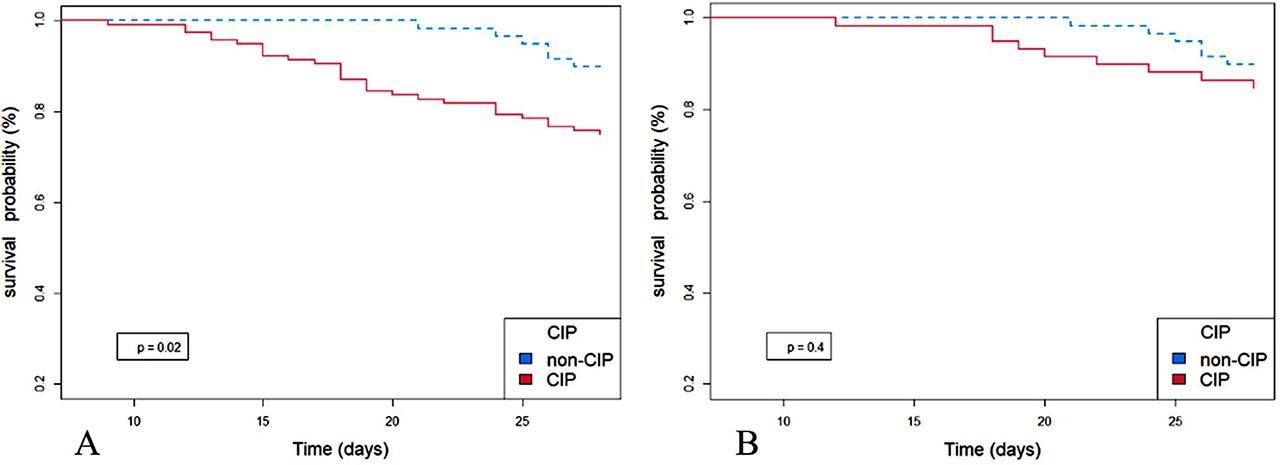
Fig. 3.
CSF Measurement in Septic Participants Before and After PSMA
| Characteristics | Before PSM | After PSM | ||||||
|---|---|---|---|---|---|---|---|---|
| All (n=175) | CIP (n=116) | Non-CIP (n=59) | P | All (n = 118) | CIP (n=59) | Non-CIP (n=59) | P | |
| Age (year) | 57.4±15.1 | 57.7±15.0 | 56.9±15.4 | 0.76 | 57.3±15.3 | 57.7±15.4 | 56.9±15.4 | 0.79 |
| SOFA | 10.8±4.5 | 11.5±4.6 | 9.2±4.0 | <0.01 | 9.5±4.1 | 9.7±4.3 | 9.2±4.0 | 0.52 |
| APACHE II | 18.1±5.8 | 19.0±5.9 | 16.4±5.1 | <0.01 | 16.5±5.0 | 16.7±4.9 | 16.4±5.1 | 0.77 |
| Lactate (mmol/L) | 6.7±4.1 | 7.5±4.2 | 5.2±3.4 | <0.01 | 5.5±3.5 | 5.8±3.7 | 5.2±3.4 | 0.41 |
| Diabete history | 67 | 39 | 28 | 0.11 | 56 | 29 | 27 | 0.85 |
| CSF | ||||||||
| Glucose (mmol/L) | 3.98±1.11 | 3.98±1.12 | 3.96±1.10 | 0.99 | 4.0±1.2 | 4.1±1.2 | 4.0±1.1 | 0.69 |
| Protein (mg/L) | 1369.3±841.0 | 1705.8±744.2 | 707.6±593.2 | <0.01 | 1123.5±772.1 | 1539.4±706.2 | 707.6±593.2 | <0.01 |
| Cl-(mmol/L) | 123.4±4.9 | 123.0±5.0 | 124.1±4.7 | 0.16 | 123.9±5.0 | 123.7±5.3 | 124.1±4.7 | 0.62 |
| WBC (× 106/L) | 3.2±1.6 | 4.0±1.5 | 1.5±0.8 | <0.01 | 2.8±1.6 | 4.0±1.2 | 1.5±0.8 | <0.01 |
| Lipopolysaccharide (eu/mL) | 0 | 0 | 0 | NA | 0 | 0 | 0 | NA |
| fungus | 0 | 0 | 0 | NA | 0 | 0 | 0 | NA |
| bacteria | 0 | 0 | 0 | NA | 0 | 0 | 0 | NA |
| Interleukin-1 (pg/m L) | 23.0±12.6 | 29.4±10.0 | 10.5±5.8 | <0.01 | 20.0±12.3 | 29.4±9.5 | 10.5±5.8 | <0.01 |
| Interleukin-6 (pg/m L) | 1089.9±526.4 | 1264.1±429.0 | 747.3±535.1 | <0.01 | 993.9±534.7 | 1240.4±408.5 | 747.3±535.1 | <0.01 |
| Interleukin-8 (pg/mL) | 9558.9±4715.4 | 10949.5±3818.1 | 6824.7±5131.1 | <0.01 | 8471.6±4838.6 | 10118.5±3921.8 | 6824.7±5131.1 | <0.01 |
| Tumor neucrosis factor-α (pg/mL) | 17.7±7.2 | 21.7±4.1 | 9.9±5.2 | <0.01 | 15.6±7.4 | 21.3±4.2 | 9.9±5.2 | <0.01 |
Data of Electromyography
| Variables | Amplitude Decrease | Conduction Velocity Decrease | Abnormal Nerves | ||
|---|---|---|---|---|---|
| Motor | Sensory | Motor | Sensory | ||
| Upper limb (n, %) | 163 (93.1) | ||||
| Median | 57 (32.6) | 106 (60.6) | 27 (15.4) | 15 (8.6) | |
| Ulnar | 55 (31.4) | 52 (29.7) | 26 (14.9) | 50 (28.6) | |
| Lower limb (n, %) | 171 (97.7) | ||||
| Tibial | 72 (41.1) | - | 49 (28.0) | - | |
| Common peroneal | 95 (54.3) | - | 58 (33.1) | - | |
| Sural | NA | 31 (17.7) | - | 11 (6.3) | |
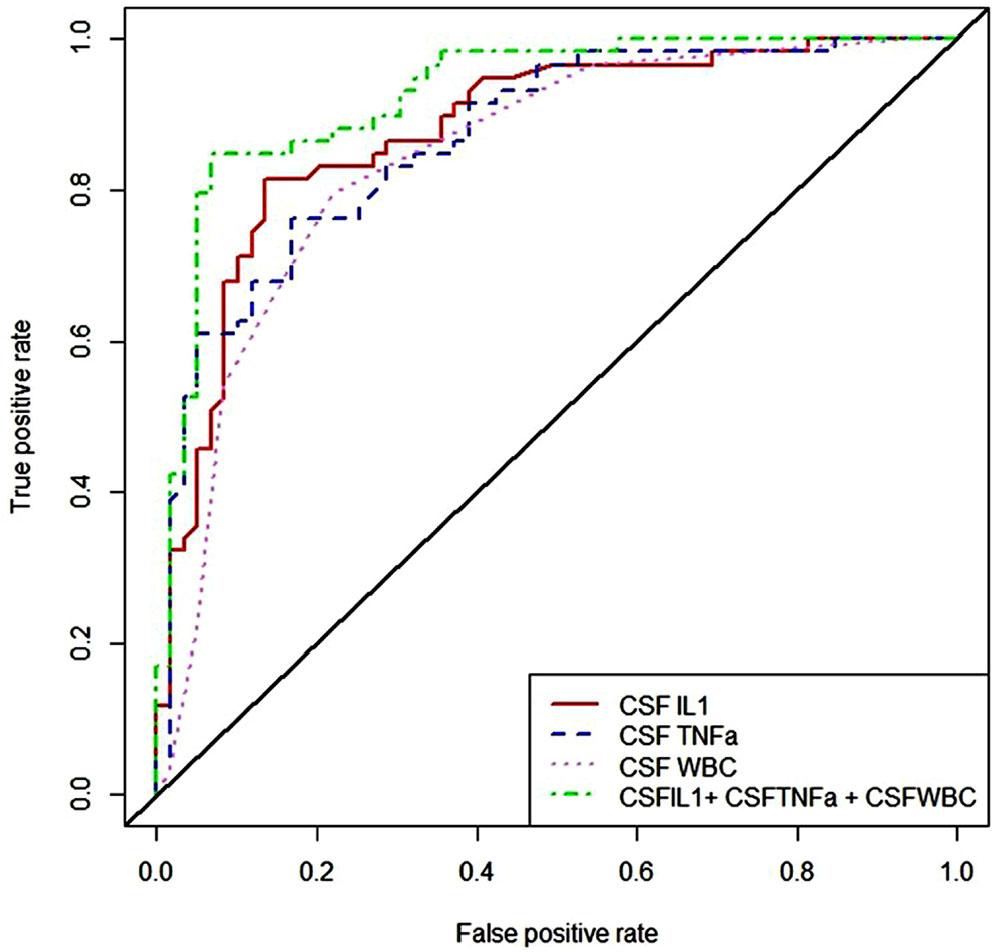
ROC Analysis of 3 Indicators and Their Combined Mode in CSF
| Variables | Cut-off value | AUC (95% CI) | P | Sensitivity (%) | Specificity (%) |
|---|---|---|---|---|---|
| IL1 (pg/mL) | 19.250 | 0.878 (0.815–0.941) | <0.01 | 81.4 | 86.4 |
| TNF-α (pg/mL) | 17.050 | 0.867 (0.803–0.931) | <0.01 | 76.3 | 83.1 |
| WBC (× 106/L) | 2.500 | 0.843 (0.772–0.914) | <0.01 | 79.7 | 78.0 |
| IL1+ TNFa + WBC | 41.900 | 0.926 (0.879–0.974) | <0.01 | 84.3 | 93.2 |
Demographics and Clinical Data
| Characteristics | CIP Patients | Non-CIP Patients | P |
|---|---|---|---|
| Counts | 116 | 59 | |
| Cause of sepsis | 0.77 | ||
| Intestinal puncture or fistulation | 21 (18.1) | 10 (16.9) | |
| Colon obstruction or fistulation | 23 (19.8) | 9 (15.3) | |
| Pulmonary infection | 16 (13.8) | 9 (15.3) | |
| Severe pancreatitis | 9 (7.8) | 3 (5.1) | |
| Thoracic and mediastinum infection | 7 (6.0) | 2 (3.4) | |
| Bile duct infection | 3 (2.6) | 3 (5.1) | |
| Intrauterine infection | 3 (2.6) | 2 (3.4) | |
| Diarrhea associated with antibiotics | 7 (6.0) | 6 (10.2) | |
| Liver abscess | 7 (6.0) | 8 (13.6) | |
| Spleen rupture and infection | 6 (5.2) | 2 (3.4) | |
| Blood stream infection | 14 (12.1) | 5 (8.5) | |
| General information | |||
| Age (years) | 57.7±15.0 | 56.9±15.4 | 0.76 |
| Female | 49 (42.2) | 32 (54.2) | 0.13 |
| Diabetes history | 39 (33.6) | 28 (47.5) | 0.08 |
| BMI (kg/m2) | 21.7±4.2 | 20.8±3.7 | 0.17 |
| Hemoglobin (g/L) | 110.2±20.1 | 112.1±17.5 | 0.54 |
| WBC (× 109/L) | 10.8±2.9 | 10.5±3.1 | 0.54 |
| Blood sugar (mmol/L) | 8.1±3.3 | 7.8±3.7 | 0.59 |
| Albumin (g/L) | 27.4±7.9 | 28.3±7.3 | 0.47 |
| Lactate (mmol/L) | 7.5±4.2 | 5.2±3.4 | <0.01 |
| SOFA | 11.5±4.6 | 9.2±4.0 | <0.01 |
| APACHE II | 19.0±5.9 | 16.4±5.1 | <0.01 |
| Outcomes | |||
| MV assistance | 67 | 22 | 0.01 |
| Death in 28 days | 29 | 6 | 0.02 |
| ICU length of stay (day) | 19.4±8.6 | 16.5±5.3 | 0.01 |
| Hospital length of stay (day) | 27.2±16.1 | 23.9±7.7 | 0.08 |
Conditional Logistical Regression Analysis
| Variables | β | OR | 95% CI | Z value | Wald chi-square values | P |
|---|---|---|---|---|---|---|
| Lactate | 0.083 | 1.087 | 0.941–1.256 | 1.13 | 1.27 | 0.26 |
| SOFA | 0.059 | 1.061 | 0.934–1.204 | 0.91 | 0.83 | 0.36 |
| Age | 0.004 | 1.004 | 0.979–1.03 | 0.29 | 0.08 | 0.78 |
| CSF | ||||||
| Protein | 0.001 | 1.001 | 0.998–1.004 | 0.46 | 0.21 | 0.64 |
| WBC | 2.688 | 14.696 | 2.204–98 | 2.78 | 7.71 | 0.006* |
| IL-1 | 0.337 | 1.401 | 1.089–1.801 | 2.62 | 6.88 | 0.009* |
| TNF-a | 0.426 | 1.531 | 1.165–2.012 | 3.056 | 9.34 | 0.002* |