
Fig. 1.
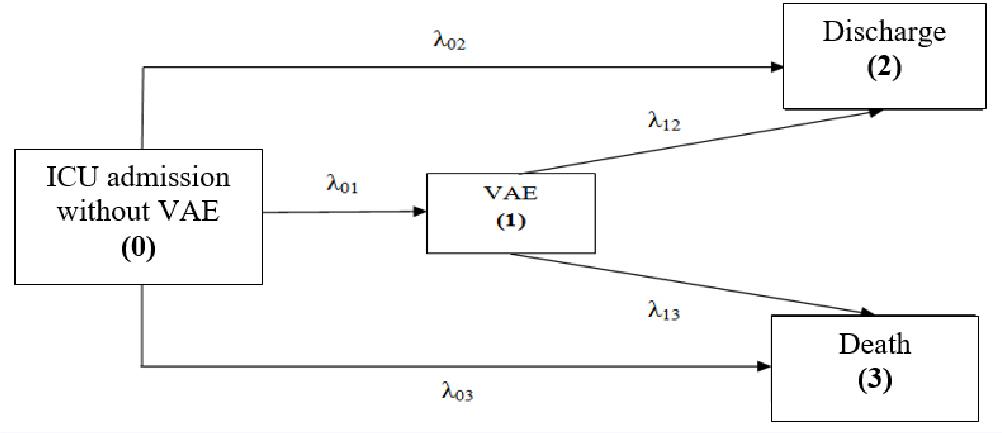
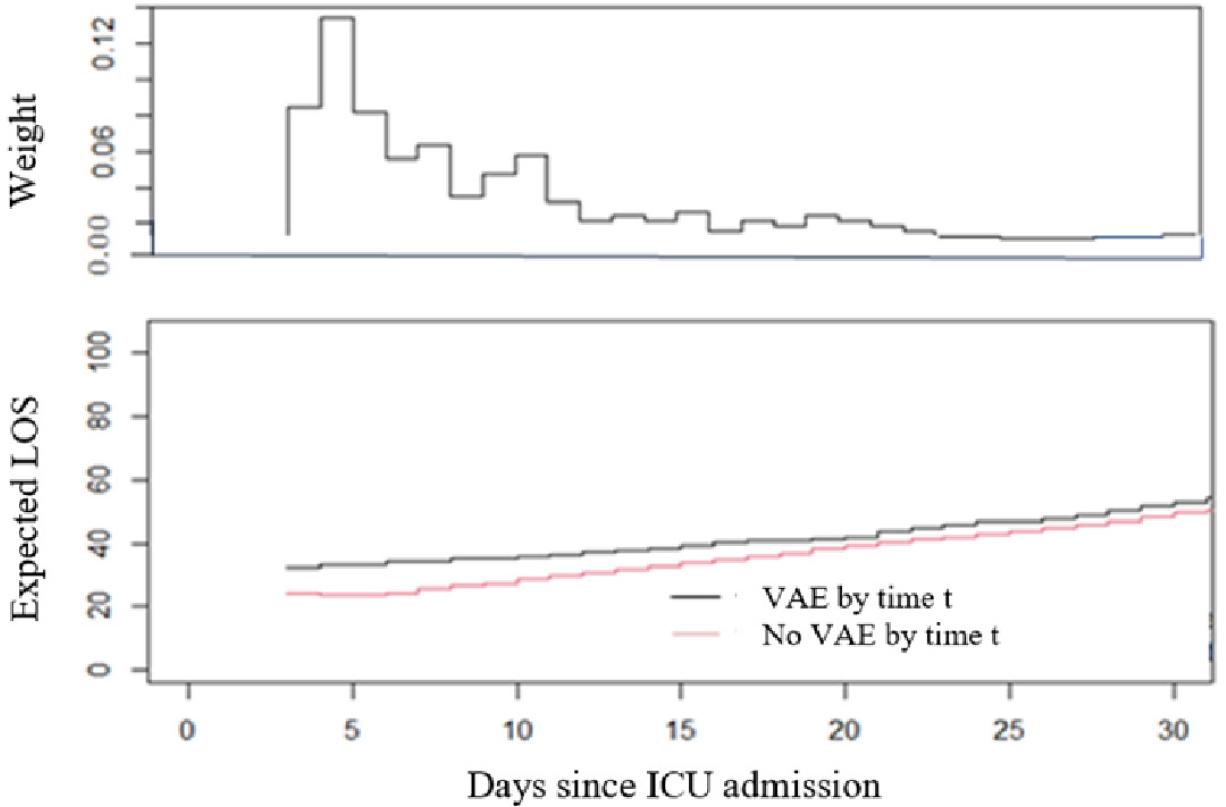
Fig. 2.
Death and discharge hazard ratio for patients with VAE
| Types of VAE | Death hazard ratio (95% CI) | Discharge hazard ratio (95% CI) |
|---|---|---|
| VAC | 1.401 (0.938–2.063) | 0.704 (0.509–0.960) |
| IVAC | 1.223 (0.721–1.984) | 0.755 (0.494–1.116) |
| PVAP | 1.471 (0.701–2.788) | 0.493 (0.233–1.044) |
| VAEs | 1.582 (1.101–2.278) | 0.614 (0.470–0.797) |
Mean additional length of stay associated with VAEs
| Additional ICU days regarding discharge ± SE | 95% BCa CI | Additional ICU days regarding death ± SE | 95% BCa CI | Total additional ICU days ± SE | 95% BCa CI | |
|---|---|---|---|---|---|---|
| VAC | 4.50 ± 1.93 | 1.14–8.87 | 2.43 ± 1.22 | 0.21–4.81 | 6.93 ± 2.38 | 2.45–11.83 |
| IVAC | 1.92 ± 1.81 | −0.93–6.18 | 5.35 ± 2.45 | 0.85–10.48 | 7.27 ± 2.94 | 1.68–13.08 |
| PVAP | 3.99 ± 2.65 | −0.25–10.30 | 7.09 ± 5.38 | −1.21–18.57 | 11.08 ± 5.65 | 0.60–22.05 |
| All VAEs | 3.25 ± 1.37 | 0.71–6.08 | 3.30 ± 1.17 | 1.10–5.64 | 6.55 ± 1.78 | 2.76–9.73 |
Multi-state analysis of Ventilator-Associated Events
| Constant hazards from MSM | |
|---|---|
| VAE hazard | λ01 |
| Discharge hazard without VAE | λ02 |
| Death hazard without VAE | λ03 |
| Discharge hazard with VAE | λ12 |
| Death hazard with VAE | λ13 |
Multi-state model constant hazards
| Constant hazards (95% CI) | VAE | VAC | IVAC | PVAP |
|---|---|---|---|---|
| λ01 VAE hazard | 0.026 (0.022–0.030) | 0.011 (0.009–0.014) | 0.005 (0.003–0.007) | 0.001 (0.001–0.002) |
| λ02 Discharge hazard without VAE | 0.033 (0.028–0.038) | 0.029 (0.026–0.034) | 0.028 (0.025–0.032) | 0.028 (0.025–0.032) |
| λ03 Death hazard without VAE | 0.010 (0.007–0.013) | 0.011 (0.009–0.014) | 0.012 (0.010–0.014) | 0.012 (0.010–0.014) |
| λ12 Discharge hazard with VAE | 0.020 (0.016–0.025) | 0.021 (0.015–0.027) | 0.021 (0.014–0.031) | 0.014 (0.006–0.027) |
| λ13 Death hazard with VAE | 0.016 (0.012–0.020) | 0.016 (0.011–0.022) | 0.014 (0.091–0.023) | 0.018 (0.008–0.033) |
The direct additional cost per VAE episode
| Direct additional cost per VAE episode, € | |||
|---|---|---|---|
| Additional cost regarding death | Additional cost regarding discharge | Total additional cost | |
| VAC | 1,197.50 | 2,217.60 | 3,415.10 |
| IVAC | 2,636.48 | 946,17 | 3,582.65 |
| PVAP | 3,493.95 | 1,966.27 | 5,460.22 |
| All VAEs | 1,626.24 | 1,601.60 | 3,227.84 |
The characteristics of patients with and without ventilator-associated events
| VAE | P Value | ||
|---|---|---|---|
| Yes | No | ||
| Gender | 0.451 | ||
| Male | 88 (61.5) | 134 (57) | |
| Age, years (Median, Interquartile range) | 59 (46–73) | 61 (45–74) | 0.649 |
| Type of patient | |||
| Medical | 74 (51.7) | 115 (48.9) | 0.671 |
| Surgical | 69 (48.3) | 120 (51.1) | |
| McCabe score | |||
| Non-fatal disease | 49 (34.3) | 114 (48.5) | 0.007 |
| Ultimately fatal disease | 16 (11.2) | 20 (8.5) | 0.470 |
| Rapidly fatal disease | 78 (54.5) | 101 (43) | 0.034 |
| Admission diagnosis | |||
| Trauma | 42 (29.4) | 43 (18.3) | 0.016 |
| Neurological disease | 30 (21) | 42 (17.9) | 0.500 |
| Pulmonary disease | 33 (23.1) | 35 (14.9) | 0.053 |
| Post-operative observation | 18 (12.6) | 66 (28.1) | 0.000 |
| Cardiovascular disease | 11 (7.7) | 26 (11.1) | 0.372 |
| Malignancy | 5 (3.5) | 17 (7.2) | 0.175 |
| Other (burn, poisoning) | 4 (2.8) | 6 (2.6) | 1.000 |
| Death | 63 (44.1) | 55 (23.4) | 0.000 |